TRANSFERT DE CHARGE ET D’ÉNERGIE
DANS LES DYADES ET OLIGOMÈRES DE PORPHYRINE
Par
Mohammed Abdelhameed
Mémoire présenté au Département de Chimie en vue de l’obtention du grade de maître ès sciences (M. Sc.)
FACULTÉ DES SCIENCES UNIVERSITÉ DE SHERBROOKE
Le 25 juin
Le jury a accepté le dépôt du mémoire de monsieur Mohammed Abdelhameed Dans sa version finale
Membres du jury
Professeur Pierre Harvey Directeur de recherche Département de chimie
Professeur Patrick Ayotte Membre interne Département de chimie
Professeur Gessie Brisard Président-rapporteur Département de chimie
II
CHARGE AND ENERGY TRANSFER
IN PORPHYRIN DYADS AND OLIGOMERS
By
Mohammed Abdelhameed
Thesis submitted to the Chemistry department as part of the fulfillment required to the Master degree (M. Sc.).
FACULTÉ DES SCIENCES UNIVERSITÉ DE SHERBROOKE
III
RESUMÉ
Le travail de recherche présenté dans ce mémoire fut inspiré par le processus de la photosynthèse qui se produit chez les plantes. Au cours de ce processus l’énergie solaire est convertie en énergie chimique via différentes étapes de transferts d’électrons et d’énergie. En maîtrisant bien ces concepts, de nombreuses applications, telles que les cellules photovoltaïques ou les DEL (Diodes électro-luminescentes) peuvent être améliorées. Pour se faire, il est important d’optimiser les propriétés des matériaux existants (oligomères, polymères, etc…) en préparant des systèmes conjugués plus efficaces, mais aussi de pleinement comprendre les processus qui s’y produisent (processus de transferts d’électrons et d’énergie photo-induist). La série d’oligomères et de polymères présentée dans ce mémoire le sont pour leurs applications dans des systèmes photoniques.
Dans cette optique, ce mémoire a été divisé en cinq grands chapitres. Le premier présente les principes théoriques de la photophysique. Le second présente le suivi du transfert d’énergie T1dans les états triplets, T1, une dyade constituée de la tétraphénylporphyrine de
zinc(II), [ZnTPP], et de la bis(phénylpyridinato)(bipyridine) d’iridium(III), [Ir], chromophores liés avec un pont trans-diéthynylbis(phosphine)-platine(II). Malgré que cette dyade soit entièrement conjuguée et qu’elle soit constituée d’un donneur ([ZnTPP]) et d’un accepteur ([Ir]), aucun transfert d’énergie T1 [Ir] → S1/T1 [ZnTTP] n’a été observé.
Ce résultat fut attribué à l’absence de recouvrement des orbitales moléculaires entre la HSOMO(donneur*) et la HSOMO(accepteur), LSOMO(accepteur) and LSOMO (donneur*) (mécanisme de Dexter). Ainsi, l’échange d’électrons est impossible. Ce chapitre suggère que l’équation de Dexter, kDexter = KJexp(-2rDA/L) ne reste qu’une
approximation. Ce travail a été publié dans ChemComm (2013, 49, 5544-5546).
Le troisième chapitre présente le transfert d’énergie singulet beaucoup lent qu’attendu se produisant dans une dyade constituée d’une porphyrine de zinc(II) avec une porphyrine base libre liées par un pont palladium(II) (trans-PdI2). Sachant que cette dyade est
entièrement conjuguée et que la distance entre les deux centres de masse des porphyrines est relativement courte, ce système aurait dû présenter un transfert d’énergie très rapide, d’après la théorie de Förster. Dans ce cas, ce comportement a été expliqué par le faible
IV
recouvrement des orbitales frontières (OM) du donneur et de l’accepteur. Ce travail a été accepté le 2014-05-26 dans Chemistry – A European Journal (chem.201403146).
Le quatrième chapitre rapporte une étude du transfert d’énergie ultra-rapide (650 fs) entre des états singulets dans une dyade composé d’une porphyrine de zinc(II) (le donneur) et une porphyrine base libre (l’accepteur) liées à l’aide d’un pont de palladium (,trans-Pd(NH)2(CO)2). Ces résultats ont été attribués à la présence d’un couplage fort entre les
OM du donneur et de l’accepteur et de la très faible contribution (atomique) du Pd(II) vers ces OM. Cette dyade montre la plus rapide constante de transfert d’énergie kET que nous
connaissons pour des dyades similaires contentant un fragment métallique. Les résultats du troisième et quatrième chapitre montrent que la théorie de Förster tel quel ne suffit pas pour prédire les vitesses de transferts d’énergie dans certains systèmes : d’autres facteurs doivent être pris en compte. Ce travail a été soumis dans JACS ( ja-2014-061774, 19-6-2014).
Dans le cinquième chapitre de ce mémoire, la synthèse du bis(--(amino(4-éthynylbenzene (triméthylsilane)(R))))bis(4-éthynylbenzene-(triméthylsilane))quinone diimine (R= H, Boc) comme modèle pour des polymères conjugués et non-conjugués contenant le colorant porphyrine a été proposée. Le corps du composé désiré (tétrakis(4-éthynlyphenyl)quinone-1,4-diimine-2,5-diamine) a montré un transfert de charge partant des groupes terminaux riches en électrons une la benzoquinone centrale plus pauvre. La nature de l’émission fut observée uniquement à 77K pour le cas où R = H et fut attribuée à de la fluorescence. À température ambiante, l’intensité était trop faible pour être observée. Dans le cas où R = Boc, aucune emission n’a été détectée. Malheureusement, le composé espéré ne fut pas obtenu, le procédé de synthèse employé engendra uniquement la forme réduite. Cette forme fut malgré tous analysé, et ne présenta pas de transfert de charge ni de communication entre les différents chromophores. Ceci a été expliqué simplement par le fait que la conjugaison est brisée quand ce composé est sous sa forme réduite. Ce travail sera soumis au Journal of
Inorganic and Organometallic Polymers and Materials. Mots clés:
V
SUMMARY
The research work presented in this master thesis is inspired by the photosynthetic process occurring in plants where solar energy is converted into chemical energy via several energy and electron transfer processes. In the light of these concepts, several applications such as solar cells and light emitting diodes can be improved. To do so, we need to optimize the properties of polyads, oligomers and polymers to device more efFficient conjugated materials as well as developing a full understanding of the photo-induced energy and electron transfer processes that occur. Several organometallic oligomers and polymers are presented in this thesis due to their potential photonic applications.
In this respect, this master thesis has five chapters. The first one introduces some theoritical principles of photophysics. The second one presents the monitoring of triplet state (T1)
energy transfer in a dyad that consists of zinc(II)tetraphenylporphyrin, [ZnTPP], and bis(phenylpyridinato)-(bipyridine)iridium(III), [Ir], chromophores linked by a platinum(II) containing bridge. Despite the conjugation in this dyad and the presence of the [ZnTPP] energy donor and the [Ir] energy acceptor species, no T1 [Ir] → S1/T1 [ZnTTP] energy
transfer occurs. This result was explained by the absence of MO overlap between HSOMO(donor*) and HSOMO(acceptor), LSOMO(donor*) and LSOMO(acceptor) , and hence no efficient double electron transfer exchange (i.e. Dexter mechanism) is likely to occur. This chapter suggested that Dexter formulation, kDexter = KJexp(-2rDA/L), appears as
an approximation. This work has been published in ChemComm (2013, 49, 5544-5546).
The third chapter shows an unexpected slow singlet energy transfer in a dyad built upon a zinc(II)porphyrin and the corresponding free base chromophores linked by a palladium(II)- containing bridge (trans-PdI2), despite the presence of conjugation and the relative short
center-to-center distance. This behavior was explained by two factors, the first is the lack of large molecular orbitals (MOs) overlaps between the frontier MOs of the donor and acceptor, and thus preventing a double electron exchange to occur through the trans-PdI2
bridge. The second factor affected the energy transfer is the electronic shielding induced by the presence of this same linker, namely the electron rich iodides, preventing the two
VI
chromophores to fully interact via their transition dipoles. This work has been accepted on 2014-05-26 in Chemistry-A European Journal (chem.201403146).
The fourth chapter reports an ultrafast singlet energy transfer (650 fs) in a dyad composed of a zinc(II)porphyrin (donor) and a free base porphyrin (acceptor) ,-linked via trans-Pd(NH)2(C=O)2. These results were explained by the presence of strong MO couplings of
the donor and acceptor and the very weak atomic contribution of the Pd(II) atom to this MO. This dyad shows the fastest energy transfer rate kET among other similar dyad systems
incorporating a bridge either in the form of a metal fragment or carbon-based. The results of these third and fourth chapters showed that the Förster mechanism is not enough to account for the energy transfer in some systems and other factors affect that transfer. This work has been submitted in JACS ( ja-2014-061774, 19-6-2014).
In chapter 5, the synthesis of bis--(amino(4-ethynylbenzene (trimethylsilane)(R))bis(4-ethynylbenzene-(trimethylsilane))quinone diimine (R = H, Boc) as a model for conjugated and unconjugated porphyrin dye polymers was proposed. The central core of the desired compound, tetrakis(4-ethynlypenyl)quinone-1,4-diimine-2,5-diamine, provided evidence for a charge transfer interaction from the electron richer terminal groups to be more electron poorer benzoquinone ring. The nature of the emission of the core compound was found to be fluorescence at 77K for the case R = H but was too weak to be observed at 298K. No emission was detected for the case R = Boc. Unfortunately, the synthetic route of the desired compound gave the reduced form. The analyses of the reduced compound showed the complete absence of the charge transfer or any communication between the different chromophores due to the broken conjugation between the porphyrin units in the reduced product. This work will be submitted to Journal of Inorganic and Organometallic
Polymers and Materials. Keywords:
VII
ACKNOWLEDGEMENT
I would like to thank Professor Pierre D. Harvey for giving me the opportunity to pursue my master’s studies in his laboratory. I especially thank him for his guidance and support. His advices given to me were greatly appreciated.
I would like to thank all of my colleagues, who all significantly contributed to my training and understanding of chemical research: Adam Langlois, Antoine Bonnot, Antony Lapprand, Ahmed Soliman , Peng Luo, Xiaorong Wang, Hu Lei, Lounès Haroune and Di
Gao.
Many thanks to Dr. René Gagnon, Dr. Daniel Fortin, Dr. Jean Marc Chapuzet and Dr. Shawkat Aly for their help and advices. Special thanks to Dr. Paul-Ludovic Karsenti for all the measurements that he has done for me.
I would like to thank my family for their support during all of my studies.
Finally, thanks to the Université de Sherbrooke for having admitted me to the M.Sc. program and to the CQMF (centre québécois sur les materiaux fonctionnels), FQRNT (fonds de recherche sur la nature et les technologies) and the CEMOPUS (Centre d’Excellence sur les Matériaux Optiques et Photoniques de l’Université de Sherbrooke) for their financial support which is absolutely essential for such research.
VIII
TABLE OF CONTENT
Resumé... III
Summary... V
Acknowlegements... VII
Table of Contents... VIII
List of Abbreviations... XI
List of Tables... XII
List of Figures... XIV
List of Schemes... XXII List of Charts... XXIII
Introduction... 1
CHAPTER 1. Theory... 8
1.1. Electronic absorption and emission spectroscopy... 8
1.2. Excitation energy migration... 8
1.3. Electron transfer... 9 1.4. Light absorption... 11 1.5. Luminescence... 15 1.6. Jablonski diagram... 17 1.7. Emission lifetime... 21 1.8. Quantum yield (Φ)... 23 1.9. Energy transfer... 24
1.9.1. Radiative energy transfer... 24
1.9.2. Radiationless energy transfer... 25
1.9.2.1. Förster mechanism... 25
1.9.2.2. Dexter mechanism... 26
1.10. Transient absorption spectroscopy (Flash Photolysis)... 28
CHAPTER 2. Monitoring the on/off switching of the electronic communication in diethynylplatinum(II)-bridged dyads using triplet energy transfer……….. 30
2.1. Manuscript... 31
IX
2.1.2. Introduction... 31
2.1.3. Results and Discussion... 32
2.1.4. Conclusion... 38
References... 38
2.2. Supporting Information... 41
References... 60
CHAPTER 3. Unexpected drastic decrease in the excited state electronic communication between porphyrin chromophores covalently linked by a palladium(II) bridge. 62 3.1. Manuscript... 63
3.1.1.Abstract... 63
3.1.2. Introduction... 64
3.1.3. Results and Discussion... 66
3.1.4. Conclusion... 89
3.1.5. Experimental Section... 89
References... 95
3.2. Supporting Information... 99
Chapter 4. Ultrafast energy transfer in a Pd(II)-bridged bisporphyrin dya... 128
4.1. Manuscript... 129
4.1.1. Abstract... 129
4.1.2. Introduction... 129
4.1.3. Results and discussion... 131
4.1.4. Conclusion... 137
4.1.5. Experimental Section... 137
References... 138
4.2. Supporting Information... 140
X
Chapter 5
.
Bis--(amino(4-ethynylbenzene(trimethylsilane)(R))bis(4-ethynyl benzene(trimethylsilane))quinone diimine (R = H, Boc) as potential building blocks for conjugated porphyrin dye-containing polymers exhibiting low-energy band gaps... 178 5.1. Manuscript... 5.1.1. Introduction... 179 1795.1.2. Spectroscopy of TAI, TAI-Boc and the model compound TAA... 185
5.1.3. DFT Computations... 187
5.1.4. Photophysical characterization of the final product TAA... 193
5.1.5. Conclusion... 195 5.1.6. Experimental Section... 195 References... 199 5.2.Supporting Information
.
... 200 References... 220 General Discussion... 221 Conclusion... 226 References... 228XI
LIST OF ABBREVIATIONS DFT Density functional theory
TDDFT Time-dependent density functional theory (TDDFT)
MLCT Metal to ligand charge transfer
LLCT ligand to ligand charge transfer
[ZnTPP] zinc(II) tetraphenylporphyrin
S0 singlet ground state
S1 first singlet excited state T1 first triplet excited state
λ wavelength
A absorption
UV ultraviolet
Φ quantum yield
τ lifetime
HOMO Highest Occupied Molecular Orbital
LUMO Lowest Unoccupied Molecular Orbital
HSOMO Highest Singly OccupiedMolecular Orbital
LSOMO Lowest Singly OccupiedMolecular Orbital
µs microsecond ns ps nanosecond picosecond K Kelvin
kET rate of energy transfer
τp phosphorescence lifetime
τF fluorescence lifetime
2-MeTHF 2-methyltetrahydrofuran
XII
LIST OF TABLES
CHAPTER 2: Monitoring the on/off switching of the electronic communication
in diethynylplatinum(II)-bridged dyads using triplet energy transfer.
Table 1. Emission lifetimes of 2, 3, 6 and 10 (2-MeTHF)... 36
Table S1. Electrochemical data for 10 and 6... 47
Table S2. Atomic contributions to the MOs of 6 and 10... 53
CHAPTER 3. Unexpected drastic decrease in the excited state electronic communication between porphyrin chromophores covalently linked by a palladium(II) bridge. Table 1. Absorption data of [Zn], [Fb], [Zn-Zn], [Fb-Fb] and [Zn-Fb]... 71
Table 2. Relative atomic contributions of the various fragments in [Zn-Fb]... 73
Table 3. Computed positions (), oscillator strengths (f) and major contributions of the electronic transitions of [Zn-Fb] (H = HOMO, L = LUMO)... 75
Table 4. Photophysical data of [Zn], [Fb], [Zn-Zn], [Fb-Fb] and [Zn-Fb] in 2MeTHF... 76
Table 5. Structural, spectral and photophysical data for the calculations of kET of [Zn-Fb]... 82
Table 6. Relative atomic contributions of the various fragments in [Zn-Fb]... 86
Table S1. Relative atomic contributions of the various fragments in [Fb-Fb]... 108
Table S2. Relative atomic contributions of the various fragments in [Zn-Zn]... 108
Table S3. Relative atomic contributions of the various fragments in [PtFb-Fb]... 109
Table S4. Relative atomic contributions of the various fragments in [PtZn-Zn]... 109
Table S5. The electronic transitions of [Fb]... 110
Table S6. The electronic transitions of [Zn]... 111
Table S7. The electronic transitions of [Fb-Fb]... 112
Table S8. The electronic transitions of [Zn-Zn]... 113
CHAPTER 4. Ultrafast energy transfer in a Pd(II)-bridged bisporphyrin dyad. Table 1. Fluorescence lifetimes and quantum yields (in 2-MeTHF)... 133
XIII
Table 2. Atomic contributions (%) of the frontier MOs of [Fb-Zn]... 136
Table S1. Absorption data... 154
Table S2. Relative atomic contributions of the various fragments in [Fb-Fb]... 166
Table S3. Relative atomic contributions of the various fragments in [Zn-Zn]... 166
Table S4. Relative atomic contributions of the various fragments in [Zn-Fb]... 166
Table S5. The electronic transitions of [Fb]... 167
Table S6. The electronic transitions of [Zn]... 168
Table S7. The electronic transitions of [Fb-Fb]... 169
Table S8. The electronic transitions of [Zn-Zn]... 171
Table S9. The electronic transitions of [Zn-Fb]... 173
CHAPTER 5. Bis--(amino(4-ethynylbenzene(trimethylsilane)(R))bis(4-ethynyl- benzene(trimethylsilane))quinone diimine (R = H, Boc) as potential building blocks for conjugated porphyrin dye-containing polymers exhibiting low-energy band gaps. Table 1. Calculated phosphorescence energy and wavelength for compound TAI. 187 Table 2. The S0-T1 bond difference, Δ bond, distorted angles and dihedral angles for both singlet and triplet optimized geometries of TAI. NA, NB and NC are adjacent atoms to the studied atom, X, where the bond length was determined between NA and X. The angles were determined between NA, NB and X while the dihedral angles were determined between NA, NB, NC and X... 189
Table 3. Relative atomic contributions of the various units... 192
Table 4. Computed positions of 10 first electronic transitions, oscillator strength (f) and the major contributions for TAI (left) and TAI-Boc (right)... 192
Table 5. Emission lifetimes and quantum yield of compound TAA... 195
Table S1. The electronic transitions of TAI... 204
Table S2. The electronic transitions of TAI-Boc... 206
Table S3. The calculated phosphorescence wavelength for compound TAI-Boc... 209
Table S4. The S0-T1 bond, angle and dihedral angle differences (Δ bond, Δ angle and Δ dihedral angle, respectively) for both singlet and triplet optimized geometries of TAI... 210
XIV
LIST OF FIGURES
Introduction
Figure 1. Light is absorbed by the antenna and the energy is transferred to the
reaction centrer... 2
Figure 2. Delocalized 18 π -electron conjugation pathway and tautomerism of the
16 membered ring of the porphyrin... 3
Figure 3. UV-visible spectrum of [ZnTPP] showing the Soret band and Q-bands. 4
Figure 4. UV-visible spectrum of [H2TPP] showing the soret band and Q-bands. 4 CHAPTER 1. Theory
Figure 5. The exciton and energy transfer process (Modified from Ref. 1)... 9
Figure 6. Photoinduced electron transfer process... 10
Figure 7. Schematic representation of potential energy surfaces for the ground
state(DA), the excited state (DA*, reactant state), and the charge-separated state (D+-A-,product state), as proposed by Marcus theory. λ = total reorganization energy, and TS = transition state (modified from ref. 9)... 10
Figure 8. The relative order of electronic, vibrational and rotational energy levels… 14
Figure 9. (a) Potential energy diagram for a diatomic molecule, illustrating the
Frank-Condon excitation and, r is the nuclear coordinate. (b) Intensity distribution among vibronic bands as determined by Frank-Condon principle... 15
Figure 10. Jablonski diagram showing different states and transitions... 18
Figure 11. Potential energy curves and vibronic structures of fluorescence spectra. 20
Figure 12. Relative positions of absorption, fluorescence and phosphorescence..…. 21
Figure 13. Mechanism of the energy transfer according to Förster... 25
Figure 14. Mechanism of the energy transfer according to Dexter... 27
Figure 15. State diagram showing the pathway leading to T1-Tn absorption... 28
CHAPTER 2. Monitoring the on/off switching of the electronic communication in
diethynylplatinum(II)-bridged dyads using triplet energy transfer.
XV
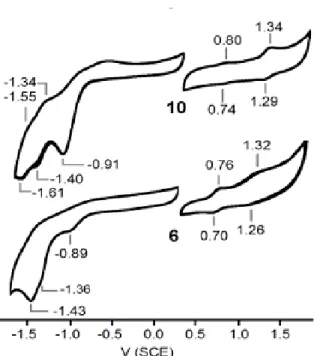
Figure 2. CV traces of 3, 6 and 10 in degassed ACN at 298 K. Scan rate = 50 mV
s-1, with 0.1 M n-Bu4NPF6 as the supporting electrolyte. The peak data are placed in
the ESI. Data for 3 from ref. 7a... 34
Figure 3. Absorption (black), excitation (blue) and emission (red) spectra of 2, 6 and 10 in 2MeTHF at 298 K (see ESI for the 77K spectra). ... 35
Figure 4. Structures and kET(T1) for 11-13 (with d(Cmeso-Cmeso)). The arrows indicate the direction of the T1 energy transfer... 37
Figure S1. CV traces of 10 and 6 in degassed ACN at 298 K. Scan rate = 200 mV s -1, with 0.1 M n-Bu 4NPF6 as the supporting electrolyte... 48
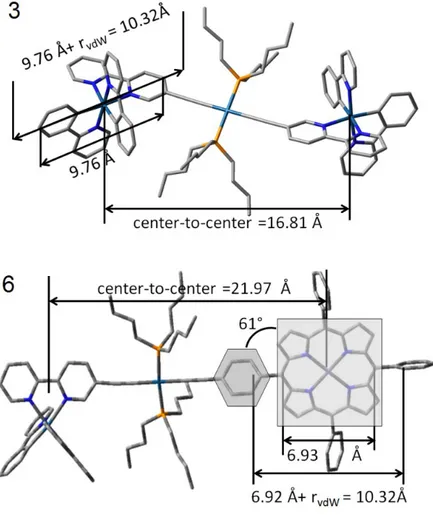
Figure S2. Optimized geometry of 3 and 6 (DFT; B3LYP) stressing on the rDA and rvdW data... 49
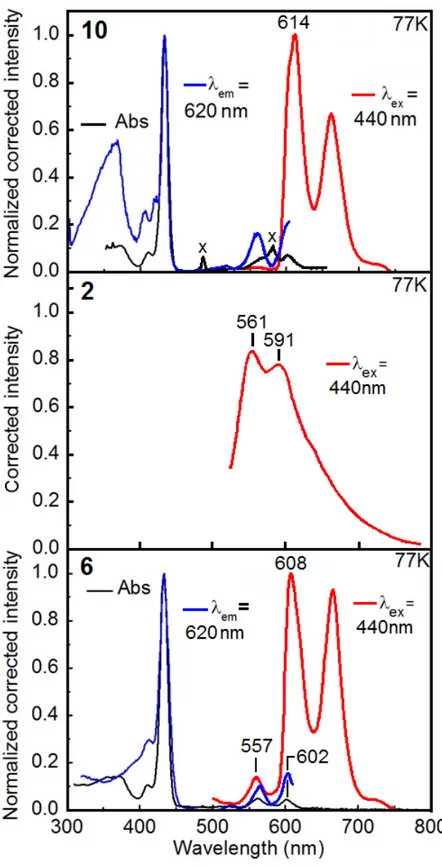
Figure S3. Absorption (black), emission (red) and excitation (blue) spectra of 10, 2 (from ref. 4) and 6 in 2MeTHF at 77 K. The signals marked with an X are instrumental artifacts... 50
Figure S4. Representations of the frontier MOs for compound 10 (the energy is in a.u.)... 51
Figure S5. Representations of the frontier MOs for compound 6 (the energy is in a.u.)... 52
Figure S6. 1H NMR spectrum for (10)... 54
Figure S7. 13C NMR spectrum for (10)... 55
Figure S8. 31P NMR spectrum for (10)... 56
Figure S9. 1H NMR spectrum for (6)... 57
Figure S10.13C NMR spectrum for (6)... 58
Figure S11.31P NMR spectrum for (6)... 59
CHAPTER 3. Unexpected drastic decrease in the excited state electronic communication between porphyrin chromophores covalently linked by a palladium(II) bridge. Figure 1. Structures of literature hetero-dyads and triads (Ar = 3,5-tBu2Ph)... 65
Figure 2. Structures of imidazolium salts [M] and dimers [M-M] (Ar = 4-tBuPh).... 66
Figure 3. Optimized geometry of a) [Zn-Zn], b) [Fb-Fb], and c) [Zn-Fb] in the U-
XVI
for clarity. The lowest energy conformations are set to 0 kJ.mol–1, and the others are destabilized by a given energy relative to the lowest energy conformation... 69
Figure 4. Absorption (black), fluorescence (red) and excitation (blue) spectra of [Fb-Fb] (top) [Zn-Zn] (centre) and [Zn-Fb] (bottom) in 2MeTHF at 298 (left) and
77K (right)... 70 Figure 5. Representation of the frontier MOs for [Zn-Fb] (S-hape)... 73 Figure 6. Bar graph showing the oscillator strength as a function of the calculated positions of the electronic transitions (blue) for [Zn-Fb]. The black line is the generated spectrum when assigning 1000 cm-1 for each transition... 74
Figure 7. Time resolved fluorescence spectra of [Zn-Fb] in 2MeTHF at 298 (left)
and 77K (right) using the Streak camera. Top: time-resolved spectra. Middle: reconstructed spectra giving rise to the overall spectra shown above. Bottom: decay and rise traces... 77
Figure 8. Transient absorption spectra of [ZnFb] in 2MeTHF at 298K (left;exc=
660, right; 620 nm). Frames A and B: 2D maps of T/T vs wavelength vs time. Frames C and D: reconstruction of the transient spectra of the various intermediates. Frames E and F: decay and rise traces monitored at various wavelengths. Decays > 3 ns are unreliable. The values indicated inside the insets are values extracted from the best fits... 79 Figure 9. Some structures of dyads bridged by 1,4-benzene groups and their kET
values. The arrows indicate the direction of the energy transfer. The center-to-center distance is 13.7 Å according to computer modelling... 80
Figure 10. Spectral overlap (grey zone) between the absorption of [Fb-Fb] and the
fluorescence spectra of [Zn-Zn] for the direction [Zn]*→[Fb] (left) and the absorption of [Zn-Zn] and the fluorescence spectra of [Fb-Fb] for the direction
[Zn]←[Fb]* (right)... 81
Figure 11. Structures of two dyads bridged by a dibenzofuran and a carbazole
spacer and their kET’s at 298 and 77K. The arrows indicate the direction of the
energy transfer... 84
Figure 12. Top and side views of the electron density map of [Zn-Fb] extracted
XVII
electron density is the largest and lowest, respectively. Note that the dicationic Pd(II)-bridge is not in red, and a slice of the ESP map has been removed to allow a
better view of the central Pd-atom... 85
Figure 13. Structures of the computed models containing a trans-PtI2 bridge (Ar = 4-tBuPh)... 85
Figure 14. Top and side views of the ESP map of compound 3 extracted from DFT computations. The red and blue regions indicate the area where the electron density is the largest and lowest, respectively. Note that the dicationic Pt(II)-bridge is not in red, and the scaling for this map is identical to that use to generate Figure 9... 87
Figure 15. Frontier MOs representations of [Zn-Fb] in its lowest energy triplet state... 88
Figure S1. Representation of the frontier MOs for [Fb] and [Zn]... 102
Figure S2. Representation of the frontier MOs for [Fb-Fb]... 103
Figure S3. Representation of the frontier MOs for [Zn-Zn]... 104
Figure S4. Representation of the frontier MOs for [PtFb-Fb]... 105
Figure S5. Representation of the frontier MOs for [PtZn-Fb]... 106
Figure S6. Representation of the frontier MOs for [PtZn-Zn]... 107
Figure S7. Bar graph showing the oscillator strength as a function of the calculated positions of the electronic transitions (gray) for [Fb]... 114
Figure S8. Bar graph showing the oscillator strength as a function of the calculated positions of the electronic transitions (gray) for [Zn]. The black line is the generated spectrum when assigning 1000cm-1 for each transition... 115
Figure S9. Bar graph showing the oscillator strength as a function of the calculated positions of the electronic transitions (gray) for [Fb-Fb]. The black line is the generated spectrum when assigning 1000 cm-1 for each transition... 116
Figure S10. Bar graph showing the oscillator strength as a function of the calculated positions of the electronic transitions (gray) for [Zn-Zn]. The black line is the generated spectrum when assigning 1000cm-1 for each transition... 117
Figure S11. Frontier MO representations of the [Fb] and [Zn] in its lowest energy triplet state... 118
XVIII
state... 118
Figure S13. Frontier MO representations of the [Fb-Fb] in its lowest energy triplet state... 119
Figure S14. Representation of the frontier MOs for compound [Zn-Pt-Pd]... 120
Figure S15. 1H NMR spectrum of [Fb-Fb] (200 MHz, 25°C, CDCl3)... 121
Figure S16. 1H NMR spectrum of [Zn-Zn] (200 MHz, 25°C, CDCl3)... 122
Figure S17. 1H NMR spectrum of [Zn-Zn] (200 MHz, 25°C, CDCl3 + 5% CD3OD)... 123
Figure S18. 1H NMR spectrum of complex [Zn-Fb] (200 MHz, 25°C, CDCl3)... 124
Figure S19. 1H NMR spectrum of complex [Fb2Pd2] (200 MHz, 25°C, CDCl3)... 125
Figure S20. 1H 2D NMR (CDCl3, 200 MHz, 25°C) spectra COSY (left side) and NOESY (right side) of complex [Fb2Pd2]... 126
Figure S21. Variable temperature 1H NMR (CDCl3, 400 MHz) spectra of complex [Fb2Pd2]... 127
CHAPTER 4. Ultrafast energy transfer in a Pd(II)-bridged bisporphyrin dyad Figure 1. Absorption (black), fluorescence (red) and excitation (blue; limit of the instrument = 610 nm) spectra of respectively (top to bottom) [Zn-Zn], [Fb-Fb], and [Fb-Zn] in 2MeTHF at 298 K………. 132
Figure 2. Top: Time resolved emission spectra of [Fb-Zn] in 2MeTHF at 298 K. Bottom: Decay traces of the [Fb-Zn] fluorescence ……….. 133
Figure 3. Top: Time evolution of the transient absorption spectra of [Fb-Zn] in 2MeTHF at 298 K. The signals above and below 0 are respectively the bleached and transient signals. Middle: Deconvolution of the individual components necessary to explain the transient spectra. Their lifetimes are given in the inset. Bottom: decay and rise traces of the transient spectra at various wavelengths... 134
Figure 4. Representation of the frontier MOs for [Fb-Zn]. Bottom. Bar graph reporting the calculated oscillator strengths (f) as a function of the positions of the electronic transition (blue). The black trace is the same but applying a thickness of 1000 cm-1 to each bar. The tables showing the contribution for each transition for [Fb-Zn], [Zn-Zn], and [Fb-Fb] are placed in the ESI. No vibronic transition is included in these calculations... 135
XIX
Figure S1. 1H NMR of the heterodyad [Zn-Fb](bottom: aromatic part at 400 MHz). 146
Figure S2. 1H-1H COSY spectrum of heterodyad [Zn-Fb] (aromatic part only)... 147
Figure S3. 13C (top) and DEPT135 (bottom) of the heterodyad (cryo, 125 MHz)... 148
Figure S4. Absorption spectrum of the heterodyad [Zn-Fb]... 149
Figure S5. Heterodyad [Zn-Fb] experimental and simulated mass spectra... 150
Figure S6. 1H NMR of [Fb] (aromatic part)... 151
Figure S7. 1H NMR of the [Zn] (aromatic part)... 151
Figure S8. 1H NMR of the homodimer [Fb-Fb] (aromatic part at the bottom)... 152
Figure S9. 1H NMR of the homodimer [Zn-Zn] (aromatic part at the bottom)... 153
Figure S10. Absorption (black), fluorescence (red) and excitation (blue) spectra of [Zn-Zn] (top), [Zn-Fb] (centre) and [Fb-Fb] (bottom) in 2MeTHF at 298 (left) and 77K (right)... 155
Figure S11. Time resolved fluorescence spectra of [Zn-Zn] in 2 MeTHF at 298 K using the Streak camera. Top: time-resolved spectra. Bottom: decay and rise traces. 156 Figure S12. Time resolved fluorescence spectra of [Zn-Zn] in 2 MeTHF at 77 K using the Streak camera. Top: time-resolved spectra. Bottom: decay and rise traces.. 157
Figure S13. Time resolved fluorescence spectra of [Fb-Fb] in 2 MeTHF at 298 K using the Streak camera. Top: time-resolved spectra. Bottom: decay and rise traces.. 158
Figure S14. Time resolved fluorescence spectra of [Fb-Fb] in 2 MeTHF at 298 K using the Streak camera. Top: time-resolved spectra. Bottom: decay and rise traces.. 159
Figure S15. Transient absorption spectra of [Zn-Zn] in 2MeTHF at 298K (up), reconstruction of the transient spectra of the various intermediates (middle) and decay and rise traces monitored at various wavelengths (bottom). The values indicated inside the insets are values extracted from the best fits... 160
Figure S16. Transient absorption spectra of [Fb-Fb] in 2MeTHF at 298K (up), reconstruction of the transient spectra of the various intermediates (middle) and decay and rise traces monitored at various wavelengths (bottom). The values indicated inside the insets are values extracted from the best fits... 161
Figure S17. A representation of the frontier MOs for [Fb] (left) and [Zn] (right)... 162
Figure S18. A representation of the frontier MOs for [Fb-Fb]... 163
XX
Figure S20. A representation of the frontier MOs for [Zn-Fb]... 165
Figure S21. Bar graph showing the oscillator strength, f, as a function of the calculated positions of the electronic transitions (blue) for [Fb-Fb]. The black line is the generated spectrum when assigning 1000 cm-1 for each transition... 175
Figure S22. Bar graph showing the oscillator strength, f, as a function of the calculated positions of the electronic transitions (blue) for [Zn-Zn]. The black line is the generated spectrum when assigning 1000 cm-1 for each transition... 175
CHAPTER 5. Bis--(amino(4-ethynylbenzene(trimethylsilane)(R))bis(4-ethynyl-benzene(trimethylsilane)) quinone diimine (R = H, Boc) as potential building blocks for conjugated porphyrin dye-containing polymers exhibiting low-energy band gaps. Figure 1. The absorption at 298K (black), at 77K (purple), emission (red) and the excitation (blue) spectra at 77K of TAI (up) and TAI-Boc (bottom) in 2MeTHF... 185
Figure 2. The decay (black), IRF (blue) curves of TAI in 2MeTHF at 77K. Inset: population of lifetimes used to fit the decay using the ESM (orange). The maximum of this distribution is the most probable lifetime... 186
Figure 3. Representation of the frontier MOs of TAI... 190
Figure 4. Representation of the frontier MOs of TAI-Boc... 190
Figure 5. Bar graph showing the oscillator strength, f, as a function of the calculated positions of the electronic transitions (blue) for TAI (up) and TAI-Boc (below). The black line is the generated spectrum when assigning 1000 cm-1 for each transition... 191
Figure 6. The absorption (black), excitation (blue) and fluorescence (red) spectra of TAA in 2MeTHF at 298 (left) and 77 K (right)... 194
Figure 7. The absorption (black), fluorescence (red) and the excitation (blue) spectra at 298K of TAA (top) and ZnTPP (bottom)... 194
Figure S1. The structures of TAI and TAI-Boc... 201
Figure S2. The optimized structures of TAI (up) and TAI-Boc (down)... 202
Figure S3. Triplet optimized structure of TAI... 203
Figure S4. Triplet optimized structure of TAI-Boc... 203
XXI
Figure S6. 1H NMR of TAI-Boc... 214
Figure S7. 1H NMR of TAI-Boc-H... 215
Figure S8. 1H NMR of TAA... 216
Figure S9. Mass spectrum of Compound TAI... 217
Figure S10. Mass spectrum of Compound TAI-Boc... 218 Figure S11. Mass spectrum of Compound TAA... 219
XXII
LIST OF SCHEMES
CHAPTER 2. Monitoring the on/off switching of the electronic communication
in diethynylplatinum(II)-bridged dyads using triplet energy transfer.
Scheme 1. Synthesis of 6 and 10. i) CuI, CH2Cl2, i-Pr2NH. ii) CH2Cl2... 33
CHAPTER 3. Unexpected drastic decrease in the excited state electronic
communication between porphyrin chromophores covalently linked by a palladium(II) bridge.
Scheme 1. Synthesis of mononuclear [Fb-Fb] and dinuclear [Fb2Pd2] complexes
(Ar = 4-tBuPh)... 67
Scheme 2. Synthesis of mononuclear [Zn-Zn] and [Zn-Fb] (Ar = 4-tBuPh)... 67
CHAPTER 4. Ultrafast energy transfer in a Pd(II)-bridged bisporphyrin dyad.
Scheme 1. Structures of the palladium(II) bridged dimers and dyad... 130
Scheme 2. Structures of the two previously reported metallo-bridged dyads. The
arrows show the direction of the energy transfers... 131
Scheme 3. Comparison of various dyads and their kET’s. The arrows indicate the
direction of the S1 ET... 134
Scheme S1. Synthesis of the dyads [Zn-Zn], [Zn-Fb] and [Fb-Fb]... 143
CHAPTER 5.
XXIII
LIST OF CHARTS
Introduction
Chart 1. Structures of the compounds [Ir]-Pt-[ZnTpp], [2Zn-Fb] and [3Zn-Fb].
5
Chart 2. Structure of the polymers P1 and P2... 6
Chart 3. Structure of TAI-Znpor... 6
Chapter 5. Bis--(amino(4-ethynylbenzene(trimethylsilane)(R))bis(4-ethynyl benzene (trimethyl -silane)) quinone diimine (R = H, Boc) as potential building blocks for conjugated porphyrin dye-containing polymers exhibiting low-energy band gaps.
Chart 1. The structure of chlorophyll a... 180
Chart 2. Structures of Plastoquinone and Plastoquinol... 180
Chart 3. Structure of polymers P1, P2 and P3... 181
Chart 4. The Structure of TAI-Znpor... 180
5.2. Supporting Infornation
Chart 1. The numbering atoms of TAI... 209
General Discussion
Chart 4. Structures of [Ir]3, [Ir]n and [Ir]-Pt-[ZnTPP]... 221 Chart 5. The structure of [Ir]2... 222 Chart 6. The structure of the proposed compound... 223
Chart 7. structures of [Zn-Fb](left) and [Fb-Zn](right)... 224
1
INTRODUCTION
Nowadays, one of the biggest challenges the world faces is the rising global consumption of energy. The U.S. Energy Information Administration (EIA) predicted that the world energy consumption will increase from 524 quadrillionBritish thermal units, Btu, in 2010 to 630 quadrillion Btu in 2020 and 820 quadrillion Btu in 2040, a 30-year increase of 56 percent.1 Currently most of the world’s energy supply comes from the fossil fuels, such as coal, gas and oil which leads to several environmental problems generated by burning fossil fuels. Using sunlight to produce energy is one of the most sustainable energy solutions to overcome many of these problems. One hour of the whole sun illumination is equivalent to the yearly energy consumption of our world today2. what happens in nature is that sunlight is dispersed hence the light needs to be captured, stored and converted to other forms of energy such as electrical or chemical to be useful. In a similar manner, the green plant absorbs the sunlight and the absorbed energy is converted into chemical energy via a complex series of electron and energy transfer processes.
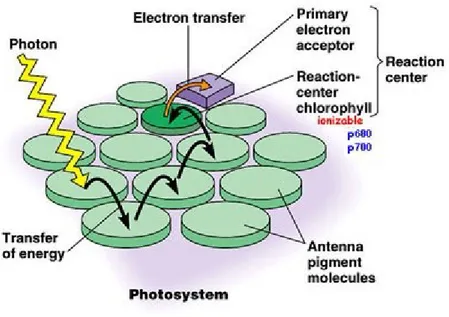
Photosystems are functional and structural units of protein complexes involved in photosynthesis that carry out the primary photochemistry of photosynthesis which includes the absorption of light and the transfer of energy and electrons. There are two types of photosystems, PSII and PSI. At the heart of the photosystem lies the reaction center protein, which is a complex supramolecular device that uses light to reduce molecules. This reaction center is surrounded by light-harvesting complexes that enhance the absorption of light and transfer the energy to the reaction centers. Light-harvesting and reaction center complexes are membrane protein complexes that are made of several protein-subunits and contain numerous cofactors. There are two families of reaction centers, type I and II reaction centers (absorb light at 700 and 680 nanometers, for PSI and PSII in the chloroplasts, respectively). This overall series of processes are represented in Figure 1. Understanding the mechanism of this process may lead to efficient artificial photosynthetic systems.
2
Figure 1. Light is absorbed by the antenna and the energy is transferred to the reaction
centrer.3
Photosynthesis includes two processes,4 the light and dark reactions respectively. The light
reaction occurs in the thylakoid membrane and converts light energy to chemical energy.
This chemical reaction must, therefore, take place in the light. Chlorophyll and several other pigments such as -carotene are organized in clusters in the thylakoid membrane and are involved in the light reaction. Each of these differently colored pigments can absorb different color of light and pass its energy to the central slipped chlorphyll dimer molecule (called the special pair) to perform the photosynthetic process (photo-induced electron transfer). The central part of the chlorophyll structure is similar to that of porphyrin which consists of several fused rings of carbon and nitrogen with a magnesium ion in the center.
3
Porphyrins and their metal derivatives have been the subject of spectroscopic, photophysical, and photochemical study for several decades.5 The importance of these compounds is due to their applications such as in photodynamic therapy,6 as chemical and biological sensors,7 as molecular logic 8 and optoelectronic devices,9 and in artificial solar energy harvesting and storage schemes,10 which has prompted a widespread renewal of interest among both experimentalists and theorists.
Electronic absorption properties of porphyrins
The delocalised aromatic character of porphyrins, which results from extensive conjugation (Figure 2), accounts for the one of the most striking features of these chromophores. The UV-visible absorption spectrum of porphyrins consists of two distinct regions. In the ultra violet region, an extremely intense absorption known as the (*) Soret or B bands and in the visible region, a number of absorptions known as the (*) Q bands are present.
Figure 2. Delocalized 18 π -electron conjugation pathway and tautomerism of the 16
membered ring of the porphyrin.
The UV-visible spectrum of Zn(II)tetraphenylporphyrin, [ZnTPP], showed significant absorption bands (Figure 3) in the visible and near UV regions which is assigned to the Soret band and Q-band in the visible region. The first one corresponds to a strongly allowed transition from the ground state to the second exited state (S0→S2). The latter
4
Figure 3. UV-visible spectrum of [ZnTPP] showing the Soret band and Q-band.
For a free-base tetraphenylporphyrin, [H2TPP], which possesses a D2h symmetry across
the plane of the ring, the opposing protons stabilize an 18-membered cyclic polyene, with each proton causing a one electron perturbation of the macrocycle. This perturbation causes the split in the absorption bands in the visible region but not in the ultraviolet (Figure 4).The splitting about the origin of transitions for porphyrins of lower symmetry arise from the mixing of anti-symmetrised products which are nearly or accidentally degenerate, and is known as inter-configurational interaction.
5
Several dyads that incorporate porphyrin chromophores were synthesized, studied and analyzed photophysically revealing results that vary from absent to slow to ultra-fast energy transfer. This master thesis reports an example of a dyad that showed an unexpected absence of energy transfer: [Ir]-Pt-[Zntpp] (Chapter 2).11 An example for a slow energy transfer is compound [2Zn-Fb] when compared to other dyads having similar structural features (Chapter 3). Conversely, compound [3Zn-Fb] (Chart 1; Chapter 4) shows an ultra-fast energy transfer from the zinc(II)porphyrin to the free base porphyrin. The overlap extent of the frontier molecular orbitals, MOs, between the donor and acceptor is one of the key factors which determine how efficient the energy transfer in the molecule is.
Chart 1. Structures of the compounds [Ir]-Pt-[ZnTpp], [2Zn-Fb] and [3Zn-Fb].
The incorporation of porphyrins in the backbone of polyanilines in its different forms (the reduced, oxidized and mixed valence forms) models in a way the natural photosynthetic proteins PSII. These “bio-inspired” polymers shows a charge transfer from the terminal porphyrins to the central benzoquinone ring. Two bioinspired polymers of this type were reported. The first one, P1,12 (Chart 2) was built on an electron rich (zinc(II)porphyrin) unit and an electron poor (quinone diimine) center, which are similar structually to chlorophyll
a and plastoquinone, respectively, involved in the photosynthetic process. An example for
the unconjugated polymer that shows low band gap (i.e. here a charge transfer absorption) is composed of an electron rich zinc(II)porphyrin unit that is incorporated in the backbone of a quinone-containing polymer (at the α-position), P2, (Chart 2; work performed by Mrs. Xiaorong Wang; Ph.D. candidate in our laboratory; unpublished results). To further understand the charge transfer processes occurring in polymers P1 and P2, the synthesis of
6
TAI-Znpor as a model compound that combines both the conjugated and unconjugated
motifs within the same assembly is necessary.
Chart 2. Structure of the polymers P1 and P2.
Chart 3. Structure of TAI-Znpor
Objectives of this thesis
This research project focused on the photophysics of bisporphyrin dyad systems and oligomers where the donors and acceptors are linked together by a conjugated metal-containing fragment of a benzoquinone. This aim is motivated by the high possibility of photo-induced electron and energy transfer properties of these chromophores and their potential applications in the field of optoelectronic devices, sensors, luminescent markers, and solar energy conversion.
7
Again, the specific interest is focused on compounds designed for the study of photo-induced singlet (S1) and triplet (T1) energy transfers and a large emphasis was given to the
study of bisporphyrin dyads linked by metallo-bridges (specifically Pt(II) and Pd(II) ions) and metalloporphyrin-containing oligomers with potential photonic applications.
8
CHAPTER 1
Theory
This chapter outlines the theory, the physical basis and the different techniques that are used to characterize photoactive systems including absorption, energy and electron transfer, excitation energy migration and emission without a chemical reaction which is called photophysical studies of the matter.
1.1. Electronic absorption and emission spectroscopy
When a molecule (M) absorbs light, the resulting molecule will have an excess energy. It is then an excited molecule (M*)(Equation 1.1). This molecule can simply re-emit the excess energy as the form of light to go back to its ground state (Equation 1.2).
M + hυ → M* [1.1]
M*→ M + hυ [1.2]
The excited molecule (M*) can transfer its excess energy to another acceptor molecule, A.
This process is also called quenching (Equation 1.3).
M*+ A → M + A* [1.3]
1.2. Excitation energy migration
If there are two molecules in close proximity, one with an absorption band at a wavelength shifted to the longer wavelengths than the other, light energy absorbed by the one absorbing at the shorter wavelength (i.e. higher energy) is often transferred to the one that absorbs at the longer wavelength. One molecule acts as a donor, D, of excitation energy, and the other as an acceptor, A, of this energy. This transfer probably takes place by a resonance mechanism which is described in terms of quantum mechanics. Remotely placed chromophore molecules do not participate directly in the primary photochemical process in photosynthesis, but transfer their excitation energy to the chromophore molecules directly
9
associated with the reaction centers that lead to the primary charge separation (formation of high energy anion and cation).
Excitation energy is in the form of an electron placed in the LUMO and a hole in the HOMO in the S1 excited state of the molecule. Then this energy is transfered from one
chromophore to another. This process is called excitation energy migration. What are transferred are the excited electron and the hole from one molecule to the neighbour. (Figure 5). The mechanism for this process arises from dipole-dipole interactions.
Figure 5. The exciton and energy transfer process ( Modified from Ref. 13).
Energy transfer between different chromophore molecules is known as heterogeneous transfer, unlike the homogeneous transfer that occurs between identical molecules. The energy transfer can be repeated many times, giving rise to energy migration. Direct evidence of energy transfer between different chromophores is provided by sensitized fluorescence. Light quanta absorbed by molecules of one chromophore are transferred to molecules of another chromophore. When the first chromophore is excited, only fluorescence of the second is observed. This phenomenon of sensitized fluorescence is well known from studies on gases and solutions. The two possible mechanisms (Dexter and Förster) for this process are decribed below.
1.3. Electron transfer
The process of photoinduced electron transfer (PET) is considered one of the most basic photochemical reactions and at the same time it is the most favourable way to convert light
10
energy or to store it for further applications. The process is taking place between a donor and an acceptor of electron after excitation resulting in the formation of a charge-separated state which relaxes to the ground state via an electron-hole recombination. The process (PET) involves an electron transfer within an electron donor-acceptor pair as shown in Figure 6.
Figure 6. Photoinduced electron transfer process.
Marcus theory was used to interpret the photoinduced electron transfer in solution by which the electron transfer reaction can be treated using transition state theory where the reactant state representing the excited donor/acceptor while the product state is the charge-separated state of donor cation and acceptor anion (D+-A-), as shown in Figure 7. [14-20]
Figure 7. Schematic representation of potential energy surfaces for the ground state(DA),
the excited state (DA*, reactant state), and the charge-separated state (D+-A-,product state), as proposed by Marcus theory. λ = total reorganization energy, and TS = transition state (modified from ref. 21).
According to the Franck-Condon principle, the photoexcitation induces a vertical transition to the excited state which proceeds to a rapid nuclear equilibration. After exciting the
11
donor, electron transfer occurs at the crossing of the equilibrated excited state surface and the product state. The change in Gibbs free energy associated with the electron transfer event is given by the following Equation (Equation 1.4) :
[1.4]
The total reorganization energy (λ), which is required to distort the reactant structure to the product structure without electron transfer, is composed of a solvent (λS) and internal (λi)
components (λ = λS +λi ). The reaction free energy (ΔGo), is the difference in free energy
between the equilibrium configuration of the reactant (DA*) and product states (D+A-). The
internal reorganization energy represents the energy change that occurs in bond lengths and bond angles distortion during the electron transfer step and is usually represented by a sum of harmonic potential energies. In the classical Marcus theory, the rate for electron transfer is given by:[17-18]
[1.5]
where is the effective frequency of motion along the reaction coordinate and is the electronic transmission factor. The transmission factor is related to the transition probability (Po) at the intersection of two potential energy surfaces, as given by the
Landau-Zener theory:[19] [1.6] 1.4. Light absorption
Light is generally considered an electromagnetic radiation that can be viewed as waves or particles.
In the wave model, the electromagnetic radiation is treated as a wave emitted from a source and is characterised by (Equation 1.7):
12
⁄ [1.7]
where λ is the wavelength, c is the velocity of light (2.998 108 m/s) and ν is the frequency. In the particles model, light is composed of particles which are called photons (particles having no mass but only energy). Each photon has an energy of Plank's quantum, h c/ λ, where h is Plank's constant (h = 6.62 10-34 Js), c is the light velocity and λ is the wavelength of the radiation.
The photon absorption by a system (M) leads to photophysical or / and photochemical processes as it was stated by the Grotthus-Draper law.
Indeed, the optical transmittance, T, is a measure for how much light enters a sample and that is then absorbed (Equation 1.8).
⁄ [1.8]
where I is the intensity of the transmitted light and Io is the intensity of the incident light.
Absorbance, A, is the logarithm of the ratio of the intensity of the transmitted light to the intensity of the incident light (Equation 1.9).
A ⁄ [1.9]
and hence
A ⁄ [1.10]
Beer's law states that, the absorbance of a chromophore increases in proportion to the concentration of the latter (Equation 1.11).
A α c
A = k c
[1.11] [1.12]
where k is a constant.
Lambert's law stated that the absorbance is directly proportional to the path length (Equation 1.13).
13 A α l
A= kʹ l
[1.13]
[1.14]
where l is the path length and kʹ is a constant.
The Beer-Lambert law combines the two laws giving
A = ε l c [1.15] where ε is the molar absorption coefficient.
The absorption of a photon by a molecule at a certain wavelength leads to an excited molecule where the absorbed energy can be translated into rotational, vibrational and electronic modes. The quantized internal energy, Eint, of the molecule in both its ground
and excited stated can be approximated by (Equation 1.16).
Eint = Eel + Evib+ Erot [1.16]
where Eel , Evib, Erot are the electronic, vibrational and rotational energies respectively.
According to the Born-Oppenheimer approximation, as the electronic transitions are very fast and occur in about 10-15s compared to the characteristic time scale for molecular vibrations that occur in 10-12 s, the influence of the vibrational and the rotational motions are almost negligible.
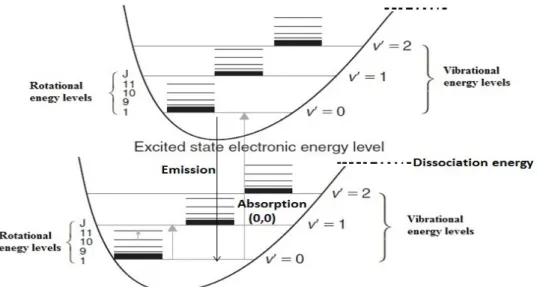
The Frank-Condon principle states that the electronic transition occurs mostly without change in the position of the nuclei in the molecular entity and its environment and hence, it is possible to describe the molecular energy by a potential energy diagram (Figure 8).
14
Figure 8. The relative order of electronic, vibrational and rotational energy levels
(modified from Ref. 15).
However the UV-Vis spectrum for most molecules is expected to be simple as only one or two lower energy electronic transitions are normally postulated, but it is usually more complicated .
The Frank-Condon principle indicates that both the vibrational and electronic transitions will be observed in the spectrum. According to this concept for a diatomic molecule, let's consider the example in Figure 9. According to the Boltzman distribution, at room temperature, most of the molecules are in the lowest vibrational level (ν) of the ground state (i.e., ν = 0). The absorption in the spectrum (Figure 5b) exhibits a combination of both the pure electronic transitions (i.e., from ν = 0 to ν\ = 0) and several vibronic peaks for which intensities depend on the relative position and shape of the potential curves of the ground and excited atates.
In the example provided in Figure 9, the 0-2 peak has the highest intensity as going from ν = 0 in the ground state to ν = 2 in the excited sate is the most probable for vertical transitions as it falls on the highest point in the vibrational probability curve in the excited state.
15
Figure 9. (a) Potential energy diagram for a diatomic molecule, illustrating the
Frank-Condon excitation and, r is the nuclear coordinate. (b) Intensity distribution among vibronic bands as determined by the Frank-Condon principle. (Modified from Ref. 22). The emission and excitation spectra are two types of distinct spectra but they usually overlap. The excitation spectrum is normally known as the spectrum of light emitted by the material as a function of the excitation wavelength while the absorption spectrum is known as the spectrum of light absorbed by the material as a function of the wavelength. Usually, these two spectra, absorption and excitation, should overlap perfectly. The absorption of a photon by a molecule can lead to electron migration from the highest occupied molecular orbital, HOMO, to the lowest unoccupied molecular orbital, LUMO.
1.5. Luminescence
Luminescence is the emission of light by a substance not resulting from heat. It is thus a form of cold body radiation. It can be caused by chemical reactions, electrical energy, subatomic motions or stress on a crystal.
Types of Luminescence
1.5.1. Chemiluminescence is an emission of light as a result of a chemical reaction.
There are two types of chemiluminescence. The first type is bioluminescence which is an emission as a result of biochemical reaction by a living organism. The second type is electrochemiluminescence which is an emission as result of an electrochemical reaction.
16
1.5.2. Crystalloluminescence is produced during crystallization. There are two types of crystalloluminescence. The first type is the electroluminescence which is a result of an electric current passed through a substance. An example of devices using this process is the light emitting diode (LED). The second type is the cathodoluminescence which is a result of a luminescent material being struck by the electrons. Examples for this process involve the well-known neon tube light.
1.5.3. Mechanoluminescence is a result of a mechanical action on a solid. There are four
types of mechanoluminescence. The first type is the triboluminescence which is generated when bonds in a material are broken when that material is scratched, crushed, or rubbed. The second type is the fractoluminescence which is generated when bonds in certain crystals are broken by fractures. The third type is piezoluminescence which is produced by the action of pressure on certain solids. The fourth type is the sonoluminescence which is a result of imploding bubbles in a liquid when excited by sound.
1.5.4. Photoluminescence is a result of absorption of photons. There are two types of
photoluminescence. The first type is fluorescence which shows photoluminescence as a result of singlet–singlet electronic relaxation . The typical lifetime of fluorescence is the nanoseconds range. The second type is phosphorescence which shows photoluminescence as a result of triplet–singlet electronic relaxation. The typical lifetime of phosphorescence ranges from milliseconds to hours.
1.5.5. Radioluminescence is a result of bombardment by ionizing radiation.
1.5.6. Thermoluminescence is the re-emission of absorbed light when a substance is
17
Generally when a molecule absorbs a photon, it is described as an excited molecule (i.e. a molecule lying in an upper electronic excited state) and after a certain time, the excited state molecule can relax by a number of different pathways. One of these pathways is conversion to a triplet state that can then relax towards lower lying states through phosphorescence and some nonradiative steps including chemical reactions and isomerization.
The Molecular Orbital theory (MO) is a method for determining molecular structure in which electrons are treated as moving under the influence of the nuclei in the whole molecule. In Molecular Orbital theory, the bonding between atoms is described as a combination of their atomic orbitals. It allows to predict the distribution of electrons in a molecule which in turn can help predict molecular properties such as shape, magnetism, and bond order.
The Frontier Molecular Orbital theory (FMO) is an application of MO theory in which a good approximation for reactivity could be found by looking at the frontier orbitals (HOMO/LUMO). The HOMO is the orbital of highest energy that is still occupied, so energetically it is easy to remove electrons from this orbital. This could be simply donating electron density to form a bond. The LUMO is the lowest lying orbital that is empty, so energetically it is the easiest to add more electrons into this orbital.
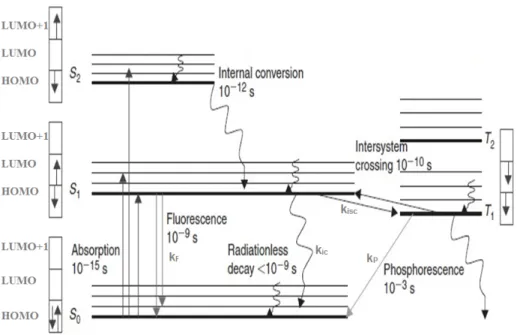
1.6. Jablonski diagram
It is an energy diagram that represents the different electronic states and transitions in molecules (Figure 10). S0 represents the electronic ground state and S1, S2 represent the
first and second singlet excited states respectively. T1 and T2 represent the first and second
triplet excited states respectively. In the singlet states, all electrons spin are paired and the multiplicity of this state is 1 while in the triplet state, the electrons are no longer antiparallel and the electronic spin multiplicity is 3 as the total spin states can take values of -1, 0 and 1. The triplet state is more stable than the singlet state because of the Coulomb repulsion energy between the two electrons and the increase in degree of freedom of the magnetic spins.
18
Figure 10. Jablonski diagram showing different states and transitions (Modified from Ref.
22).
In Figure 6, the arrows in the boxes represent the electron spins when they are paired in the singlet states and in the triplet states where electrons are no longer antiparallel. The subscript indicates the relative energetic position compared to other states of the same multiplicity. The symbols kF, kisc, kic, kP represent the fluorescence, intersystem crossing,
internal conversion and phosphorescence rate constant respectively. Different processes in Jablonski diagram include the absorption, vibrational relaxation and internal conversion, fluorescence, intersystem crossing and phosphorescence.
1.6.1. Absorption
The first transition in the Jablonski diagram is the absorption of a photon of a particular energy by the molecule (the characterization of this process has already been provided in section 1.3). This process is indicated in the diagram by a straight arrow pointing up. The absorbance is a very fast transition which occurs on the order of 10-15 second.
1.6.2. Vibrational relaxation and internal conversion
Once the electron is excited, hence generating a molecule in its excited state (S1,S2,..,T1,T2,..etc), there are several pathways by which the energy may be dissipated.
19
First is through vibrational relaxation, a nonradiative process which is represented in the Jablonski diagram as curved arrows between vibrational levels. The vibrational relaxation is where the accumulated energy is released as kinetic energy (i.e. heat) and the molecule relaxes to a lower vibrational level of the same electronic state. The kinetic energy may stay within the same molecule or it could be transfered to other molecules around the excited molecule (i.e. the solvent for example). This process is very fast occuring on the order of 10-11-10-14 second.
The internal conversion is another nonrdiative process which is observed when the excited molecule relaxes to a lower excited state of the same multiplicity (i.e. S2 → S1; S1 → S0). It
is mechanistically identical to the vibrational relaxation except it occurs between two different electronic states. It is indicated in the Jablonski diagram as a curved line between two vibrational levels in two different electronic states. This process occurs in the time scale of 10-12 second.
1.6.3. Fluorescence
This is a radiative process taking place between two electronic states (excited and ground states) of the same multiplicity (e.g., S1→S0 and S2→S0). The lifetime of the fluorescence
is typically on the order of (10-8-10-9 second for S1→S0). It is indicated in Jablonski
diagram as a straight line going down on the energy axis between two different electronic states.
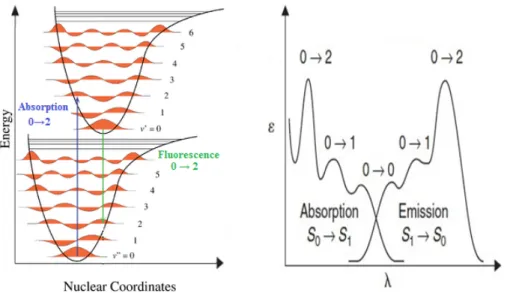
Generally, the fluorescence band is a mirror image of the absorption band (S0→ S1) (Figure
11). This is particularly true for rigid molecules (such as aromatics) as the Frank-Condon principle is applicable. The vibronic peaks are also expected to be present in both directions (S1→S0 and S0→S1) in the fluorescence band. There are some exceptions to this
rule, when the molecule changes geometry very much in its excited state. The difference in the wavelength between the (0,0) absorption and emission peaks is known as the Stokes
20
Figure 11. Potential energy curves and vibronic structures of fluorescence spectra
(Modified from Ref. 23).
1.6.4. Intersystem crossing (ISC)
It is another nonradiative process which occurs when an electronically excited molecule changes spin multiplicity from an excited singlet state to an excited triplet state or the inverse. This process occurs on a time scale of (10-6-10-8 second) for organic molecules and 10-11 second for organometallics. This rate enhancement is due to spin-orbit coupling that is induced by the presence of heavy atoms such as metal containing systems. This is an interaction between the spin angular momentum and the orbital angular momentum of Sn
and Tn states and thus, singlet and triplet states are no longer "pure" as singlet or triplet.
The presence of a heavy atom in the system leads to decreasing the phosphorescence lifetime because of increasing the rate of the nonradiative process, decreasing the fluorescence lifetime and increasing of the phosphorescence quantum yield because the triplet state population has increased.
1.6.5. Phosphorescence
This process is a radiative process which includes relaxation of the molecule from the triplet state to the ground state. It exhibits longer lifetimes than fluorescence on time scale of 10-3 second for organic samples and (10-5-10-7 second) for metal containing samples. The
![Figure 3. UV-visible spectrum of [ZnTPP] showing the Soret band and Q-band.](https://thumb-eu.123doks.com/thumbv2/123doknet/5820573.140616/28.918.264.699.109.410/figure-visible-spectrum-zntpp-showing-soret-band-band.webp)
![Table 2. Relative atomic contributions of the various fragments in [Zn-Fb]. [a][b]](https://thumb-eu.123doks.com/thumbv2/123doknet/5820573.140616/97.918.139.824.824.1052/table-relative-atomic-contributions-various-fragments-zn-fb.webp)
![Table 5. Structural, spectral and photophysical data for the calculations of k ET of [Zn-Fb]](https://thumb-eu.123doks.com/thumbv2/123doknet/5820573.140616/106.918.146.820.145.709/table-structural-spectral-photophysical-data-calculations-et-zn.webp)
