HAL Id: hal-02734724
https://hal.inrae.fr/hal-02734724
Submitted on 2 Jun 2020HAL is a multi-disciplinary open access archive for the deposit and dissemination of sci-entific research documents, whether they are pub-lished or not. The documents may come from teaching and research institutions in France or abroad, or from public or private research centers.
L’archive ouverte pluridisciplinaire HAL, est destinée au dépôt et à la diffusion de documents scientifiques de niveau recherche, publiés ou non, émanant des établissements d’enseignement et de recherche français ou étrangers, des laboratoires publics ou privés.
Does crop insurance lead to better environmental
practices? Evidence from French farms
Geoffroy Enjolras, Magali Aubert
To cite this version:
Geoffroy Enjolras, Magali Aubert. Does crop insurance lead to better environmental practices? Evi-dence from French farms. 12. Journées de recherches en sciences sociales, Société Française d’Economie Rurale (SFER). FRA.; Centre de Coopération Internationale en Recherche Agronomique pour le Développement (CIRAD). FRA.; Institut National de la Recherche Agronomique (INRA). FRA.; Ecole Nationale Vétérinaire Agroalimentaire et de l’Alimentation Nantes Atlantique (ONIRIS). FRA.; Université de Nantes (UN). FRA., Dec 2018, Nantes, France. �hal-02734724�
Does crop insurance lead to better environmental practices?
Evidence from French farms
M. Aubert¹; G. Enjolras²
1: UMR 1: 1: 1: 0 MOISA, INRA-Montpellier Supagro, , France, 2: CERAG, Univ. Grenoble-Alpes, , France
Corresponding author email: geoffroy.enjolras@grenoble-iae.fr
Abstract:
The purpose of this paper is to examine how crop insurance influences pesticide use, the two decisions being strategic for risk management at the farm scale. Using data from the Farm Accountancy Data Network (FADN), we consider French farms which cultivate field crops and wine-growing, the two main sectors that participate the most to crop insurance and that use intensively pesticides. The paper implements propensity score matching, difference-in-differences models and a combination of these two methods in order to compare populations of insured and non-insured farmers. The analysis is performed between 2008 and 2012 given a strategic change in the crop insurance system in 2010 that strongly incites farmers to purchase crop insurance with private companies. At the same time, pesticide use was progressively discouraged through public policies. Estimations show that while pesticide use decreases for all crops, the purchase of crop insurance policies softens this reduction for field crops and fasten it for wine-growing. These results emphasize a possible substitutability between crop insurance and pesticides as risk management tools.
Acknowledegment: JEL Codes: Q14, C13
Does crop insurance lead to better environmental practices?
Evidence from French farms
Abstract
The purpose of this paper is to examine how crop insurance influences pesticide use, the two decisions being strategic for risk management at the farm scale. Using data from the Farm Accountancy Data Network (FADN), we consider French farms which cultivate field crops and wine-growing, the two main sectors that participate the most to crop insurance and that use intensively pesticides. The paper implements propensity score matching, difference-in-differences models and a combination of these two methods in order to compare populations of insured and non-insured farmers. The analysis is performed between 2008 and 2012 given a strategic change in the crop insurance system in 2010 that strongly incites farmers to purchase crop insurance with private companies. At the same time, pesticide use was progressively discouraged through public policies. Estimations show that while pesticide use decreases for all crops, the purchase of crop insurance policies softens this reduction for field crops and fasten it for wine-growing. These results emphasize a possible substitutability between crop insurance and pesticides as risk management tools.
1. Introduction
Crop insurance is a risk management tool aimed at protecting farm yields. Among the strategies used to manage farm risk, this instrument is one of the most widespread given that it compensates losses due to the action of unfavorable weather conditions. In practice, insurance provides claims if the yield falls below a threshold defined in the contract, thus providing significant revenue stabilization over the years (Bielza et al., 2009).
Successive reforms of crop insurance in France have led to an increase in the number and size of farms insured. 2 critical steps occurred: in 2005 when crop insurance was generalized to a wide set of crops and hazards and in 2010 when crop insurance was considered by the government as the principal instrument to manage crop yield risks (Enjolras and Sentis, 2011).
Among available risk management tools at their disposal, farmers also use chemical inputs for the protection of the growth of crops (Horowitz and Lichtenberg, 1994). Pesticides are mainly targeted to control intra-annual pest attacks. By preserving the production, they may also contribute to increase expected yields (Babcock and Hennessy, 1996). Despite the advantages they procure, pesticides generate major issues in terms of danger for farmers (Antle et al., 1998), consumers (Pan et al., 2010) and the environment (Craven and Hoy, 2005).
However, the reduction of pesticide use appears to be a complex issue given their key role for most farmers (Böcker and Finger, 2017). The challenge is major for France given this country is the leading European consumer of chemical inputs and the third largest consumer worldwide (Aubertot et al., 2005). Many differences exist among crops: while arable crops represent 48% of chemical inputs expenditure, they account for only one third of the land farmed (Baschet and Pingault, 2009). Winegrowing accounts for 14% of chemical inputs expenditure but represents only 4% of the land farmed. In 2008, the government decided to reduce consumption by 50% by 2018 within the implementation of EcoPhyto I framework (Butault et al., 2011). This ambitious objective was delayed to 2025 following the “EcoPhyto Report” and the Ecophyto II (2015) framework.
Within its strategic frameworks 2007-2013 and 2014-2020, the European Union has been developing support policies both for green agriculture (Westhoek et al., 2014) and risk management schemes (Bardají et al., 2016). Most of the support is concentrated in the 2nd Pillar which concerns rural development policy. Within this framework, farmers receive subsidies providing they comply with rules related to the environment and health. They also benefit from a subsidization of crop insurance policies in order to encourage them to protect their activity. One has to note that pesticides and insurance are not explicitly considered as potential substitutes within this framework.
Many ways to reduce pesticides have been studied in the literature (Finger et al., 2017). Among them, crop insurance and pesticides have been considered, conceptually speaking, as close substitutes given their effects on yields (Aubert and Enjolras, 2014a; Chakir and Hardelin, 2014; Feinerman et al., 1992; Horowitz and Lichtenberg, 1993; Smith and Goodwin, 1996). However, in practice, the modalities of use of both products are rather different and the balance seems to be in favor of pesticides. Crop insurance needs to be purchased before the season begins in order to avoid information asymmetries while pesticides can be used at any time. Moreover, the cost of insurance seems to be higher than the cost of pesticides despite incentives for promoting the former and reinforced constraints on use for the latter (Aubert and Enjolras, 2014b). The objective of this paper is to measure the extent to which crop insurance leads to more environmentally-friendly behaviors from farmers. As stated before, a large literature has tackled the link between crop insurance and pesticide use. However, to the best of our knowledge, only one study has tried to measure the long-term consequences of crop insurance purchase on pesticide use (Roberts et al., 2003).
In this paper, we propose to adopt a methodology which compares populations of insured and non-insured farmers. More specifically, we use difference-in-difference methods and propensity score matching because these methods allow to simulate a controlled experiment (Antonakis et al, 2010). They have been used in the literature to measure the effects of crop insurance on debt use (Ifft et al., 2015), on profit (Kuethe and Morehart, 2012; Zhao et al., 2016) and on farm value (Ifft et al., 2014).
We apply these methods to survey data collected from the Farm Accountancy Data Network (FADN). This annual database is representative of the production orientation at the national level of all commercial French farms. For the purpose of the analysis, we select only French farmers that had continuously belonged to the sample from 2008 to 2012. This balanced panel included 31,422 farms for each year, representing a total of 157,109 extrapolated observations over the 5-year period in question.
The paper is organized as follows. Section 2 provides the conceptual framework which considers the link between crop insurance and pesticide use. Section 3 introduces the empirical modeling, providing full details on the sample characteristics and the econometric models. Section 4 presents the results. Section 5 offers some concluding remarks.
2. Conceptual framework
The aim of this section is to develop a framework that addresses the link between crop insurance and pesticides. At first, we present the development of crop insurance in France as well as policies in favor of pesticide reduction.
2.1 The development of crop insurance policies in France
For decades, crop insurance policies have known a regular development in France. In 1964, a National Fund for the Management of Risks in Agriculture (Fonds National de Gestion des Risques en Agriculture, FNGRA) protected for the first time all French farmers against weather risks. Participation to this fund was mandatory and contributions were made by farmers and the government on an equal basis. Before its creation, a compensation was provided on a case-to-case basis.
Modern crop insurance was introduced in 1997 to protect fruit and vegetable yields against hail. At that time, participation was made on a voluntary basis and the government provided a small subsidy (7.5% of the premium). In 2002, the law extended coverage to storms. Moreover, field crops, fruits and wines began to be hedged against hail and frost.
In 2005, the hazards covered through crop insurance policies were extended for all crops to floods, excess of rain and other hazards. At the same time, the subsidy was increased to 35% for all crops but farmers still had the choice to participate to the FNGRA or purchasing private insurance policies. Because the subsidy compensated the increase in crop insurance premiums due to a better hedging, crop insurance became popular. 2 kinds of policies exist: (1) Crop by crop, all plots of a given insured crop have to be included in the policy; (2) At the farm level, the farmer insures more than two crops representing at least 80% of cultivated acreage.
In 2010, the FNGRA stopped hedging hazards that were already covered by private insurance policies. Its mission was therefore centered towards non-insurable hazards and calamities. Since then, French farmers who do not purchase crop insurance cannot receive any public support aimed at compensating losses from the most frequent weather-related hazards. The subsidization rate was increased to 65% (Figure 1).
Figure 1. Evolution of subsidization rates by production
Source: Own representation after data from the French Ministry of Agriculture
Note: These subsidization rates correspond to the standard rates. Before 2010, rates could be increased for young farmers and for some locations. Since 2015, rates are lowered for some guarantees.
Because this structural change did not strongly boost as expected the market for crop insurance, a baseline crop insurance policy (“contrat socle”) was set up in 2015. This policy has replaced until now previous ones. The farmer can choose up to three coverage levels: (1) A first level hedges only against production losses (fixed and variable expenses) at the crop scale, with a subsidy amounting to 65% of the premium. Insurance usually provides indemnity when losses reach a trigger of 30% and with a deductible of 20 to 30% according to the situation. (2) A second level hedges against yield losses at the farm or at the crop scale, by complementing the first level and with a subsidy of 45%. (3) A third level proposes additional guarantees, such as variations in prices and quality losses, without any subsidy.
Over the last years, France has benefitted from the support of the European Union, which finances 75% of crop insurance subsidies, while the national government subsidizes the remaining 25%. Funds come from the 2nd Pillar of the Common
Agricultural Policy, which allows for plurennial planning.
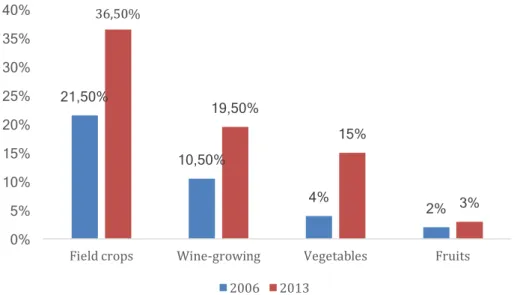
As shown by Figure 2, the evolution of insured acreage increased overtime. Field crops appear to be the most insured production, followed by wine-growing and vegetables. By contrast, fruits are not correctly insured, which translates in substantial losses for concerned farmers in case of unfavorable weather conditions. At the moment, the participation is stagnating, which questions the relevancy of the design current crop insurance policies, especially after the introduction of the “contrat socle” (Enjolras and Santeramo, 2016). 0% 10% 20% 30% 40% 50% 60% 70% Fruits & Vegetables Field crops & Wine-growing
Figure 2. Evolution of insured acreage by production between 2006 and 2013
Source: French Ministry of Agriculture
2.2 The literature on crop insurance: a growing body
The literature has extensively examined the issue of farmer participation in crop insurance schemes. In France, Enjolras and Sentis (2011) used data from the Farm Accountancy Data Network (FADN) for years 2003 to 2006. Chakir and Hardelin (2012) conducted a study at the national level on farms located in the department of Meuse between 1993 and 2004. Finger and Lehmann (2012) conducted a similar analysis on Swiss farmers while Santeramo et al. (2016) focused on Italian farmers. In general, in Europe, crop insurance is developing in all countries, with differences in the nature of the risks covered and the proposed contracts (Bardají et al., 2016). These studies mostly emphasize the key role of individual determinants (age and education) as well as structural farm parameters (size and diversification) in the decision to purchase insurance policies.
While the literature on crop insurance is growing, a limited number of studies have focused on the consequences of crop insurance purchase. O'Donoghue et al. (2005) and Yu et al. (2017) showed that crop insurance led to increased size for large farms and increased diversification for all farms. Cornaggia (2013) proved that crop insurance led to enhanced productivity. Deryugina and Konar (2017) showed that crop insurance increased water withdrawal. Ifft et al. (2015) showed that crop insurance is associated with an increase in short-term debt but not long-term debt, which denoted a risk-balancing behavior. Conversely, Uzea et al. (2014) showed that risk management tools did not increase debt use. Ifft et al. (2014) showed that farm value increased when fields are insured. Kuethe and Morehart (2012) proved that crop insurance improved farm-level profit in the United states while Zhao et al. (2016) did not demonstrate such effect
21,50% 10,50% 4% 2% 36,50% 19,50% 15% 3% 0% 5% 10% 15% 20% 25% 30% 35% 40%
Field crops Wine-growing Vegetables Fruits 2006 2013
in China. By contrast, only one study by Roberts et al. (2003) considered the influence of crop insurance on pesticide use with mixed results according to the crops considered.
2.3 The literature on pesticide use
Pesticide use is a decision which closely depends on the individual strategy of the producer as risk averse farmers are more willing to apply pesticides (Pannell, 1991). Pesticide applications can also be tactical after unfavorable weather conditions prone to crop diseases (Aubert and Enjolras, 2014a; Horowitz and Lichtenberg, 1993; Mishra et al., 2005).
Other key parameter influence pesticide use. Fernandez-Conejo and Ferraioli (1999) and Wu (1999) showed that educated and younger farmers apply less pesticides because they are more aware of their drawbacks. Aubert and Enjolras (2014a) also proved that productive farms and farms located in less-favored areas are more prone to pesticide use.
2.4 Crop insurance and pesticide use: a complex relationship
The literature has long noticed that pesticides share a same goal with crop insurance policies: protecting crop yields (Babcock and Blackmer, 1994; Hall and Norgaard, 1974). For that reason, it has also been noticed that pesticide use and crop insurance purchase may be endogenous, an assumption widely validated by the literature (Babcock and Hennessy, 1996; Chakir and Hardelin, 2010; Goodwin et al., 2004; Wu, 1999). However, as recalled by Aubert and Enjolras (2014a), the decision to take out insurance must be made before the beginning of the season in order to avoid moral hazard effects. By contrast, pesticide use is more flexible.
Nevertheless, the decision to take out crop insurance and to apply pesticides is the farmer’s personal choice. Insurance purchase requires the farmer to pay a premium in exchange for which the insurance company may provide a financial compensation in the event of the partial or total destruction of the harvest. Similarly, inputs involve an expense for the farmer. However, pesticide expenses are more flexible and generally cheaper than insurance expenses (Aubert and Enjolras, 2014b).
Given their fundamental characteristics, pesticides and crop insurance would appear to be substitutable products (Smith and Goodwin, 1996). Crop insurance is traditionally affected by information asymmetries (Just et al., 1999). Opportunistic behaviors and moral hazard have been observed: when insured, farmers may reduce their consumption of chemical inputs (Goodwin et al., 2004). Similarly, farmers demonstrating little risk aversion can consider pesticides and insurance as substitutes (Babcock and Hennessy, 1996). However, pesticide applications may also increase expected yield in favorable years. In this context, pesticides would paradoxically be an additional risk factor, thereby justifying a decision to purchase insurance (Horowitz and Lichtenberg, 1993).
Because both mechanisms provide a sort of certainty equivalent for farmer, the adoption of crop insurance may result in a progressive decrease of pesticides applications and expenses, at least for some crops (Robert et al., 2003).
3. Empirical modelling 3.1 Data
We use a survey of French farmers belonging to the Farm Accountancy Data Network (FADN). This survey is representative of all professional French farms, which reinforces the scope of our results. This sample offers a reliable way to access individual, structural and financial characteristics of professional farms, thereby providing useful information about their expenses. It is then possible to identify the strategies that farmers use to cope with risk (Phimister et al., 2004).
Because of the sampling methodology and more precisely because of the renewal rate, farms belonging to the FADN do not correspond to perennial farms. Within the original databases, we had to select only farms that had continuously belonged to the sample between 2008 and 2012. This period is important because 2008 is three years after the introduction of multi-peril crop insurance policies (in 2005) while 2012 is two years after the government decided not to hedge any more insurable risks (in 2010).
Because of their more intensive use of pesticides and more important participation to crop insurance, we concentrate our analysis to two main Economic and Technical Orientations (ETO): field crops and wine-growing. Our sample finally included 31,422 farms for each year, representing a total of 157,109 extrapolated farms over the 5-year period in question.
Farmers who purchased crop insurance in 2012 represent the treatment group (TG) while farmers not insured in 2012 constitute the control group (CG). There are 5,307 farmers in the TG (3,408 producing field crops and 1,899 wine-growers) and 28,115 farmers in the CG (9,652 producing field crops and 16,463 wine-growers).
Our dependent variable is related to the environmental practices of farmers, measured through pesticide use. Because of the evolution of the physical dimension of the farm between 2008 and 2012, considering the absolute value of pesticide expenses could lead to biased results. An increase in pesticide expenses could translate either the fact that a larger farm needs mechanically more pesticides or that a farm whose cultivated area remains stable increases its applications. Since the amount of pesticide expenses refers to several dimensions, we do not consider the quantity of pesticide but rather the intensity of pesticide use, by dividing the amount of expenses by the cultivated area.
Table 1. List and definition of variables
The list of considered variables is presented in Table 1. In addition to pesticides and crop insurance, we select variables related to the individual characteristics of the farmer (age, education) and the structural characteristics of the farm (gross production, location, specialization).
3.2 Methodology
The impact of insurance policies can be considered as a “treatment” on a group of farms. In order to assess the treatment effect, we have identified a control group, which allows controlling for confounding factors. Ideally, the treated and controlled groups should be randomly assigned to let the effect of treatment be independent from any individual or structural characteristics. Since some farmers decide to adopt crop insurance, we have to control for their characteristics in order to interpret the insurance effect independently from any observed characteristics. Hence, the underlying assumption is that, conditional on observable factors, the treatment and control groups differ only according to the effect of the treatment.
For this reason, three estimation strategies have been set up with the aim to ensure robustness of the results: propensity score matching (PSM), difference-in-differences (DID), and a combination of these techniques (PSM-DID). While trying to measure the effects of insurance on pesticide use, such strategies differ in the construction of the groups and in the measure of the effects (Zhao et al., 2016).
3.2.1 PSM estimates
The PSM has become popular since Rosenbaum and Rubin (1983) who developed a method to simulate a controlled experiment framework for non-randomly assigned groups. Such method allows to specify correctly the CG, by using propensity scores to group observations in accurate CG and TG. Then, the treatment effect on the outcome is perceived by comparing directly across observations in each identified group.
The propensity score is the conditional probability of being treated. In our case study, the treatment is the purchase of crop insurance.
𝑃 𝑋# = P 𝐼# = 1|𝑋# = 𝐸 𝐼#|𝑋# = 𝑋#𝛽 + 𝜀# (1)
Where: P(Xi) is the probability of receiving a treatment, X is the matrix of observable
farm and operator characteristics, b is the vector of estimated coefficients, I = 1 if the farmer is insured and 0 otherwise, i = 1,…,n denote farm observations, t is the time and e is the random error.
p(Xi) is generally estimated through logit models which include observed farmers
characteristics (Kott, 1998). Then, this value is used in turn to estimate the average effect of treatment using matching methods (Becker and Ichino, 2002). Each treated farmer is associated a close CG. The effect of the treatment is measured by comparing treated farmers to non-treated ones.
Variables X are selected from previous studies related to pesticide use. They include the operator’s age and general education, the gross production of the farm, its location in less-favored areas and its specialization (see Table 1). The aim is to consider all fixed characteristics that let two farmers being in a same category be comparable. Hence, the gross production is not considered in a quantitative way but in a qualitative one. The French Ministry of Agriculture defines three kinds of farms: the small (less than €25,000, not included in our sample), the medium (between €25,000 and €100,000) and the large ones (higher than €100,000)1.
The impact of crop insurance on pesticide use is then measured at the farm scale by the average treatment effect on the treated (ATT) which can be expressed as:
𝐴𝑇𝑇 = 𝐸 𝑌0− 𝑌2|𝑃 𝑋 , 𝐼 = 1 = 𝐸 𝑌0|𝑃 𝑋 , 𝐼 = 1 − 𝐸 𝑌2|𝑃 𝑋 , 𝐼 = 1 (2) Where: Y is the outcome variable.
3.2.2 DID and PSM-DID estimates
The difference-in-differences models basically measures the effect of a treatment by differentiating the average outcome for the TG before and after treatment relative to the difference in average outcome in the CG before and after treatment. Such model relies on the assumption that the TG and CG are identical in terms of observable factors. Since these two groups are comparable, the adoption of crop insurance is independent from any individual or structural characteristics. Consequently, the difference between the pre- and post-treatment for the CG accounts for any time-invariant unobservable factors that may confound the effect of treatment on the treated observations. The DID method can therefore identify the average effect of a treatment on the outcome. In our case study, farmers buying insurance are assimilated to the TG while the other farmers belong to the CG. The treatment can be identified with crop insurance purchase at two points in time.
The average treatment effect (ATE) measured using the DID can be expressed as: 𝐴𝑇𝐸 = 𝐸 𝑌|𝑋, 𝐼 = 1, 𝑇 = 1 − 𝐸 𝑌|𝑋, 𝐼 = 1, 𝑇 = 0 (3) − 𝐸 𝑌|𝑋, 𝐼 = 0, 𝑇 = 1 − 𝐸 𝑌|𝑋, 𝐼 = 0, 𝑇 = 0
Where: Y is the dependent variable (pesticide use), I = 1 if the farmer is insured and 0 otherwise, T = 1 in 2012 and 0 in 2008.
Under a linear specification, the dependent variable can be formulated in the following way:
𝑌#6 = 𝜏 + 𝛼𝐼#6 + 𝛾𝑇#6+ 𝛿𝐼#6𝑇#6 + 𝑋#6𝛽 + 𝜀#6 (4) Where: t is the time.
Coefficients estimated with equation (4) provide important measures of differences between TG and CG (Zhao et al., 2016):
- t is the average dependent variable for farmers in the CG in 2008. - b is the vector of estimated coefficients associated to variables X.
- a is the average difference of the dependent variable in 2008 cross the TG and CG. - g is the average change in the dependent variable over time.
- d is the ATE.
- (a+d) can be interpreted as the mean difference between the average dependent variable across TG and CG in 2012.
As shown by Heckman et al. (1998a, 1998b), DID and PSM models can be combined in order to cumulate the advantages and to reduce the drawbacks of the two methods. The PSM allows to select for the relevant CG for each treated observation. Then, the DID allows to eliminate unobservable and confounding time invariant factors that influence all groups together.
4. Results
4.1 Summary statistics
Summary statistics for the control group and the treatment group are provided for each variable and years 2008 and 2012 in Table 2.
Table 2. Descriptive statistics of variables across treatment and control groups before matching
Descriptive statistics underline that farmers present different characteristics among groups. More precisely, farmers specializing in wine-growing who have purchased crop insurance policies are older but have the same standard gross production than farmers who are not insured. The opposite is observed for farmers specializing in field crops: insured farmers are not older when they are insured but their gross production is higher. No difference is noticed among specializations and groups regarding the farmer’s education. Finally, insured wine-growers are more likely to located in less-favored areas than non-insured ones while the opposite is noticed for field crop producers.
Considering the intensity of pesticide use, we notice that, while there is not significant difference between the TC and the CG in 2008 and in 2012 for farms specializing in wine-growing, we observe a significant difference for farms specializing in field crops. For farms specializing in wine-growing, the non-significant effect may indicate that the intensity of pesticides is independent from crop insurance purchase. For farms specializing in field crops, this result may indicate a systematic difference between farmers according to their attitude towards crop insurance.
Consequently, standard DID estimators for field crops may be biased and the use of PSM with matching between treated and controlled groups can take into account this specificity. We also have to mention that even for the wine-growing sector, standard DID estimators can be biased because of the heterogeneity of each group. The equality of means may hide the potential heterogeneity of standard deviation and give a misleading impression that these two groups are immediately comparable.
Whatever the orientation considered, the use of PSM with matching lets appreciate the treatment effect on the basis of comparable groups having the same individual (age, level of education) and structural (less-favored area, standard gross production) characteristics.
4.2 PSM estimates
The first step of the PSM procedure consists in estimating each producer’s probability to be treated. The propensity to adopt insurance is therefore estimated in a discrete choice framework with a logit model as shown by equation (1). As recalled by Kuethe and Morehart (2012), the estimated coefficients are not the direct objective of the logit model provided that the model fairly predicts insurance purchase.
We then match treated observations to the control group based on the weighted logit propensity scores. Only farmers who have a correspondence among the control and treated groups on the basis of their individual and structural characteristics are considered. The impact of crop insurance on the intensity of pesticide use is measured through the average treatment effect on the treated (ATT), which is calculated according to equation (2).
Many techniques have been developed to perform the matching, Appendix 1 illustrates the matching using a radius method. The comparison between the figures on the left and on the right for each specialization confirm that the matching is effective, i.e. the observations are properly assigned to the CG and TG. Insured and non-insured farms are therefore comparable with respect to their individual and structural characteristics, so that the PSM with matching allows to measure efficiently the impact of crop insurance on the intensity of pesticide use.
Appendix 1. Distribution of propensity scores for the treated and control groups before and after matching with the radius method
Table 3 presents the results obtained using PSM. Contrary to the descriptive statistics presented on Table 2 that are based on the whole sample, we have here a reduced sample which includes only farms that present the same individual and structural characteristics between the treated and control groups. Hence, the effect measured corresponds only to the impact of crop insurance on the intensity of pesticide use.
Table 3. Treatment effects estimates using PSM
All parameters are similar for the ATT whatever the matching method used (nearest neighbor or radius), which indicates the robustness of our results. They indicate that insurance purchase leads to significantly higher pesticide expenses for field crop producers. By contrast, no effect can be reported for wine-growers.
4.3 DID and PSM-DID estimates
Results from the PSM can then be compared to those of the DID and PSM-DID models. The advantage of PSM-DID model is that it takes into account the fact that treated and control groups present some individual and structural specificities. We can then control for unobservable year effects common to both treatment and control groups. The set of estimates from DID and PSM-DID regression is reported in Table 4.
Whatever the farms specialization, we observe that there is a common trend which is the reduction of the intensity of pesticide use. Beside this trajectory, a main difference is observed between farms specializing in field crops and farms specializing in wine-growing.
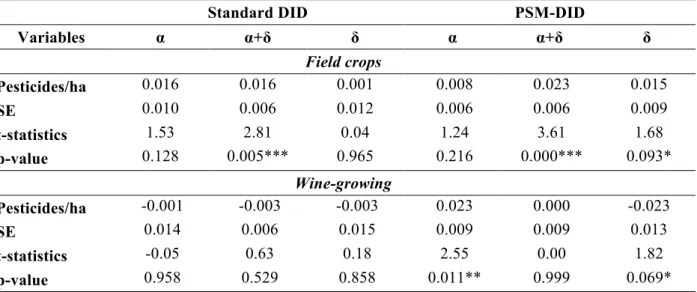
Table 4. Regression results from the DID and PSM-DID models
Farms specializing in field crops exhibit in 2008 the same intensity of pesticide used whatever they belong to treated group or to the control group (parameter a not significant). We have to notice that the reduction of pesticide expenses between 2008 and 2012 (see Table 2) is less important for the treated group (parameter a+d significant and positive). This result is valid both for the standard DID and the PSM-DID methods,
which confirms the robustness of the results. Given the properties of the estimators, such effects can be attributed to the purchase of crop insurance policies. Because in 2008 the intensity of pesticide use was the same for all farms specializing in field crops, the control group appears to be the most respectful of the environment in 2012.
The evolution observed for farms specializing in wine-growing is quite different according to the PSM-DID model. The first difference is observed in 2008 when the treated group makes a more intensive use of pesticide than the control group (parameter a significant). In 2012, we observe that there is no more difference between these two groups that both exhibit the same intensity of pesticide use (parameter a+d not significant). Because all wine-growing farms have reduced their pesticide expenses, the results underline that the treated group has much more reduced its expenses to reach in 2012 the same level than the control group.
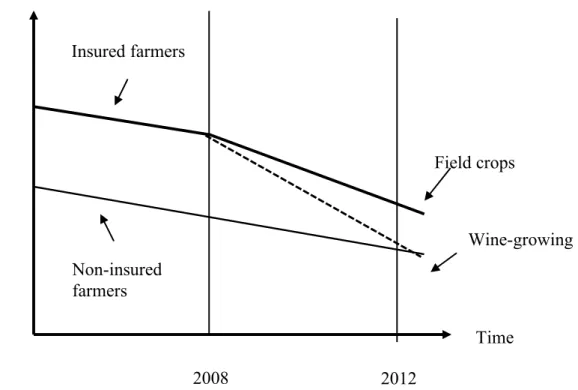
Figure 4 summarizes the main results.
Figure 4. Effect of crop insurance on pesticide use between 2008 and 2012
Time Pesticides/ha Insured farmers Non-insured farmers 2012 2008 Field crops Wine-growing
5. Conclusion
For more than a decade, French farmers have been incited to reduce their use of pesticides. In parallel, a modern crop insurance system subsidized by the government has been set up. Both the reduction of pesticide use and the participation to crop insurance are currently questioned for various reasons, especially regarding the changes in risk management practices they imply and their financial consequences. In this context, this study aimed at providing some knowledge about the influence of crop insurance purchase on pesticide use.
In order to measure this effect, the Farm Accountancy Data Network (FADN) was used. This database is representative off all professional French farms and allows to appreciate the individual, structural and financial dimensions of farms. Because the participation to crop insurance is the most important for farm specializing in field crops and wine-growing, our study focused on these two main orientations.
Since crop insurance purchase is not randomly assigned, measuring the impact of this insurance requires to control for the farmers’ individual and the farm structural characteristics that lead to such purchase. Different methodologies were adopted, including propensity score matching, difference-in-differences models and a combination of these two methods in order to compare populations of insured and non-insured farmers among them and over time. By controlling individual and structural factors, these methods allowed to stress specifically the role of crop insurance on pesticide use.
The results go hand in hand with the aim of the French government to incite farmers to reduce the use of pesticides and at the same time to purchase crop insurance, these two public policies being clearly distinct. While pesticide expenses are decreasing for field crop and wine-growing producers, insured field crop producers soften this trend while wine-growers amplify it. Such results seem to highlight two different strategies. On the one hand, insured field crop producers seek to maximize their yields, while on the other hand insured wine-growers implement more environmentally-friendly practices by substituting pesticides with insurance.
This study thus emphasized the consequences of crop insurance practices of farmers with respect to their individual profile and that of their farm. Results highlighted that crop insurance seemed to be more efficient in reducing pesticide use for wine-growing than for field crops. Given the observed substitutability of pesticides and insurance for wine-growing, it could be of interest for the French government to couple policies in favor of the development of crop insurance and policies in favor of a decrease of pesticide use. However, some caution would be necessary as the efforts made for the development of crop insurance might also lead to an increase of pesticide use for field crop producers.
Future research should complement this study by examining additional consequences of crop insurance purchase in order to provide in-depth knowledge on the benefits of these policies as well as on its possible drawbacks. Key variables of interest would include the farm net income and indebtedness. The information gained from these analyses would feed into the reflections on the future of the European Common Agricultural Policy regarding risk management.
6. References
Antle, J.M., Cole, D.C. and Crissman, C.C. (1998), “Further evidence on pesticides, productivity and farmer health: Potato Production in Ecuador”, Agricultural Economics, 18: 199-207.
Antonakis, J., Bendahan, S., Jacquart, P. and Lalive, R. (2010), « On making causal claims: A review and recommendations”, The Leadership Quarterly, 21(6): 1086-1120.
Aubert, M. and Enjolras, G. (2014a), “The determinants of chemical input use in agriculture: A dynamic analysis of the wine grape-growing sector in France”, Journal of Wine Economics, 9(1): 75-99.
Aubert, M. and Enjolras, G. (2014b), “Between the approved and the actual dose: A diagnosis of pesticide overdosing in French vineyards”, Review of Agricultural and Environmental Studies, 95(3): 327-350.
Aubertot, J.-N., Barbier, J.-M., Carpentier, A., Gril, J.-J., Guichard, L., Lucas, P., Savary, S., Savini, I. and Voltz, M. (2005), “Pesticides, agriculture et environnement, Réduire l’utilisation des pesticides et en limiter leurs impacts environnementaux“, Collective scientific assessment, INRA-Cemagref, 68 pp.
Babcock, B.A. and Blackmer, A.M. (1994). “The Ex Post Relationship between Growing Conditions and Optimal Fertilizer Levels”, Review of Agricultural Economics, 16: 353-362. Babcock, B.A. and Hennessy, D.A. (1996), “Input Demand under Yield and Revenue Insurance”, American Journal of Agricultural Economics, 78: 416-427.
Bardají, I., Garrido, A., Blanco, I., Felis, A., Sumpsi, J.-M., García-Azcárate, T., Enjolras, G., and Capitanio, F. (2016), "State of Play of Risk Management Tools Implemented by Member States During the Period 2014-2020: National and European Frameworks", European Parliament, 146 pp.
Baschet, J.-F. and Pingault, N. (2009), “Reducing pesticides use: the Ecophyto 2018 plan - The role of usage indicators in evaluating the achievement of targets”, French Ministry of Agriculture and Fisheries, Statistics and Prospective Service, 4/2009, 4 pp.
Becker, S.O. and Ichino, A. (2002), “Estimation of average treatment effects based on propensity scores”, The Stata Journal, 2(4): 358-377.
Bielza, M., Conte, C., Gallego, F.J., Stroblmair, J., Catenaro, R., and Dittman, C. (2009). Risk Management and Agricultural Insurance Schemes in Europe. JRC Reference Reports EUR 23843 EN, JRC 51982.
Böcker, T.G. and Finger, R. (2017), “A Meta-Analysis on the Elasticity of Demand for Pesticides”, Journal of Agricultural Economics, 68: 518-533.
Butault, J.P., Dedryver, C.A., Gary, C., Guichard, L., Jacquet, F. and Meynard, J.M. (2010), “Ecophyto R&D. Quelles voies pour réduire l’usage des pesticides ? In: Synthèse du rapport d’étude. France : INRA, 90 pp.
Chakir, R. and Hardelin, J. (2014), “Crop Insurance and pesticide use in French agriculture: an empirical analysis”, Revue d’Études en Agriculture et Environnement, 95(1): 25-50.
Cornaggia, J. (2013), “Does risk management matter? Evidence from the US agricultural industry”, Journal of Financial Economics, 109(2): 419-440.
Craven, C. and Hoy, S. (2005), “Pesticides persistence and bound residues in soil—regulatory significance”, Environmental Pollution, 133: 5-9.
Deryugina, T. and Konar, M. (2017), “Impacts of crop insurance on water withdrawals for irrigation”, Advances in Water Resources, 110: 437-444,
Enjolras, G. and Sentis, P. (2011), "Crop insurance policies and purchases in France", Agricultural Economics, 42(4): 475-486.
Enjolras, G. and Santeramo, F. (2016), "An innovation in risk management in the French agriculture: a baseline crop insurance”, Agriregionieuropa, 12(47), available online: https://agriregionieuropa.univpm.it/it/content/article/31/47/innovation-risk-management-french-agriculture-baseline-crop-insurance
Feinerman, E., Herriges, J.A. and Holtkamp, D. (1992), “Crop insurance as a mechanism for reducing pesticide usage: A representative farm analysis”, Applied Economic perspectives and policy, 14(2): 169-186.
Fernandez-Cornejo, J. and Ferraioli, J. (1999), “The environmental effects of adopting IPM techniques: The case of peach producers”, Journal of Agricultural and Applied Economics, 31(3): 551–564.
Finger, R. and Lehmann, N. (2012), "The Influence of Direct Payments On Farmers' Hail Insurance Decisions", Agricultural Economics, 43(3): 343-354.
Finger, R., Möhring, N., Dalhaus, T. and Böcker, T. (2017), “Revisiting pesticide taxation schemes”, Ecological Economics, 134: 263-266.
Goodwin, B.K., Vandeveer, M.L. and Deal, J.L. (2004), “An empirical analysis of acreage effects of participation in the federal crop insurance program”, American Journal of Agricultural Economics, 86(4): 1058–1077.
Ifft, J.E., Wu, S. and Kuethe, T. (2014), "The Impact of Pasture Insurance on Farmland Values”, Agricultural and Resource Economics Review, 43(3), 390-405.
Ifft, J.E., Kuethe, T. and Morehart, M. (2015), "Does federal crop insurance lead to higher farm debt use? Evidence from the Agricultural Resource Management Survey (ARMS)", Agricultural Finance Review, 75(3): 349-367.
Just, R.E., Calvin, L. and Quiggin, J. (1999), “Adverse selection in crop insurance: Actuarial and asymmetric information incentives”, American Journal of Agricultural Economics, 81: 834–849.
Hall, D.C. and Norgaard, R.B. (1974), “On the Timing and Application of Pesticides: Rejoinder”, American Journal of Agricultural Economics, 56(3): 644-645.
Heckman, J.J., Ichimura, H. and Todd, P. (1998a), “Matching as an Econometric Evaluation Estimator”, The Review of Economic Studies, 65(2): 261-294.
Heckman, J.J., Ichimura, H., Smith, J. and Todd, P. (1998b), “Characterizing Selection Bias Using Experimental Data”, Econometrica, 66(5): 1017-1098.
Horowitz, J.K. and Lichtenberg, E. (1993), “Insurance, moral hazard, and chemical use in agriculture”, American Journal of Agricultural Economics, 75(4): 926–935.
Horowitz, J.K. and Lichtenberg, E. (1994), “Risk-reducing and Risk-increasing Effects of Pesticides”, Journal of Agricultural Economics, 45(1): 82-89.
Kott, P.S. (1998), “Using the Delete-a-Group Jackknife Variance Estimator in NASS Surveys”, NASS Research Report 98-01.
Kuethe, T.H. and Morehart, M. (2012), "The profit impacts of risk management tool adoption", Agricultural Finance Review, 72(1):104-116.
Mishra, A.K., Nimon, R.W. and El-Osta, H.S. (2005), “Is moral hazard good for the environment? Revenue insurance and chemical input use”, Journal of Environmental Management, 74:11–20.
O'Donoghue, E.J., Key, N. and Roberts, M.J. (2005), “Does risk matter for farm business? The effects of crop insurance on production and diversification”, Paper prepared for presentation at the Annual Meeting of the AAEA, Providence, RI, July 24-37, 2005.
Pan, J., Plant, J.A., Voulvoulis, N., Oates, C.J. and Ihlenfeld, C. (2010), “Cadmium levels in Europe: Implications for human health”, Environmental Geochemistry and Health, 32(1): 1-12. Pannell, D.J. (1991), “Pests and pesticides, risk and risk aversion”, Agricultural Economics, 5:361–383.
Phimister, E., Roberts, D., and Gilbert, A. (2004), “The Dynamics of Farm Incomes: Panel data analysis using the Farm Accounts Survey”, Journal of Agricultural Economics, 55(2): 197-220. Roberts, M.J., O'Donoghue, E.J. and Key, N. (2003), “Chemical and Fertilizer Applications in Response to Crop Insurance: Evidence from Census Micro Data”, Paper prepared for presentation at the Annual Meeting of the AAEA, Montréal, Quebec, July 27-30, 2003.
Rosenbaum, P.R. and Rubin, D.B. (1983), “The Central Role of the Propensity Score in Observational Studies for Causal Effects”, Biometrika, 70(1): 41-55.
Santeramo, F.G., Adinolfi, F., Capitanio, F., and Goodwin, B.K. (2016), "Farmer Participation, Entry and Exit decisions in the Italian Crop Insurance Program", Journal of Agricultural Economics, 3(67): 639-657.
Smith, V.H. and Goodwin, B.K. (1996), “Crop insurance, moral hazard, and agricultural chemical use”, American Journal of Agricultural Economics, 78: 428– 438.
Uzea, N., Poon, K., Sparling, D. and Weersink, A. (2014), “Farm Support Payments and Risk Balancing: Implications for Financial Riskiness of Canadian Farms”, Canadian Journal of Agricultural Economics/Revue canadienne d'agroéconomie, 62: 595-618.
Westhoek, H., Van Zeijts, H., Witmer, M., Van den Berg, M., Overmars, K., Van der Esch, S. and Van der Bilt, W. (2014), “Greening the CAP. An analysis of the effects of the European Commission’s proposals for the Common Agricultural Policy 2014-2020, Netherlands Environmental Assessment Agency.
Yu, J., Smith, A. and Daniel, A.S. (2017), “Effects of Crop Insurance Premium Subsidies on Crop Acreage”, American Journal of Agricultural Economics, 100(1): 91-114.
Zhao, Y., Chai, Z., Delgado, M.S., and Preckel, P.V. (2016), “An empirical analysis of the effect of crop insurance on farmers’ income: Results from inner Mongolia in China”, China Agricultural Economic Review, 8(2): 299-313.
Table 1. List and definition of variables
Variable Unit Definition
Crop insurance Dummy Purchase of a crop insurance policy Pesticides €/ha Pesticides expenses of the farm
Age Years Age of the farm holder
Education Classes General education of the farm holder Gross production € Gross production of the farm
LFA Dummy Farm located in a Less-Favored Area
ETO Classes Economic and technical Orientation (field crops and wine-growing)
Table 2. Descriptive statistics of variables across treatment and control groups before matching
2008 2012
CG TG CG TG
Variables Mean SD Mean SD t-stat Mean SD Mean SD t-stat
Field crops Pesticides/ha 0.1120 0.0731 0.12854 0.0615 0.0689* 0.0803 0.0422 0.0977 0.0363 0.0412** Age 48.1910 9.4179 48.3254 7.8852 0.9076 52.8115 8.9616 51.4673 8.0348 0.7925 Gross prod. 124,842 85,139 159,374 113,708 0.0058*** 121,908 93,089 157,684 105,250 0.0025*** Wine-growing Pesticides/ha 10.3849 17.5484 14.8916 10.1366 0.0124** 9.3357 9.9480 11.7636 13.1196 0.1362 Age 48.3014 9.6485 44.9318 10.0125 0.0304** 51.6570 9.2945 49.0869 9.8270 0.0808** Gross prod. 237,361 177,264 260,489 235,098 0.4343 242,996 186,700 276,665 299,783 0.2910
Field crops Wine-growing
CG TG Total CG TG Total Less-Favored Area No 79.06% 91.30% 83.04% 81.56% 67.39% 79.90% Yes 20.94% 8.70% 16.96% 18.44% 32.61% 20.10% Pearson’s chi2 6.6121*** 5.0740*** General Education No 5.76% 6.52% 6.01% 4.03% 4.35% 4.07% Primary 15.18% 21.74% 17.31% 15.85% 13.04% 15.52% Secondary 53.93% 44.57% 50.88% 54.18% 50.00% 53.69%
Higher (short cycle) 22.51% 26.09% 23.67% 22.19% 32.61% 23.41%
Higher (long cycle) 2.62% 1.09% 2.12% 3.75% 0.00% 3.31%
Pearson’s chi2 3.6921 3.9546
Source: FADN 2012
Table 3. Treatment effects estimates using PSM
Matching method
Nearest neighbor Radius
ATT ATT Field crops Pesticides/ha 0.0187 0.0165 SE 0.0040 0.0038 t-statistics 4.68 4.35 p-value 0.000*** 0.000*** Wine-growing Pesticides/ha -0.0069 0.0003 SE 0.00465 0.0039 t-statistics -1.50 0.10 p-value 0.133 0.920 Source: FADN 2008-2012
Key: *, ** and *** respectively denote significance at the 10%, 5% and 1% levels respectively.
Table 4. Regression results from the DID and PSM-DID models
Standard DID PSM-DID
Variables α α+δ δ α α+δ δ Field crops Pesticides/ha 0.016 0.016 0.001 0.008 0.023 0.015 SE 0.010 0.006 0.012 0.006 0.006 0.009 t-statistics 1.53 2.81 0.04 1.24 3.61 1.68 p-value 0.128 0.005*** 0.965 0.216 0.000*** 0.093* Wine-growing Pesticides/ha -0.001 -0.003 -0.003 0.023 0.000 -0.023 SE 0.014 0.006 0.015 0.009 0.009 0.013 t-statistics -0.05 0.63 0.18 2.55 0.00 1.82 p-value 0.958 0.529 0.858 0.011** 0.999 0.069* Source: FADN 2008-2012
Appendix 1. Distribution of propensity scores for the treated and control groups before and after matching with the radius method
Field crops Wine-growing 0 5 10 15 20 kd e n si ty _ p sco re .05 .1 .15 .2 .25 propensity score treated control 0 5 10 15 20 kd e n si ty _ p sco re .05 .1 .15 .2 .25 propensity score treated control 0 1 2 3 4 kd e n si ty _ p sco re 0 .2 .4 .6 propensity score treated control 0 1 2 3 kd e n si ty _ p sco re 0 .2 .4 .6 propensity score treated control