HAL Id: hal-01458707
https://hal.archives-ouvertes.fr/hal-01458707
Submitted on 9 Feb 2021
HAL is a multi-disciplinary open access
archive for the deposit and dissemination of
sci-entific research documents, whether they are
pub-lished or not. The documents may come from
teaching and research institutions in France or
abroad, or from public or private research centers.
L’archive ouverte pluridisciplinaire HAL, est
destinée au dépôt et à la diffusion de documents
scientifiques de niveau recherche, publiés ou non,
émanant des établissements d’enseignement et de
recherche français ou étrangers, des laboratoires
publics ou privés.
atmospheric plasma
Fanny Girard, Vasilica Badets, Sylvie Blanc, Kristaq Gazeli, Laurent Marlin,
Laurent Authier, P. Svarnas, N. Sojic, Franck Clement, Stéphane Arbault
To cite this version:
Fanny Girard, Vasilica Badets, Sylvie Blanc, Kristaq Gazeli, Laurent Marlin, et al..
Forma-tion of reactive nitrogen species including peroxynitrite in physiological buffer exposed to cold
at-mospheric plasma.
RSC Advances, Royal Society of Chemistry, 2016, 6 (82), pp.78457-78467.
RSC Advances
ARTICLE
a.
UPPA, IPREM, CNRS UMR 5254, 2 avenue Président Angot, 64000 Pau, France.
b.
Univ. BORDEAUX, ISM, CNRS UMR 5255, NSysA group,ENSCBP, 16 avenue Pey Berland, 33607 Pessac, France
c.
Univ. PATRAS, High Voltage Laboratory, Electrical and Computer Engineering Departement, 26504 Rion-Patras, Greece
d.UPPA, Atelier de Physique, avenue de l’université, BP1155, 64013 Pau cedex,
France
† To whom correspondence should be addressed: Dr Franck CLEMENT, email:
[email protected], Tel.: +33 5 59 40 76 57; Dr Stéphane ARBAULT, email:
[email protected], Tel.: +33 5 40 00 89 39. Received 00th January 20xx,
Accepted 00th January 20xx DOI: 10.1039/x0xx00000x www.rsc.org/
Formation of Reactive Nitrogen Species including Peroxynitrite in
Physiological Buffer exposed to Cold Atmospheric Plasma
Fanny Girard,a,b Vasilica Badets,b Sylvie Blanc,a Kristaq Gazeli,a,c Laurent Marlin,d, Laurent Authier,a Panagiotis Svarnas,c Neso Sojic,b Franck Clémenta † and Stéphane Arbaultb †
Cold Atmospheric Plasmas (CAPs) or Non Thermal Plasmas (NTPs) are increasingly used for biomedical applications. Herein, we studied the interactions of such CAPs, typically atmospheric ionization waves produced in a helium-nitrogen mixture (He/1%N2) with a commonly used physiological liquid in biology, e.g. Phosphate Buffered Saline solution (PBS) at
pH 7.4. Optical Emission Spectroscopy (OES) of the plasma phase revealed the formation in the He/1%N2 CAP of nitric
oxide NO and hydroxyl OH° derivatives which can lead to numerous Reactive Oxygen and Nitrogen Species (RONS) after dissolution in the exposed PBS. Chemical changes in solution were first assessed by conductimetry and pHmetry; these experiments showed that an evaporation of the solution occurred under gas exposition and was amplified by the CAPs, being mostly related to the interaction between the ionization wave and the gas flow. Further, UV-visible absorption spectroscopy was used to identify and quantify long-lived RONS, namely nitrite (NO2-), nitrate (NO3-), as well as a
short-lived species, i.e. peroxynitrite anion (ONOO-). The production in physiological solution of ONOO- under a CAP exposure is
demonstrated for the first time, based on experiments at two pH (7.4 and 12) and on the analysis of decomposition kinetics of this unstable species. The combination of complementary physico-chemical techniques allows to decipher the complex reactivity of CAPs from the plasma phase to the liquid phase.
INTRODUCTION
Applications of plasma technologies in biology and medicine have increased rapidly over the last decade, due to the efficient generation of plasmas at atmospheric pressure and room temperature 1–4. Because of their complex composition (charged particles, photons in UV and visible spectral ranges, neutral species at at ground and excited states, electromagnetic fields…, see Figure 1), Cold Atmospheric Plasmas (CAPs) or Non-Thermal Plasmas (NTPs) have been successfully used for bacterial inactivation 5–8, dental applications 9,10, wound healing 11–13 and more recently, became promising in the field of cancer research 14–18. The strong attention drown by the « bioplasma » scientific field is motivated by the real need to find out novel therapeutic processes without side effects. The main issue is the
development of plasma sources compatible with life matter and operating at atmospheric pressure and in ambient air in order to make easier their use by healthcare professionals. Most of plasma sources used for biomedical applications are based on Dielectric Barrier Discharges (DBDs), generating the propagation of ionization waves at atmospheric pressure. Heterogeneous terminologies have been often given to these systems like plasma jets, plasma bullets, plasma plumes, plasma pencils, plasma guns, pulsed atmospheric-pressure plasma streams (PAPS), guided streamers, guided ionization waves... 3,19–30. These devices often operate with power supplies in pulsed mode with very short current impulses, leading to a mean gas temperature close to room temperature. This is mandatory for bio-related applications, even if short thermal injections may be produced during plasma pulses 24,31. One specific type of these plasma processes is thus applied in this work: it refers to the generation of ionization waves in a carrier gas composed of helium with admixture of nitrogen and propagating in air. In order to understand the reported biological effects of CAPs, a key step is to characterize the physical-chemistry of plasma-treated physiological liquids. As indicated above, CAPs are composed of numerous energy components, which act in synergy to produce physico-chemical reactions on the exposed samples.
Figure 1. Physico-chemical composition of CAPs.
It has been shown or often barely hypothesized, that several Reactive Oxygen Species (ROS, such as HO°, 1O2, H2O2) and
Reactive Nitrogen Species (RNS, such as NO°, ONOO- and NO2-)
are produced in physiological liquids (buffered media) during plasma treatment, while their reactivity on cells being increasingly studied 14,15,32–34. It is very likely that diverse Reactive Oxygen and Nitrogen Species (RONS) are produced inside the plasma, then dissolve and diffuse into the liquid phase 32,35. However, it is difficult to distinguish their production in the plasma phase from their presence in the liquid phase. Consequences are: first, highly reactive chemical species in plasma deriving from oxygen and nitrogen are transferred to the liquid, and second, some following chemical reactions can be initiated in the liquid creating more stable species. These later can induce prolonged biochemical and biological effects at longer time-scales, typically several hours, after the plasma treatment of the liquid 36. Among those effects was reported the so-called Plasma-Activated Water (PAW) 33,37–40 which was attributed, especially for RNS, to an acidification of the medium after plasma treatment, leading to a faster bacterial inactivation 34. Then, numerous chemical processes can occur within the plasma-treated physiological media and have to be well understood for the development of the associated technologies. This complex chemical reactivity is not only dependent on the involved plasma process, but also on the composition of exposed physiological liquids as reported by Tresp et al. 41.
Concerning plasma processes, the initial composition of the carrier gas is a major parameter determining the plasma-induced chemistry. It influences the composition of the plasma phase as well as the quantity of reactive species produced, and it might thus have a direct repercussion on the liquid chemistry. The interaction with the surrounding atmosphere is also an important parameter to take into account for a better understanding of the chemical and biological observed effects. Indeed, CAPs interact with gas molecules from the ambient air, e.g. mainly O2, N2 and also water vapour 41,42. As a
consequence, the plasma chemistry is not the same inside the reactor and in the air phase where plasma comes into contact with O2 and N2 molecules. It is thus necessary to take into
account the complex interplay of CAPs with their external environment in order to understand their physical chemistry. Because of this multi-parametric origin of CAP generation, exposed physiological liquids can vary significantly in chemical composition. The major challenge in the field is first, to reveal the nature of dissolved species, namely the RONS, and secondly to quantify them in order to interpret possible biochemical and biological effects. Some stable RONS have been identified in many CAP-exposed systems, including hydrogen peroxide (H2O2), nitrite (NO2-) and nitrate (NO3-).
However, the difficulty resides in the methodology used to detect and assess the nature of species, especially for species having a short lifetime (typically < 1 second). Generally, indirect and poorly selective methods are used. For instance, H2O2 is observed based on colorimetric assays such as Amplex
Red, titanium sulfate or simply thanks to commercial H2O2 test
strips 41,43, while NO2- and NO3- are detected using the very
common Griess reagent assay 44,45 or by ion chromatography
46
. Otherwise, hydroxyl radical (HO°) and nitric oxide (NO°) can be detected using electron paramagnetic resonance spectroscopy (EPR) but spin traps must be used to stabilize these short living species 47. Note that most of these techniques allow the detection of a single species at a time. Moreover they require the addition of chemical reagents in the liquid that can modify the initial sample composition. The selectivity of these methods has also to be taken into account since some scavengers can interact with several species. It is for example the case for the 2’,7’-dichlorodihydrofluorescein di-acetate (H2DCFDA) which reacts with peroxynitrite (ONOO-)
as well as with ROS 14,48.
This study aims at analysing the Reactive Nitrogen Species (RNS) composition of a physiological liquid medium (Phosphate Buffer Solution at pH 7.4, PBS), after exposure to CAPs initiated in helium with 1% nitrogen admixture. CAPs were produced by the formation of ionization waves in a nanosecond pulsed-mode and were directly applied on the liquid samples in an open-air environment, this condition mimicking directly some biological applications. The composition of the CAPs was first studied by UV-visible Optical Emission Spectroscopy (OES) in order to characterize the NOγ vibrational transitions, among others. Following, we combined multiple analyses of the exposed PBS including conductivity and pH measurements for a global analysis of the treated medium and UV-visible absorption spectroscopy for the detection and quantification of RONS. Firstly, we observed and quantified the production of stable species, namely NO2- and
NO3-. Then, we focused on the determination of short-lived
species potentially produced in the PBS. Some of these species have been hypothesized in the literature, including hypochlorite anion (ClO-) and peroxynitrite anion (ONOO-) 45,49, but never formally and experimentally characterized. We demonstrate herein by combining different experimental strategies the formation of peroxynitrite anion in CAPs exposed PBS.
Material and methods
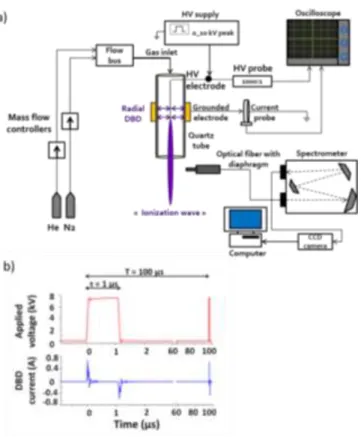
The experimental setup is presented in Figure 2-a.
Figure 2. a. Setup for CAP generation and its analysis by Optical Emission Spectroscopy (OES). b. Electrical signals involved for CAP generation. One period of the applied voltage and Dielectric Barrier Discharge (DBD) current are depicted. Parameters: amplitude of the pulsed applied voltage 7.5 kV, frequency of the pulsed applied voltage 10 kHz, duty cycle of the applied voltage 1 %.
The plasma reactor is made of a quartz capillary tube (inner and outer diameters are 1.2 and 3 mm, respectively) into which a thin tungsten electrode (filament of 0.125 mm diameter) is supplied by a High Voltage (HV) industrial nano-pulsed power supply. A cylindrical grounded electrode (tube with inner and outer diameters of 3 and 10 mm, respectively, 10 mm in length) is attached at the outer surface of the tube. The end of the filament is facing the outer end of the grounded tube, forming thus a DBD of about 10 mm long. The applied voltage is maintained constant with the following parameters: pulses of 7.5 kV in amplitude, 10 kHz of repetition frequency, 1 % of duty cycle (ratio of HV pulse width over the period). HV and current waveforms are followed by using specific voltage (Tektronix P6015A, bandwidth 75 MHz) and current (Pearson wideband current probe, 1 V.A-1) probes connected to an oscilloscope (Tektronix TDS3054B, 500 MHz-5 GS.s-1). Snapshot of typical electrical signals can be observed in Figure 2-b, which shows that two current impulses which last less than one hundred nanoseconds are obtained during the rising and falling parts of the voltage waveform, confirming the capacitive behaviour of the present reactor configuration
50
.
The carrier gas used for all the experiments was helium of high purity (Linde, 99.9995 %), while a small quantity of nitrogen N2
(Linde, 99.9995 %, 1 % in volume) was added, maintaining a total gas flow of 2 slm. Mixtures and gas flow were adjusted with mass flow controllers (EL-FLOW, Bronkhorst High-Tech) connected to a flowbus (Figure 2-a). According to this configuration, the CAPs produced are initiated in the quartz tube with a DBD spatially determined by the powered and grounded coaxial electrodes. The high electric fields formed at the sharp tip of the filament allow the formation of specific ionization waves, which are guided by the dielectric quartz tube and the channel formed from the penetration of the working gas in the atmospheric air.
The plasma emission from an axial zone of 5 mm in width and centred at 5 mm downstream the quartz tube orifice, was spatially-integrated with a diaphragm and probed by UV-visible (200-900 nm) Optical Emission Spectroscopy (OES), in order to identify emissive gaseous species produced during the ionization wave propagation in the air. The emitted light is focused on the grating of a high resolution spectrometer (1000M JOBIN YVON, 1200 grooves.mm-1, blazed at 500 nm) equipped with a CCD 3000V light detector. The light is collected with an optical fibre (Ceramoptec UV 1500/1590 N). For more information about the interpretation of relative OES intensities, see reference 51.
PLASMA TREATED PHYSIOLOGICAL SOLUTIONS, pH AND CONDUCTIVITY MEASUREMENTS
2 mL of PBS solutions (Phosphate Buffer Saline, PAN BIOTECH, KCl 0.003 mol.L-1 ; KH2PO4 0.002 mol.L-1; NaCl 0.137 mol.L-1 ;
Na2HPO4 0.01 mol.L-1, without Mg2+/Ca2+) were treated in a 6
wells plate (FALCON, sterile tissue culture plate), for various CAP exposure times (2 minutes 30 seconds, 5 minutes, 10 minutes). The distance between the end of the quartz tube and liquid surface was fixed at 15 mm.
Conductivity measurements were performed (Radiometer Analytical, CDM 210) at room temperature under magnetic agitation in samples within 1 hour after plasma exposure. pH measurements were carried out immediately after plasma exposure with a pH meter (Eutech instruments, pH 700 meter) under magnetic agitation too, and after transferring the sample into a haemolysis tube. All measurements were carried out in triplicate.
UV-VISIBLE ABSORPTION SPECTROSCOPY
UV-visible absorption spectroscopy was used to detect RNS in the PBS exposed to He/1%N2 CAPs 52. Spectra were recorded
(Cary 5000 spectrophotometer) at room temperature in steps of 0.5 nm in the [200-500 nm] range using either a 1 cm or 5 cm-path length quartz optical cell (Hellma). The cell length has been chosen in order to have a maximal absorbance of 1.5 of the analysed solution. Beer-Lambert law was used to calculate the concentrations of detected RONS (Eq. 1):
𝐴𝜆= ∑ 𝐴𝑖 𝜆,𝑖= ∑ 𝜀𝑖 𝜆,𝑖𝑙𝐶𝑖 (𝐸𝑞. 1)
𝐴𝜆 stands for the total absorbance of the solution at the
wavelength , 𝐴𝜆,𝑖 the individual absorbance of a species i at
absorbing species i (M-1.cm-1) at the wavelength , l the cell length (cm) and 𝐶𝑖 the concentration of the absorbing species i
(M). The molar extinction coefficient of the species in PBS were found in literature 53,54 or measured directly; for that, standard concentrations of nitrite and nitrate ions (NaNO2 2
mM and NaNO3 1 mM) were thus prepared in PBS pH 7.4, and
absorbance of these species was calculated using Beer-Lambert equation for each wavelength (Eq. 1).
RESULTS AND DISCUSSION
OPTICAL EMISSION SPECTROSCOPY OF CAPs
Using OES techniques, the different main emissions in the He/1%N2 CAP were characterized. The recorded spectrum
consists of various molecular and atomic nitrogen and/or oxygen species [NO, OH, N2 (SPS, Second Positive System),
N2+(FNS, First Negative System), N2 (FPS, First Positive System),
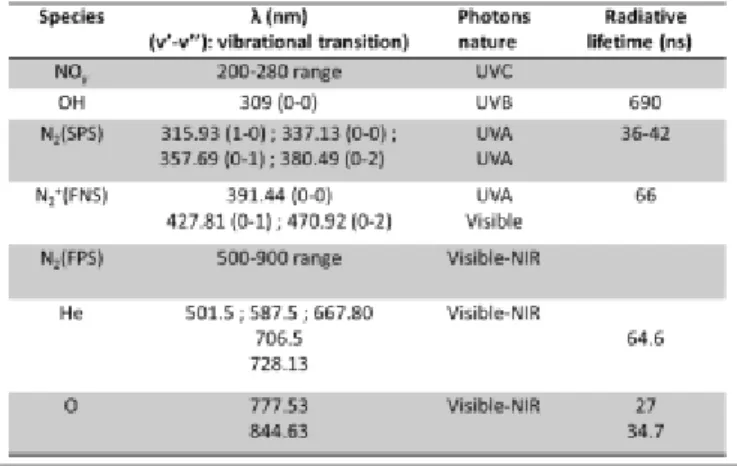
O, …] as well as excited Helium atoms (Figure 3-a). All these emissions are summarized in Table I in addition with their radiative lifetime reported elsewhere 51. As shown in Figure 3-b, it is remarkable that adding a low percentage of nitrogen in helium induces an important increase of emission from the NOγ system, suggesting an improvement of dissociation mechanisms of molecular nitrogen and oxygen. Nitric oxide derivatives thus produced in the CAP might lead to the formation in the liquid phase of RONS by reaction with O and OH derivatives.
Figure 3. a. Optical Emission spectrum from a CAP produced using a mixture of Helium with 1 % Nitrogen as carrier gas (total gas flow rate of 2 slm, 7.5 kV, 10 kHz, duty cycle 1 %, the optical fiber probes a zone of 5 mm on the plasma axis, centered at 5 mm downstream the tube orifice). b. Comparison of OES patterns of the NOγ vibrational transitions for the He and He/1%N2 CAPs.
Table 1. Main emissive species measured in the He/1%N2 CAP 51.
In these conditions, the rotational temperatures of the probe molecules, i.e. OH (A-X, v’=0–v’’=0 around 309 nm) and N2(SPS) (C-B, v’=0–v’’=0 around 337 nm), have been estimated
in order to obtain an approximation of the plasma gas temperature. According to reference 51 and Figure 4, the rotational temperatures are close to room temperature, 316 K and 314 K for OH and N2(SPS) molecules, respectively. It can be
noticed that, if ionization degrees are low (≈ 10-7-10-8) in these configurations (see Boeuf et al.,30), excitation degrees are also necessarily low, supporting the hypothesis that gas temperature is lower than the measured temperatures of the rotational molecular probes used. Elsewhere, vibrational temperatures of nitrogen molecules have been estimated to approximately 3000 K by using the Second Positive System of nitrogen emissions (N2(SPS)) 51. This relative high temperature
clearly indicates that produced CAPs are not in thermodynamic equilibrium, which is an indirect proof of the CAPs chemical reactivity.
Figure 4. Rotational temperatures of OH and N2(SPS) molecular probes measured in the He/1%N2CAP (total gas flow rate of 2 slm, 7.5 kV, 10 kHz, duty cycle 1 %) 51.
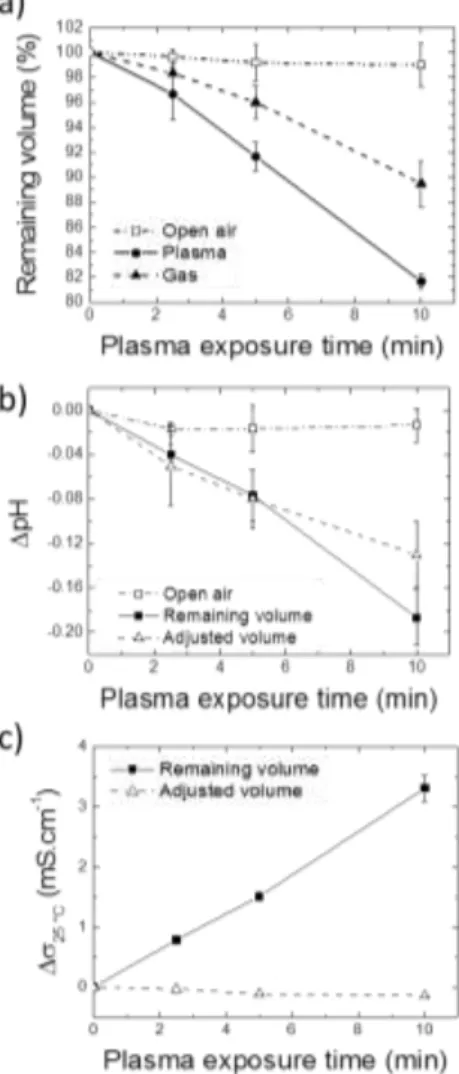
SOLUTION EVAPORATION INDUCED BY CAPS
We observed a loss of volume, in other words an evaporation process, for PBS solutions exposed to CAPs. Such observation has been reported previously 34,55 but obviously depends on each CAPs system. The evaporation cannot be related to a temperature increase during exposure since, based on rotational temperature analyses described above, the mean temperature within the CAP remains close to room temperature. Evaporation of the liquid may also be simply due to the gas flow, which is directly applied on the liquid sample surface. In order to quantify this effect, the remaining volume of PBS was measured immediately after He/1%N2 CAP
treatment, for different exposure times, in comparison with the gas exposure (He/1%N2) solely. The results are depicted in
Figure 5-a. The first observation is that the evaporation phenomenon is more important when the duration of CAP exposure increases, and it can be noticed that about 20 % of the volume is lost (400 µL over 2 mL) for 10 minutes of treatment. For 30 minutes CAP treatment, the loss of volume reaches 50 %. The second observation is the difference between controls and CAP-treated samples: the evaporation is increased under plasma influence than with the gas exposure solely.
Figure 5. Variations of volume (a), pH (b) and conductivity (c) in PBS solution (Vinitial = 2 mL; pH 7.4) after He/1%N2 CAP treatment for various exposure times.
CAP-treated solutions are compared to untreated ones, and to treated ones whom volume loss was compensated to keep a constant volume (Vfinal = 2 mL) before conductivity and pH analyses.
This fact should be attributed to the well-known coupling between the ionization waves and the hydrodynamic profile of the working gas 56–63. In these cited works, it is established that the plasma ignition highly modifies the working gas flow field in the atmospheric air. It is like if the interactions between the ionization wave and the gas flow could lead to the formation of an electro-hydrodynamic gaseous guide: a tubular sheath of lower section than the dielectric tube. As a consequence, an important increase in the gas velocity takes place. This higher velocity might induce higher evaporation. It is thus noticed that the control with sole gas, as it is usually performed for biomedical applications of CAPs, is not an appropriate control, since the flux dynamic is different after plasma ignition. It is certainly important to take into account this evaporation process for the following experiments, especially for the interpretation of conductivity and pH measurements.
CONDUCTIVITY AND PH CHANGES IN CAP-EXPOSED PBS
Two global parameters showing the possible evolution of the physical chemistry of CAP-exposed solutions were analysed: conductivity and pH. First, one may expect that the accumulation of charged species coming from the CAPs or the dissociation of plasma reactive molecules in the liquid phase could modify its overall conductivity. In other words, a conductivity increase is expected. This was previously reported in solutions of ultra-pure water treated by gliding arc electrical discharges 64 or in various liquid solutions including water and saline solutions 48. In our experimental conditions, an increase of the overall conductivity is observed (Figure 5-b), reaching
Δ𝜎25 °𝐶 = 3 mS.cm-1 for 10 minutes of He/1%N2 CAP exposure.
But knowing that there is an evaporation phenomenon, we wanted to evaluate the real contribution of the CAP treatment in the conductivity variation. The volume of solution has thus been adjusted (Vfinal = Vinitial = 2 mL) with ultra-pure water and
conductivity was measured again (dashed line in Figure 5-b). It did not change compare to the control (conductivity of non-treated PBS). It demonstrates firstly that the conductivity increase is only due to the evaporation phenomenon and secondly, that the concentration of species (RONS) accumulating in the PBS is not sufficiently high (see below for quantifications) to modify its conductivity. Furthermore, when considering biomedical applications of CAPs (for instance wound healing 11–13), one should take into account that the evaporation of a biological fluid and the ensuing conductivity change is not negligible and it will affect the local effects of CAPs.
Besides, pH measurements have also been realized on PBS solutions exposed to CAPs for different exposure times (Figure 5-c). Most of the reported studies show that there is an acidification of the liquid media after CAPs treatments 48. Although it is possible to observe a pH increase under certain conditions, i.e. with a DBD plasma reactor enclose in a N2
atmosphere 65, in our experimental conditions, He/1%N2 CAP
treatments induced a pH decrease of the buffered solution, until -0.18 pH units for 10 minutes exposure. Knowing that there is also an evaporation phenomenon, we checked that the acidification had no link with it. The volume has thus been adjusted with ultra-pure water (Vfinal = Vinitial = 2 mL) after
plasma exposures and pH was measured again (dashed line in Figure 5-c). The results show that there is a real acidification of the PBS following its exposure to He/1%N2 CAP. Because the
pH of a buffer is independent of the dilution, the evaporation phenomenon cannot explain this acidification. These experiments proved the accumulation of acid species in the liquid medium after plasma treatment, knowing that their concentration may be sufficiently high to overcome the buffer ability of PBS 10 mM at pH 7.4. According to Smith et al., 38 some acid RNS could be responsible of this pH decrease, such as nitrous acid (HNO2), nitric acid (HNO3), or peroxynitrous acid
(ONOOH). Based on our OES results described above, these species may be generated inside the plasma45 due to the NOγ reactivity, as well as due to atomic oxygen and hydroxyl radical. Eventually, the RONS species might end up in solution in chemically stable species including nitrite and nitrate anions, nitrosamines, and possibly to hydrogen peroxide.
MEASUREMENTS OF STABLE NITROGEN SPECIES PRODUCED IN PBS PH 7.4
UV absorption spectroscopy has been employed for the identification of the stable RNS dissolved in CAPs-exposed PBS solutions at physiological pH (7.4). Spectra were recorded between 250 and 400 nm only since first, the absorbance of PBS is dominant in the [200-250 nm] region and second, no species absorb in the [400-500 nm] region. Figure 6-a shows absorbance spectra of PBS solutions treated by He/1%N2 CAP
for 2 minutes 30 seconds, 5 minutes and 10 minutes. These graphs depict three main contributions corresponding to the absorbance of hydrogen peroxide (H2O2) around 260 nm,
nitrate (NO2-) around 300 nm and nitrite (NO2-) peaking at 354
nm 66. In addition, the absorbance bands increase in amplitude with the exposure time, suggesting an accumulation of these species in the solution. Then, we evaluated respective concentrations of nitrite and nitrate in the exposed solutions using Eq. 1. For this purpose, we first determined in our experimental conditions (PBS) the exact molar extinction coefficients of each species (NO3- and NO2-), which can differ
from data of the literature usually obtained from solutions of nitrite and nitrate in pure water. The corresponding molar extinction coefficient values are reported in Figure 6-b. It shows that NO2- has a large absorption maximum in the range
[340-400 nm], while the one of NO2- is detected in the
[260-340 nm] range and is lower in intensity than that of nitrite. It is noticed that the molar extinction coefficients measured herein are in good agreement with values reported for pure water 66, suggesting that there are no interactions between salts of the PBS and these species.
Based on these data, exact concentrations of nitrite (NO2-) and
nitrate (NO3-) were calculated and plotted as a function of CAP
exposure-time (Figure 6-c). In a general manner, concentrations are in the order of hundreds of micromolar; for example, 10 minutes of CAP-treatment lead to 590 ± 70 µM of NO2- and 460 ± 80 µM of NO3-. Moreover, concentrations
increase regularly with CAP exposure-time for both compounds. In comparison with other studies reported so far, the quantities and proportions of these species are depending on the plasma system features and the type of the treated liquid 45,65: in particular, Hensel et al., found less than 20 µM of NO2- in water treated 5 minutes by a helium “plasma jet” with
a frequency of 2 kHz (1.7 slm He, 9 kV, treated volume 2 mL)
43
; Machala et al., found higher NO3- concentrations, reaching
1 mM in a phosphate buffer (2 mM Na2HPO4/KH2PO4 in water)
exposed to electro-spraying through DC-driven positive transient spark discharge in air 48.
Figure 6. a. Characterization by UV absorption spectroscopy of stable RONS in PBS exposed to the He/1%N2 CAP for three different durations. b. Calculated molar extinction coefficients of NO2- and NO3- solutions in PBS pH 7.4. c. Nitrite and nitrate concentrations in CAP-exposed PBS calculated from curves in a. and b..
Firstly, it is worth noting that the buffer capacity is preserved regardless of the observed acidification. Indeed, the pH variation does not exceed one pH unit. The presence of NO2
-and NO3- can be directly correlated to pH results. Since we
observed a decrease of pH, NO2- accumulation could be
attributed to the prior existence of nitrous acid HNO2. HNO2 is
a weak acid (pKa([HNO2/NO2-]) = 3.3 53) reacting quantitatively
with the base of the buffer, HPO42- (K = 10+3.9) leading to
H2PO4- and NO2-. Similarly, the presence of nitrate in the PBS
treated by He/1%N2 plasma could be attributed to the prior
generation of nitric acid (HNO3), which is a strong acid leading
quantitatively to H2PO4- and NO3-. As mentioned above, these
two acid species could be generated in situ in the plasma 45 and subsequently react with the PBS causing a decrease of the ratio [H2PO4-]/[HPO42-]. Because the pH is equal to pKa([H2PO4
-]/[HPO42-]) + log([HPO42-]/[H2PO4-]), the production of HNO2
and HNO3 has the consequence to diminish the pH. Nitrite and
nitrate can also be formed by the reaction of nitric oxide radical NO° (originating from the NOγ system) with oxygen, or from the reaction of NO° with O2°-, which leads to the
formation of peroxynitrite (ONOO-/ONOOH). Peroxynitrous acid is an unstable acid (pKa = 6.8) at physiological pH 7.4 67–69 which converts mostly into stable NO3-; the exact involvement
of peroxynitrite will be discussed later.
Overall, these results demonstrate that millimolar concentrations (in total) of stable ionic nitrogen species are generated in PBS after He/1%N2 CAP treatments. Though
being substantially high, such concentrations of nitrite and nitrate should not modify the conductivity of the treated PBS, since its conductivity is determined by its high concentration of NaCl (about 140 mM). This shows that conductivity is not a reliable proof of the presence of plasma-induced charged species in the liquid, but rather it gives information about the evaporation process and its influence on the overall conductivity of the treated samples. In addition, the evaporation phenomenon could have a direct influence on the gas flow propagation inside the plasma 70, modifying dynamically its composition during the treatment. These complex and various physico-chemical phenomena have to be taken into account for a better understanding of the observed effects of CAPs in biomedical applications.
DETECTION OF AN UNSTABLE RNS: PEROXYNITRITE ANION
Nitrite and nitrate are poorly reactive species by themselves, though a new research field related to the Biology of nitrite has emerged recently, since this anion can react with haemoglobin and be converted to NO° 71. It is commonly considered that the biologically-efficient RNS are ONOO-, NO2°,
N2O3, which induce nitration and nitrosation of proteins
(tyrosine residues) and nucleic acids. Since these species form at last the stable nitrite and nitrate ions, they were hypothesized recently as intermediates generated in solutions by CAPs 33,43,66
. Peroxynitrite is of major interest since its half-lifetime at pH 7.4 is about 1 second 72, which allows its diffusion in solution and reactions with cells and biological
structures 71,73. For instance, peroxynitrite anion can react with proteins (transition metal centres, amino acids etc…), nucleic acids (DNA damaging) but it can also affect functions of organelles such as mitochondria 68,71. There is thus a real necessity to know if this species can be generated in CAPs systems. The formation of peroxynitrite was strongly suspected by Lukes et al., 33 in PAW at pH 3.3 thanks to a kinetic study of the post-discharge reaction between H2O2 and
NO2-. Besides, by using an usual but non selective fluorescent
probe for ONOO- (DCFH-DA), Machala et al., 48 indirectly estimated peroxynitrite concentrations of tens of µM produced by DC-driven transient spark discharges operating in atmospheric air.
We developed herein a protocol to measure directly the production of peroxynitrite in PBS during He/1%N2 CAP
exposures. Since the pKaof (ONOOH/ONOO-) couple is 6.8 68,74, ONOO- is the predominant form in alkaline solutions 72,75. Moreover, ONOO- has an absorption maximum at 302 nm with a high molar extinction coefficient of 1670 M-1.cm-1 at this wavelength 76. Thus, we prepared PBS solutions at pH 12 (PBS 7.4 alkalinized with NaOH). In comparison with above results at pH 7.4, solutions of PBS pH 12 were treated for 5 and 10 minutes by He/1%N2 CAP, keeping the same electrical and
fluidic parameters. Samples were analysed by UV-visible absorption spectroscopy (250-400 nm range). Spectra depict two main bands: one peaking at about 295 nm corresponding to the contribution of an unknown species and a second one at about 355 nm, fairly corresponding to nitrite (Figure 7-a). Both species rise in concentration with CAP-exposure time.
Figure 7. a. UV absorption spectra of PBS solutions (pH 12) treated by He/1%N2 CAPs at different exposure times (5 and 10 minutes). b. Comparison of spectra measured in alkaline water and PBS both at pH 12, treated 5 minutes by He/1%N2 CAP.
Regarding the band at 295 nm, it has been suggested by Wende et al., 45 that this contribution could be due to the formation of hypochlorite anion ClO-, which has an absorption maximum at 292 nm (ε292 nm = 350 M-1.cm-177) and which could
be formed simply from the reaction of the plasma with Cl- ions in the buffer. In order to check this hypothesis, a control was achieved with a solution that does not contain any chloride anions. Alkaline pure water at pH 12 was treated 5 minutes by He/1%N2 CAP (Figure 7-b) and provided a very similar
absorption spectrum to the one of PBS at pH 12. The same peak is observed around 295 nm, proving that this band cannot be due to hypochlorite anion since it cannot be formed in pure alkaline water (which is free from chloride anions), treated by the He/1%N2 CAP.
OES spectroscopy has shown that there is a large amount of NO molecules in He/1%N2 CAP compared to He CAP (Figure
3-b) and as mentioned above, it is very likely that superoxide anion radical O2°- is also produced in the plasma phase, as
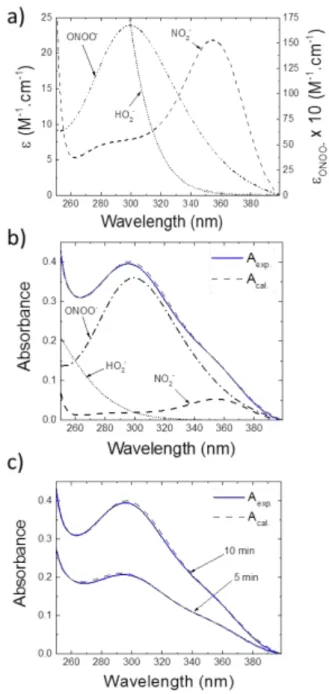
shown in previous studies 41,45,78. Consequently, if these two species are simultaneously present in CAPs or in the liquid phase, they will unambiguously react together to form peroxynitrite anion (reported reaction kinetics in solution range from 3.7 ± 1.1×10⁷ M-1.s-1 to 2×10¹⁰ M-1.s-168,71,74,79). In order to determine if ONOO- is really formed in our experimental conditions and is the unknown species observed in Figure 7-a, we calculated the concentration of each species that possibly absorbs in PBS pH 12 treated 10 minutes by He/1%N2 CAP i.e. ONOO-, NO2-, and HO2-. Indeed, at alkaline
pH, H2O2 is not the major species since it exists in equilibrium
with hydroperoxide anion HO2- (pKa of 11.6 80), which absorbs
at observed wavelengths. The molar extinction coefficients of these three species were then measured in PBS pH 12 and plotted (Figure 8-a). As only ONOO- and NO2- absorb between
350 and 400 nm (Figure 8-b), their concentrations in the PBS at pH 12 treated 5 or 10 minutes by the He/1%N2 CAP were
calculated by resolving a system of equations at two wavelengths (Eq. 2 and Eq. 3) using Eq. 1:
𝐴354 = ɛ354,𝑁𝑂2−𝑙 [𝑁𝑂2
−] + ɛ
354,𝑂𝑁𝑂𝑂−𝑙 [𝑂𝑁𝑂𝑂−] (𝐸𝑞. 2)
𝐴360 = ɛ360,𝑁𝑂2−𝑙 [𝑁𝑂2−] + ɛ360,𝑂𝑁𝑂𝑂−𝑙 [𝑂𝑁𝑂𝑂−] (𝐸𝑞. 3)
In the region [250-350 nm], calculated [𝑁𝑂2−] and [𝑂𝑁𝑂𝑂−]
concentrations were used further to estimate [HO2−] according
to Eq. 4 :
𝐴260 =
ɛ260,𝑁𝑂2−𝑙 [𝑁𝑂2−] + ɛ260,𝑂𝑁𝑂𝑂−𝑙 [𝑂𝑁𝑂𝑂−] + ɛ260,𝐻𝑂2−𝑙 [𝐻𝑂2−] (𝐸𝑞. 4)
Based on this approach, we were able to estimate maximal concentrations (Table 2) of nitrite, peroxynitrite and hydroperoxide anions present in solution. Let us note however, that these concentrations are probably slightly underestimated because of the experimental delay between solution preparations and absorbance measurements (at most 20 minutes).
Figure 8. a. Molar extinction coefficients of NO2-, HO2- (left y-axis) and ONOO (right y-axis) solutions in PBS at pH 12 at room temperature. b. Spectrum measured in PBS pH 12 treated 10 minutes by He/1%N2 CAP (Aexp., blue solid line). The hypothesized individual contributions of NO2-, HO2- and ONOO- were calculated using Beer-Lambert law and the resulting sum-up absorbance Acal. of these species (Acal., grey dash line) is ploted for comparison with the experimental one. c. Comparisons of spectra recorded in PBS pH 12 treated 5 and 10 minutes by He/1%N2 CAPs (Aexp.) with calculated ones.
Table 2. Calculated concentrations of NO2-, ONOO- and HO2- in the PBS pH 12 treated 5 and 10 minutes by the He/1%N2 CAP.
Following, it is possible to calculate the absorbance spectrum of each species in the full range of wavelengths studied, e.g. [250-400 nm]. Note that the high molar absorption coefficient of peroxynitrite (εONOO− = 1670 M-1.cm-1 at 302 nm) allows
the detection of weak concentrations of this species (for instance 20 µM for 5 minutes of CAP treatment) quite reliably. The total absorbance Acal. was obtained by summing-up the
individual absorbances previously calculated (grey dashed line in Figure 8-b and 8-c) and was compared to the experimental curve Aexp. (blue solid line in Figure 8-b and 8-c) for PBS at pH
12 treated 5 and 10 minutes by He/1%N2 CAP. The excellent
agreement between Acal. and Aexp. shows that peroxynitrite is
very likely to be the species giving an intense absorbance signal around 295 nm.
This conclusion was further validated by the kinetic and reactivity features of solutions exposed to the He/1%N2 CAP.
First, we used a very common assay for peroxynitrite in biomedical studies, which consists in detecting 3-nitrotyrosine adducts following the reaction of nitrogen dioxide NO2°,
formed during peroxynitrite decomposition, with L-tyrosine (see Supplementary Information section). The concomitant disappearance of the peroxynitrite absorption band and appearance of a band attributed to nitro-tyrosine, though being low in amplitude, are in excellent agreement with the known reactivity of peroxynitrite in the physiological pH domain.
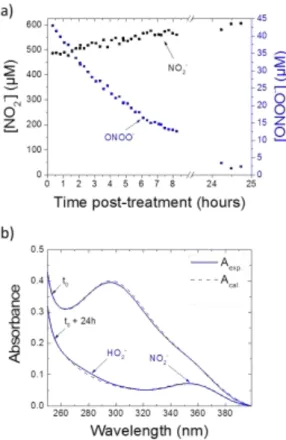
Figure 9. a. Kinetic evolution of NO2- and ONOO- concentrations in PBS pH 12 treated 10 minutes by He/1%N2 CAP. b. Resulting spectrum after 24 hours post-treatment.
Second, we observed from the measurements at pH 12 (Figure 8) that the absorbance at 295 nm slowly decreased with time while the one at 355 nm was maintained (See Figure 9-a for quantifications). After 24 hours post-treatment, the first one almost vanished and allowed us to identify the remaining species in the alkaline PBS: NO2- and HO2- (Figure
9-b). This kinetic evolution of the spectra may be explained by the relative instability of peroxynitrite in our experimental conditions. Generally, peroxynitrite acid and basic forms decompose in aqueous solutions to NO3- and NO2- in various
ratio as function of multiple factors: pH, temperature, concentration, chemical reaction with other species (CO2,
phosphates)…72,75,81,82. First, in order to verify if the solution decomposition could be accelerated by a pH-decrease, we measured the pH evolution of PBS over 24 hours post-treatment by CAPs. pH values remained stable, that is 11.88 ± 0.03 and 11.96 ± 0.01 for 10 and 5 minutes of treatment, respectively. It must be noticed that the PBS at pH 12 is still a phosphate buffer, since it exists an equilibrium between HPO42- and PO43- (pKa = 12.40), and provides a stable pH
.
Consequently, this shows that the ONOO- decomposition does not involve a pH-variation during the post-treatment time. Besides, it was previously clearly demonstrated that at pH higher than 10, the decomposition of ONOO- into NO2- prevails 73
. Accordingly, we did not measure significant quantities of NO3- at pH 12 in decomposed solutions. While the absorbance
band at 295 nm, related to peroxynitrite concentration, decreased until a value close to zero after 24 hours post-treatment, nitrite concentration increased by a few tens of micromolars, i.e. 20 %. This quantity is equivalent to the estimated concentration of peroxynitrite upon the deconvolution of spectra. All these observations validate the hypothesis of peroxynitrite formation and detection in solutions exposed to CAPs.
In addition, it appears that the concentrations of nitrite obtained in PBS at long term (hours timescale) at pH 12 (540 ± 100 µM) or rapidly (after few minutes) at pH 7.4 (590 ± 70 µM) following a 10 min-CAP treatment are much higher, about one decade, than the ones corresponding to peroxynitrite. This clearly demonstrates other mechanisms for NO3- and NO2-
generation in solution. According to pH decrease reported above, these two species are more likely originating mostly from NO acidic derivatives such as nitric and nitrous acids formed within the plasma phase. This result is in agreement with a recent study which shows that a majority of RONS measured in liquids are coming from plasma phase 83. Eventually, peroxynitrite is formed transitorily at pH 7.4, it lasts over a second time-scale compatible with its known biological effects, or decompose to nitrite and nitrate as we observed in our CAP-exposed physiological PBS solutions.
CONCLUSION
The physical chemistry of a physiological liquid medium (PBS) treated by He/1%N2 pulsed ionization waves at atmospheric
pressure was studied so as to decipher on the mechanisms of widely reported biological effects of CAPs. First, we observed a
significant evaporation of solutions under gas flow exposure and its amplification under CAP treatment. This phenomenon must be taken into account for biomedical applications since it modifies locally the concentration of ionic species, that is the whole conductivity and ionic strength of treated fluids. Two major stable nitrogen species were detected and quantified in CAP-treated PBS pH 7.4, namely nitrite and nitrate at concentrations in the range of hundreds of micromolar. Their formation was related to an acidification of the exposed PBS solutions, showing that they may originate from the NO species existing in the plasma phase, including nitric acid and nitrous acid species. We developed a strategy to demonstrate the transient formation of peroxynitrite in PBS, based on analyses in phosphate buffer at alkaline pH. Spectrophotometry studies showed that hypochlorite anion is not formed in both He/1%N2 CAP-exposed pure water and PBS
solutions. Contrarily, ONOO- was unambiguously detected in alkaline solutions, i.e. in conditions favoring its chemical stability and analysis. The presence of peroxynitrite in the liquid phase was correlated with the observation of its mother species, reactive nitric oxide and oxygen derivatives, in the He/1%N2 CAP. Finally, this work shows that short-living and
highly reactive chemical species can be effectively present in CAP-treated biological fluids and enlightens the necessity to develop novel physico-chemical approaches to better characterize them in situ.
ACKNOWLEDGMENTS
Particular thanks to M. Michel Mangin from the “Atelier de Physique” of UPPA for help in the development of plasma setups. This work was financially supported by the Centre National de la Recherche Scientifique (CNRS), the French Ministry of Research (MESR) and the Agence nationale de la Recherche (ANR, PLASMAREGEN project, n° ANR-14-CE16-0007-01).
REFERENCES
1 G. Fridman, G. Friedman, A. Gutsol, A. B. Shekhter, V. N. Vasilets and A. Fridman, Plasma Process. Polym., 2008, 5, 503–533. 2 K. D. Weltmann, E. Kindel, T. von Woedtke, M. Hähnel, M.
Stieber and R. Brandenburg, Pure Appl. Chem., 2010, 82, 1223– 1237.
3 T. von Woedtke, S. Reuter, K. Masur and K.-D. Weltmann, Phys.
Rep., 2013, 530, 291–320.
4 D. B. Graves, Phys. Plasmas, 2014, 21, 080901.
5 H. Jablonowski, M. A. C. Hänsch, M. Dünnbier, K. Wende, M. U. Hammer, K.-D. Weltmann, S. Reuter and T. von Woedtke,
Biointerphases, 2015, 10, 029506.
6 G. Fridman, A. D. Brooks, M. Balasubramanian, A. Fridman, A. Gutsol, V. N. Vasilets, H. Ayan and G. Friedman, Plasma Process.
Polym., 2007, 4, 370–375.
7 J. Guo, K. Huang and J. Wang, Food Control, 2015, 50, 482–490. 8 E. Dolezalova and P. Lukes, Bioelectrochemistry, 2015, 103, 7–14. 9 J. Pan, P. Sun, Y. Tian, H. Zhou, H. Wu, N. Bai, F. Liu, W. Zhu, J. Zhang, K. H. Becker and J. Fang, IEEE Trans. Plasma Sci., 2010,
38, 3143–3151.
10 M. Yoshinari, K. Matsuzaka and T. Inoue, Jpn. Dent. Sci. Rev., 2011, 47, 89–101.
11 J. Heinlin, G. Morfill, M. Landthaler, W. Stolz, G. Isbary, J. L. Zimmermann, T. Shimizu and S. Karrer, JDDG J. Dtsch. Dermatol.
Ges., 2010, 8, 968–976.
12 B. Haertel, T. von Woedtke, K.-D. Weltmann and U. Lindequist,
Biomol. Ther., 2014, 22, 477–490.
13 S. Arndt, P. Unger, E. Wacker, T. Shimizu, J. Heinlin, Y.-F. Li, H. M. Thomas, G. E. Morfill, J. L. Zimmermann, A.-K. Bosserhoff and S. Karrer, PLoS ONE, 2013, 8, e79325.
14 M. Vandamme, E. Robert, S. Lerondel, V. Sarron, D. Ries, S. Dozias, J. Sobilo, D. Gosset, C. Kieda, B. Legrain, J.-M. Pouvesle and A. L. Pape, Int. J. Cancer, 2012, 130, 2185–2194.
15 H. J. Ahn, K. I. Kim, N. N. Hoan, C. H. Kim, E. Moon, K. S. Choi, S. S. Yang and J.-S. Lee, PLoS ONE, 2014, 9, e86173.
16 F. Gesbert and L. Larue, Exp. Dermatol., 2014, 23, 716–717. 17 Y. Ma, C. S. Ha, S. W. Hwang, H. J. Lee, G. C. Kim, K.-W. Lee and K.
Song, PLoS ONE, 2014, 9, e91947.
18 F. Utsumi, H. Kajiyama, K. Nakamura, H. Tanaka, M. Hori and F. Kikkawa, SpringerPlus, 2014, 3, 1–9.
19 M. Laroussi, W. Hynes, T. Akan, X. Lu and C. Tendero, IEEE Trans.
Plasma Sci., 2008, 36, 1298–1299.
20 P. Svarnas, S. H. Matrali, K. Gazeli, S. Aleiferis, F. Clément and S. G. Antimisiaris, Appl. Phys. Lett., 2012, 101, 264103.
21 E. Robert, V. Sarron, D. Riès, S. Dozias, M. Vandamme and J.-M. Pouvesle, Plasma Sources Sci. Technol., 2012, 21, 034017. 22 M. Laroussi and X. Lu, Appl. Phys. Lett., 2005, 87, 113902. 23 M. Laroussi, C. Tendero, X. Lu, S. Alla and W. L. Hynes, Plasma
Process. Polym., 2006, 3, 470–473.
24 K. Gazeli, C. Noël, F. Clément, C. Daugé, P. Svarnas and T. Belmonte, Plasma Sources Sci. Technol., 2013, 22, 025020. 25 A. Schmidt-Bleker, S. A. Norberg, J. Winter, E. Johnsen, S. Reuter,
K. D. Weltmann and M. J. Kushner, Plasma Sources Sci. Technol., 2015, 24, 035022.
26 X. Lu, G. V. Naidis, M. Laroussi and K. Ostrikov, Phys. Rep., 2014,
540, 123–166.
27 M. Laroussi and T. Akan, Plasma Process. Polym., 2007, 4, 777– 788.
28 N. Mericam-Bourdet, M. Laroussi, A. Begum and E. Karakas, J.
Phys. D: Appl. Phys., 2009, 42, 055207.
29 E. Robert, E. Barbosa, S. Dozias, M. Vandamme, C. Cachoncinlle, R. Viladrosa and J. M. Pouvesle, Plasma Process. Polym., 2009, 6, 795–802.
30 J.-P. Boeuf, L. L. Yang and L. C. Pitchford, J. Phys. D: Appl. Phys., 2013, 46, 015201.
31 R. Tiede, J. Hirschberg, G. Daeschlein, T. von Woedtke, W. Vioel and S. Emmert, Contrib. Plasma Phys., 2014, 54, 118–130. 32 D. B. Graves, J. Phys. D: Appl. Phys., 2012, 45, 263001.
33 P. Lukes, E. Dolezalova, I. Sisrova and M. Clupek, Plasma Sources
Sci. Technol., 2014, 23, 015019.
34 S. Ikawa, K. Kitano and S. Hamaguchi, Plasma Process. Polym., 2010, 7, 33–42.
35 P. Rumbach, M. Witzke, R. M. Sankaran and D. B. Go, J. Am.
Chem. Soc., 2013, 135, 16264–16267.
36 M. Hoentsch, R. Bussiahn, H. Rebl, C. Bergemann, M. Eggert, M. Frank, T. von Woedtke and B. Nebe, PLoS ONE, 2014, 9, e104559.
37 Y. Tian, R. Ma, Q. Zhang, H. Feng, Y. Liang, J. Zhang and J. Fang,
Plasma Process. Polym., 2015, 5, 439-449.
38 A. Kojtari, U.K. Ercan, J. Smith, G. Friedman, R.B. Sensenig, S. Tyagi, S.G. Joshi, H.F. Ji and A.D. Brooks, J. Nanomedicine
39 G. Kamgang-Youbi, J.-M. Herry, T. Meylheuc, J.-L. Brisset, M.-N. Bellon-Fontaine, A. Doubla and M. Naïtali, Lett. Appl. Microbiol., 2009, 48, 13–18.
40 Q. Zhang, Y. Liang, H. Feng, R. Ma, Y. Tian, J. Zhang and J. Fang,
Appl. Phys. Lett., 2013, 102, 203701.
41 H. Tresp, M. U. Hammer, K.-D. Weltmann and S. Reuter, Plasma
Med., 2013, 3, 45-55.
42 T. Murakami, K. Niemi, T. Gans, D. O’Connell and W. G. Graham,
Plasma Sources Sci. Technol., 2013, 22, 015003.
43 K. Hensel, K. Kučerová, B. Tarabová, M. Janda, Z. Machala, K. Sano, C. T. Mihai, M. Ciorpac, L. D. Gorgan, R. Jijie, V. Pohoata and I. Topala, Biointerphases, 2015, 10, 029515.
44 T. Mosmann, J. Immunol. Methods, 1983, 65, 55–63.
45 K. Wende, P. Williams, J. Dalluge, W. V. Gaens, H. Aboubakr, J. Bischof, T. von Woedtke, S. M. Goyal, K.-D. Weltmann, A. Bogaerts, K. Masur and P. J. Bruggeman, Biointerphases, 2015,
10, 029518.
46 E. Dolezalova and P. Lukes, Bioelectrochemistry, 2015, 103, 7–14. 47 H. Tresp, M. U. Hammer, J. Winter, K.-D. Weltmann and S.
Reuter, J. Phys. D: Appl. Phys., 2013, 46, 435401.
48 Z. Machala, B. Tarabova, K. Hensel, E. Spetlikova, L. Sikurova and P. Lukes, Plasma Process. Polym., 2013, 10, 649–659.
49 H. Jablonowski and T. von Woedtke, Clin. Plasma Med., 2015, 3, 42–52.
50 C. Monge-Dauge, F. Clément, P. Svarnas, J.-F. Loiseau, A. Ricard and B. Held, IEEE Trans. Plasma Sci., 2012, 40, 2254–2260. 51 K. Gazeli, P. Svarnas, B. Held, L. Marlin and F. Clément, J. Appl.
Phys., 2015, 117, 093302.
52 L. Z. Jiao, D. M. Dong, W. G. Zheng, W. B. Wu, H. K. Feng, C. J. Shen and H. Yan, Asian J. Chem. 2013, 25, 2273-2277
53 E. Riordan, N. Minogue, D. Healy, P. O’Driscol and J. R. Sodeau, J.
Phys. Chem. A, 2005, 109, 779–786.
54 D. Vione, M. Minella, V. Maurino and C. Minero, Chem. - Eur. J., 2014, 20, 10590–10606.
55 L. Bundscherer, S. Nagel, S. Hasse, H. Tresp, K. Wende, R. Walther, S. Reuter, K.-D. Weltmann, K. Masur and U. Lindequist,
Open Chem., 2015, 13, 606-613.
56 P. K. Papadopoulos, P. Vafeas, P. Svarnas, K. Gazeli, P. M. Hatzikonstantinou, A. Gkelios and F. Clément, J. Phys. D: Appl.
Phys., 2014, 47, 425203.
57 J.-S. Oh, O. T. Olabanji, C. Hale, R. Mariani, K. Kontis and J. W. Bradley, J. Phys. D: Appl. Phys., 2011, 44, 155206.
58 N. Jiang, J. Yang, F. He and Z. Cao, J. Appl. Phys., 2011, 109, 093305.
59 R. Xiong, Q. Xiong, A. Y. Nikiforov, P. Vanraes and C. Leys, J. Appl.
Phys., 2012, 112, 033305.
60 M. Ghasemi, P. Olszewski, J. W. Bradley and J. L. Walsh, J. Phys.
D: Appl. Phys., 2013, 46, 052001.
61 X.-J. Shao, Z.-S. Chang, H.-B. Mu, W.-L. Liao and G.-J. Zhang, IEEE
Trans. Plasma Sci., 2013, 41, 899–906.
62 E. Robert, V. Sarron, T. Darny, D. Riès, S. Dozias, J. Fontane, L. Joly and J.-M. Pouvesle, Plasma Sources Sci. Technol., 2014, 23, 012003.
63 S. Iseni, A. Schmidt-Bleker, J. Winter, K.-D. Weltmann and S. Reuter, J. Phys. D: Appl. Phys., 2014, 47, 152001.
64 R. Burlica, M. J. Kirkpatrick and B. R. Locke, J. Electrost., 2006,
64, 35–43.
65 S. Maheux, D. Duday, T. Belmonte, C. Penny, H.-M. Cauchie, F. Clément and P. Choquet, RSC Adv, 2015, 5, 42135–42140. 66 J. Mack and R. J. Bolton, J. Photochem. Photobio. A Chem. 1999,
128, 1-13.
67 R. Kissner, T. Nauser, C. Kurz and W. Koppenol, IUBMB Life, 2004,
55, 567–572.
68 C. Szabó, H. Ischiropoulos and R. Radi, Nat. Rev. Drug Discov., 2007, 6, 662–680.
69 M. Kirsch, H.-G. Korth, A. Wensing, R. Sustmann and H. de Groot, Arch. Biochem. Biophys., 2003, 418, 133–150.
70 E. Robert, T. Darny, S. Dozias, S. Iseni and J.-M. Pouvesle, Phys.
Plasmas, 2015, 22, 122007.
71 P. Pacher, J. S. Beckman and L. Liaudet, Physiol. Rev., 2007, 87, 315–424.
72 S. Pfeiffer, A. C. Gorren, K. Schmidt, E. R. Werner, B. Hansert, D. S. Bohle and B. Mayer, J. Biol. Chem., 1997, 272, 3465–3470. 73 Y. Li, C. Sella, F. Lemaître, M. Guille-Collignon, L. Thouin and C.
Amatore, Electrochimica Acta, 2014, 144, 111–118.
74 W. H. Koppenol, J. J. Moreno, W. A. Pryor, H. Ischiropoulos and J. S. Beckman, Chem. Res. Toxicol., 1992, 5, 834–842.
75 C. Molina, R. Kissner and W. H. Koppenol, Dalton Trans., 2013,
42, 9898.
76 M. N. Hughes and H. G. Nicklin, J. Chem. Soc. Inorg. Phys. Theor., 1968, 450–452.
77 S. Carballal, M. Trujillo, E. Cuevasanta, S. Bartesaghi, M. N. Möller, L. K. Folkes, M. A. García-Bereguiaín, C. Gutiérrez-Merino, P. Wardman, A. Denicola, R. Radi and B. Alvarez, Free
Radic. Biol. Med., 2011, 50, 196–205.
78 D. X. Liu, Z. C. Liu, C. Chen, A. J. Yang, D. Li, M. Z. Rong, H. L. Chen and M. G. Kong, Sci. Rep., 2016, 6, 23737.
79 J. R. Lancaster, Chem. Res. Toxicol., 2006, 19, 1160–1174. 80 B. R. Locke and K.-Y. Shih, Plasma Sources Sci. Technol., 2011, 20,
034006.
81 R. M. Uppu, G. L. Squadrito and W. A. Pryor, Arch. Biochem.
Biophys., 1996, 327, 335–343.
82 R. Kissner and W. H.Koppenol, J. Am. Chem. Soc. 2002, 124, 234-239.
83 Y. Gorbanev, D. O’Connell and V. Chechik, Chem. - Eur. J., 2016,