HAL Id: hal-00092540
https://hal.archives-ouvertes.fr/hal-00092540
Submitted on 11 Sep 2006
HAL is a multi-disciplinary open access
archive for the deposit and dissemination of
sci-entific research documents, whether they are
pub-lished or not. The documents may come from
teaching and research institutions in France or
abroad, or from public or private research centers.
L’archive ouverte pluridisciplinaire HAL, est
destinée au dépôt et à la diffusion de documents
scientifiques de niveau recherche, publiés ou non,
émanant des établissements d’enseignement et de
recherche français ou étrangers, des laboratoires
publics ou privés.
Thierry Chateau, Vincent Gay-Bellile, Frédéric Chausse, Jean-Thierry
Lapresté
To cite this version:
Thierry Chateau, Vincent Gay-Bellile, Frédéric Chausse, Jean-Thierry Lapresté. Real-Time Tracking
with Classifiers. WDV 2006 - WDV Workshop on Dynamical Vision at ECCV2006, 2006, Grazz,
Austria. 14 p. �hal-00092540�
Thierry Chateau1, Vincent Gay-Belille1, Frederic Chausse1, and Jean-Thierry
Laprest´e1
Lasmea, UMR6602, CNRS, Blaise Pascal University, Clermont-Ferrand, France
{Surname.NAME}@lasmea.univ-bpclermont.fr
Abstract. Two basic facts motivate this paper: (1) particle filter based trackers have become increasingly powerful in recent years, and (2) object detectors using statistical learning algorithms often work at a near real-time rate.
We present the use of classifiers as likelihood observation function of a particle filter. The original resulting method is able to simultaneously recognize and track an object using only a statistical model learnt from a generic database.
Our main contribution is the definition of a likelihood function which is produced directly from the outputs of a classifier. This function is an estimation of calibrated probabilities P (class|data). Parameters of the function are estimated to minimize the negative log likelihood of the training data, which is a cross-entropy error function.
Since a generic statistical model is used, the tracking does not need any image based model learnt inline. Moreover, the tracking is robust to appearance variation because the statistical learning is trained with many poses, illumination conditions and instances of the object. We have implemented the method for two recent popular classifiers: (1) Support Vector Machines and (2) Adaboost. An experimental evalua-tion shows that the approach can be used for popular applicaevalua-tions like pedestrian or vehicle detection and tracking.
Finally, we demonstrate that an efficient implementation provides a real-time system on which only a fraction of CPU real-time is required to track at frame rate.
1
Introduction
We address the problem of real-time detection and tracking of an object using only a generic statistical model of the object. The idea is to bring together two popular fields of computer vision: statistical learning algorithms and particle filtering. Statistically based object detector using boosting [1] and support vector machine (SVM) [2] are now fast enough to run in real-time. Furthermore, particle filter based trackers [3, 4] provide successful solutions in following objects in clutter from a video. They have been used with edge-based [4], appearance [5] or kinematic [6] models, most of them, learnt for the specific object to be tracked. We propose to use a generic model of the class of the object, computed of-fline by a statistical learning algorithm from a database. The resulting approach
is able to detect and track any instance of the generic object model. A classi-cal particle filter is used to estimate the posterior probability density function (posterior) of the state of the object.
Object detection and tracking methods are used in many applications. Most popular ones are pedestrian tracking [7], vehicle tracking [8] or face tracking [9]. The problem is complex because each instance of the object class, for example my sister face, is different from other instances (other faces). Moreover, the appearance (image) of my sister face is not the same according to illumination and pose conditions. This example shows the real difficulty to have a generic model of an object.
Since object recognition methods working at a near real-time rate are recent, there is not many works related to visual tracking using statistical learning algorithms. The introduction of support vector tracking [8] by Avidan is the first paper which uses the output of an SVM object detector to perform a tracking task. The idea is to link the SVM scores with the motion of the pattern tracked between two images. This method provides a solution to track classes of objects. No model of the current object is learnt but the classifier uses a generic model learnt offline. Williams [10] proposes a probabilistic interpretation of SVM. He presents a solution based on RVM (relevante vector machine) [11], combined with a kalman filter to make a temporal tracking. RVM are used to link the image luminance measure to the relative motion of the object with a regression relation. However, this method supposes a learning step for the current object.
In [12], Okuma proposes an particle filter based approach which merges an Adaboost detector [1] and color model in order to build the posterior probability. The resulting system is able to recognize and track multiple players from a hockey game video sequence. this paper does not use directly the classifier as an observation function, as we propose here.
The paper is organized as follows. In section 2, we present the principle of the method and how to use outputs of classifiers as the observation likelihood function of a particle filter. Section 3 describes the image features extraction and the two steps algorithm used to train the classifier. Experimental results and real-time implementation are shown in section 4.
2
Principle of the Method
This section describes the object tracking method. We present a probabilistic formulation of visual tracking and a sequential Monte Carlo technique (particle filter) as a way to make it practical. Our main contribution is the definition of an observation likelihood function from the outputs of a classifier.
2.1 Probabilistic Visual Tracking
Visual tracking can be seen as the estimation, at time t, of the posterior
prob-ability function p(Xt|Z0:t) where Xtis the hidden state (position) of the object
of a conditionally independent observation process and a Markovian prior on the
hidden states, the sequence of filtering distributions p(Xt|Z0:t) to be tracked are
defined by the recursive equation: p(Xt+1|Z0:t+1) ∝ p(Zt+1|Xt+1)
Z
Xt
p(Xt+1|Xt)p(Xt|Z0:t)dXt (1)
Assuming that the distributions of probabilities are Gaussian, The Kalman filter provides an optimum analytical solution. However, visual tracking applications are highly non-linear and multi-modal problems. In this case, the posterior can be estimated by sequential Monte Carlo techniques [3].
2.2 Particle Filter
Particle filtering [13, 14] is a sequential importance sampling algorithm for es-timating properties of hidden variables given observations in a hidden Markov
model. Standard particle filter assumes that posterior P (Xt|Zt) can be
approx-imated by a set of samples (particles). Moreover it also assumes that the
obser-vation likelihood P (Zt|Xt) can be easily evaluated.
A particle filter approximates the posterior using a weighted particle set
{(Xn
t, πnt) : n = 1, .., N }. Figure 1 describes the algorithm used here, also called
Condensation[14] 1. initialize {(Xn 0, π n 0)} N
n=1from the prior distribution X0
2. for t > 0 (a) resample {(Xn t −1, π n t −1)} N n=1w into{(X ′n t −1, 1/N )} N n=1 (b) predict, generating Xn t ∼ p(Xt|Xt−1= X ′n t−1) to give {(X n t, 1/N )} N n=1 (c) weight, setting πn t ∝ p(Zt|Xt = X n t) to give {(X n t, π n t)} N n=1 normalized soPN n=1π n t = 1 (d) estimate ˆXt=. 1 N PN n−1X n t
Fig. 1.The particle filter algorithm (Condensation)
2.3 State Space and Dynamics
We want to track a region of interest (ROI) in the image plane It. The state
of this ROI is defined by it center c = (x, y) (expressed into the image plane.
reference) and a scale factor stbetween the ROI and the size of the images used
to train the classifier. The state Xtassociated to the object is then defined by:
Xt= (c. t, ct−1, st, st−1) (2)
For a state Xt, the corresponding ROI is extracted by:
where W is the 0-centered reference window with the same size then images used in the training step.
A first order auto-regressive dynamics is chosen on these parameters:
Xt+1= AXt+ Bvt, vt∼ N (0, Σ) (4)
Matrices A, B and Σ can be estimated from a set of sequences for which the position of the object is known.
2.4 Observation Likelihood
This section describes the tracker likelihood function P (Z|X) which is defined as the likelihood that the state of the object (position) is X according to an observed image Z. Many particle filter based trackers use a likelihood function linked to a distance between the model and the current particle to be weighted like π = exp(−λ.d(., .)). The parameter λ must be adjusted to provide good performances. The method described here does not use parameter of this kind.
Let us define a generic classifier m(f ) that returns an uncalibrated real value for the feature parameter f . This value can be a margin in the case of a SVM classifier or a score in the case of an Adaboost algorithm. We propose to build the likelihood function used to evaluate weights of the particle filter from m(f ). Since the likelihood function used by the particle filter is a probability: P (class|input) must be such a value computed from the classifier output.
The classifier m(f ) ∈] − ∞; +∞[ ranks examples well if : m(f1) < m(f2)
then P (class|f1) < P (class|f2). Generally, m(f ) ∈ [amin; amax] (where amin
and amax depend of the problem and the classifier), and we want to map the
scores into the [0; 1] interval by rescaling them. if mr(f ) is the re-scaled score, the
naive way is to produce it by: mr(f ) = (m(f ) − amin)/(amax− amin). However,
the estimate of P (class|f ) by mr(f ) does not provide well calibrated posterior
probability distribution (see [15] for details).
In [16], three calibration methods used to obtain calibrated probabilities from Boosting are compared:
– Logistic Correction: [17] a method based on Friedman et al.’s analysis of
boosting as an additive model,
– Isotonic Regression: [15] a method used by Zadrozny and Elkan to cali-brate predictions from Boosted naive Bayes, SVM, and decision tree models – Platt Scaling: [18] a method proposed by Platt to transform SVM outputs
to posterior probabilities
Since Platt scaling can also be used to estimate probabilities from Boosting [16], we use this method. In this section, we closely follow the description of Platt calibration method. if m(f ) is the output of the classifier, calibrated probabilities can be produced from the sigmoid:
P (positive|m(f )) = 1
where A and B are estimated using maximum likelihood estimation from a
calibration set (mi, yi) (mi = m(fi) and yi ∈ {0, 1} represent negative and
positive examples). A and B are computed by a non linear optimization of the negative log likelihood of the training data, which is a cross-entropy error function: argmin(A,B){− X i yilog(pi) + (1 − yi) log(1 − pi)}, (6) where pi= 1 1 + exp(A.mi+ B) (7) The easiest solution is to choose the same training set to fit the sigmoid then the training set used to train the classifier. However, Platt shows that it causes a biased estimate of the distribution of probability. A solution is to use a fraction of the training set (70% for example), to train the classifier, and to use the other fraction (30%) to estimate the parameters of the sigmoid. An other solution is to use a cross-validation method (see [18] for details).
Using Platt scaling, the likelihood function is defined by:
P (Z|X) = 1
1 + exp( ˆA.m(f ) + ˆB), (8)
with f the feature vector associated to the state X and ˆA, ˆB are the estimates
of A and B.
3
Learning Classification Functions
This section presents the features used to describe the image and the principle of the learning algorithm, based on two steps: (1) a feature selection step using an Adaboost algorithm and (2) a training step.
3.1 Features Extraction
A great number of object recognition methods (pedestrian, vehicles etc.) are using Haar wavelets, or cascades of simple filters[19], to encode the image [7, 20] in order to obtain a compact description of the object.
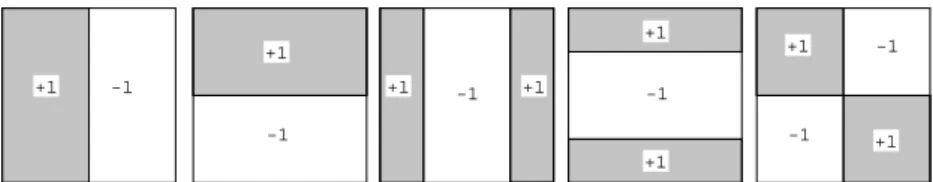
Descriptors used here are inspired from these previous works. Figure 2 presents
the five T × T = 2t× 2tfilters (F
1, ...F5. used here ). All of them are: (1) square
filters of 0 mean value, (2) they allow to detect symetries of the tarjet object, and (3) their computation can be greatly optimized by the pre-computation of an integral image [9]. The image is then described by a vector resulting of the response of the five filters at three different scales. For instance for an image of
27= 128 lines and 26= 64 columns, the filter size for scale i are 26−i× 26−i. The
resulting vector of features has total size (64 + 96 ∗ 32 + 112 ∗ 48) ∗ 5 = 42560. In the following we will denote by F(W), the function that returns the primitives vector for the window W.
-1 +1 +1 -1 +1 -1 +1 +1 +1 -1 +1 +1 -1 -1
Fig. 2.An image is described by a vector resulting of the response of 5 filters at various scales.
3.2 Features Selection and Training
The features vector F(W) has a high dimension. Since the method has to be real-time, the size of this vector is reduced using a features selection method inspired from Tieu et Viola works [19]. They use Adaboost to select the best primitives.
We will denote by F∗(W), the function that returns the vector of the selected
primitives on W.
Two recent classifiers have been trained using a positive and negative database:
– Adaboost [21] is a way to improve rates of success of a “weak” classifier (for
example a Bayesian rule), by training it on different learning subsets. Several decision rules are so obtained. The final one being computed by a majoritary concensus.
In order to classify an unknown example of given feature vector f = F∗(W),
it is sufficient to compare each selected component of f to the associated threshold, namely the score of the object will be computed by :
m(f ) = X
i=∈f
αi.hi(f ) (9)
where hi(f ) returns 1 if component i is in the object class, 0 otherwise.
– SVM (Support Vector Machine) detectors [22, 23] are based on the search
in parameter space of the separating hyperplane with maximal distance of the nearest learning elements, called support vectors. Moreover, to allow separation, data are imbedded in a higher dimension space by a non linear transform. The decision function is computed by:
m(f ) =
l
X
i=1
α0i.yi.K(fi, f ) + b (10)
where yiis 1 or -1 wheter the exemple is or is not an object of the class, and
K(., .) is a kernel functionnal.
Using the classifier, the likelihood P (Zt|Xt= Xnt) is computed by:
P (Zt|Xt= Xnt) =
1 1 + expn ˆA.m(F∗(cn
t + sntW)) + ˆB
4
Experiment
This section presents experiment done in order to illustrate the method pre-sented into the previous section, for two applications: (1) pedestrian detection and tracking, and (2) vehicles detection and tracking.
4.1 Learning
The learning database (part of the MIT database) is composed of 600 images for the pedestrian class (450 for the vehicle class) and of 900 images for the non-pedestrian class (900 for the non-vehicle class). Each image of pedestrian is 128 rows × 64 columns (w = 6, and h = 7) (64 rows × 64 columns for the vehicles). Features extraction is limited to the first three scale factors. A vector of 42560 (resp. 17455 for the vehicles) features is associated to each image.
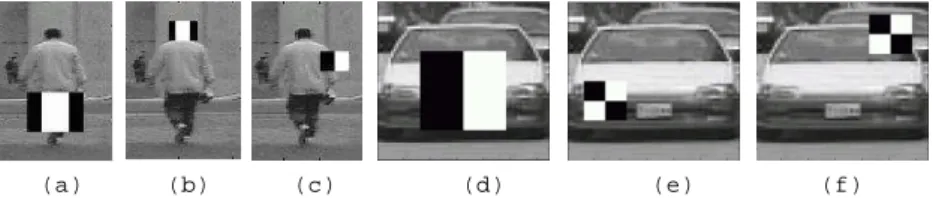
Feature Selection The size of the feature vector decreases to 40 after feature
selection. Figure 3 shows the features that best discriminate the two kinds of object. Some of them correspond to symetries (Fig.3.a) others to object structure (Fig.3.b for the head and Fig.3.e for the vehicle’s projector).
(a) (b) (c) (d) (e) (f)
Fig. 3.example of selected features for the pedestrian classifier ((a), (b) and (c))and for the vehicle classifier ((d), (e) et (f)). The filter is superimposed to the image. Black pixels represent the weight 1 and white pixels represent the weight -1.
Recognition The two tested detectors (SVM and Adaboost) have been trained
from the learning database. For pedestrian recognition, their performances have been evaluated from a test database constituted of 300 images of pedestrian and 450 images of non-pedestrian. In the case of the Adaboost and for a non detection rate fixed to 1%, table 1 shows the evolution of the good detection rate regarding the number of features retained : 40 seems to be a correct compromise between number of features and good recognition rate.
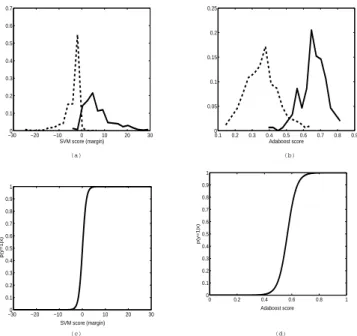
Calibrated Probabilities Outputs of the classifiers do not provide well
cal-ibrated posterior probabilities. Figures 4 (a) and (b) show the histograms for p(x|y = ±1), output of SVM (fig.4(a)) and output of Adaboost (fig.4(b)). One
Number of selected features 30 40 80 % of good detections 85 90 92
Table 1.performances of the Adaboost detector according to the number of selected features, for a constant false detection rate of 1%(for pedestrian recognition).
can notice that the probability density functions estimated by these histograms are not gaussian. Figures 4 (c) and (d) show calibrated probabilities computed from (a) and (b) with Platt scaling method presented section 2.4. The sigmoids will be used as the observation likelihood function into the particle filter.
−300 −20 −10 0 10 20 30 0.1 0.2 0.3 0.4 0.5 0.6 0.7 SVM score (margin) 0.1 0.2 0.3 0.4 0.5 0.6 0.7 0.8 0.9 0 0.05 0.1 0.15 0.2 0.25 Adaboost score −300 −20 −10 0 10 20 30 0.1 0.2 0.3 0.4 0.5 0.6 0.7 0.8 0.9 1 p(y=1|x) SVM score (margin) (a) (b) (c) (d) 0 0.2 0.4 0.6 0.8 1 0 0.1 0.2 0.3 0.4 0.5 0.6 0.7 0.8 0.9 1 p(y=1|x) Adaboost score
Fig. 4. Example of calibrated probabilities produced with Platt scaling method for SVM classifier and Adaboost classifier on the pedestrian data set. (a) and (b) are The histograms for p(x|y = ±1). The solid line is p(x|y = 1), while the dashed line is p(x|y = −1). (c) and (d) are the posterior probability distributions, defined by a sigmoid function fitting from a training set.
4.2 Tracking
Initialization Tracking initialization is not a simple problem. Most of the time,
it is supervised. The proposed method naturally automates this stage. Object localization on the first image is achieved scanning the translations and the scale
factor with the detector. Particles are then initialized using importance sampling algorithm from the N higher scores provided by the classifier.
Posterior as an Observation Model for Tracking The main idea of this
paper is to use posterior probabilities (calibrated probabilities) of a classifier as the observation model of a tracker. We made the assumption that the outputs of the classifier are linked to the position of the object to be tracked.
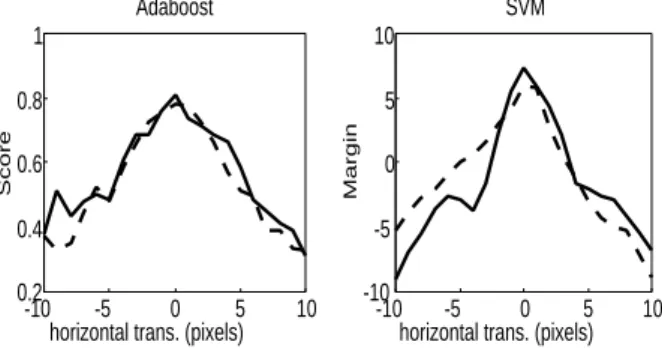
Scores provided by the detector have to be correlated with the notion of ob-ject proximity. To define that link, the evolution of these measurements regarding variations of the window of interest around the ideal position has been obtained. For a couple of pedestrian examples, figure 5 illustrates the relationship between the score of the classifier and an horizontal translation of the measurement win-dow of interest regarding the real one. We compare SVM and Adaboost. Both the detectors have a similar behavior: the measured score decreases continuously if the translation increases. Same conclusions can be noticed from horizontal an scale factor variation. We conclude that the output of a classifier can be used as an observation model. Moreover, Avidan [8] obtains similar results for SVM.
-10 -5 0 5 10 0.2 0.4 0.6 0.8 1 Adaboost
horizontal trans. (pixels)
Score -10 -5 0 5 10 -10 -5 0 5 10
horizontal trans. (pixels)
Margin
SVM
Fig. 5. Output of two classifiers (SVM and Adaboost) according to the horizontal translation, for two unseen pedestrians. A maximum is present at the true position.
Figure 6 compares the Adaboost and the SVM classifiers for pedestrian track-ing (200 particles were used). Time variations of horizontal position (Fig. 6.a) and vertical position (Fig. 6.b) are presented. Very similar results are obtained for both the methods. Concerning the scale factor, the same study have been conducted and the conclusions are identical. This example illustrates a large part of the tests realized for whose the two classifiers give equivalent results.
Since results are quite similar using SVM or Adaboost classifier, the fol-lowing experiment use only the Adaboost classifier. Experiment presented now underline the strengths and weaknesses of the method.
Pedestrian and Vehicle Tracking The aim of this section is to compare the
0 50 100 150 200 250 60 80 100 120 #image horizontal position SVM Adaboost 0 100 200 60 80 100 120 140 #image vertical position Adaboost SVM (a) (b) (c) Im#001 (d) Im#261
Fig. 6.horizontal (a) and vertical (b) position of the object estimated by the tracker for a pedestrian sequence. The SVM approach and the Adaboost approach give similar results. (c) and (d) are two images extracted from the video sequence.
not directly learned from the appearance of the object to be tracked but from a database of other objects of the same category. We compare this paper method with the the Camshift tracker [24, 25] (OpenCv implementation), considered as a reference appearance tracking algorithm. The observation model used in the
Camshift algorithm is based on color histograms of the object to be tracked.
Camshift
Our method
#410 #504 #515 #537 #597
Fig. 7. Example of pedestrian tracking (The video sequence comes from Caviar database. Upper images show results obtained for the tracker and lower images show results obtained for the Camshift Tracker
Figure 7 shows the result of the two methods for pedestrian tracking.
Se-quences provide from the Caviar Database1. The Camshift provides wrong
re-sults when the background color is near the pedestrian color (the observation model used for the Camshift is based on color histograms). Since the model learn for our method uses a wide range of cluttered backgrounds, the resulting tracker provides good performances against for cluttered backgrounds
Figure 8 illustrates results for a vehicle tracking sequence (sequence from PETS). Since the background is almost constant, results obtain by the two method are quite the sames.
1
Camshift
Our method
Fig. 8.Example of vehicle tracking (The video sequence comes from PETS database: Performance Evaluation of Tracking and Surveillance). Upper images show results ob-tained for the tracker and lower images show results obob-tained for the Camshift Tracker
Managing Occlusions The tested sequence presents a standing pedestrian
temporarily occluded by another one. Figure 9 shows the corresponding results. For each image, the PDF associated to the x coordinate (horizontal position) is constructed from the set of particles. When the tracked person is occluded by the other one, the PDF becomes bi-modal. . Then, when the dark clothed person walk away from the white clothed one, the PDF turns uni-modal (almost gaussian). Multi target tracking is naturally managed by the particles filter. In this example, the algorithm keeps on tracking the initial target since the output of detector in use (Adaboost) is greater for pedestrian facing the camera than for persons of profile. This problem is due to an unbalanced learning database. Another example is presented further for which the tracked target changes.
Managing Appearance Variations As shown on figure 10 the method is
ro-bust regarding to appearance changes due for example to lightning modifications (shadowed areas), or object’s pose modification (face, profile or back oriented pedestrian).
Weaknesses Figure 11 illustrates the main weakness of this method: since the
measurement function is based on a global learning of the object’s appearance, the tracker will give up with the initial target if another one yielding to a higher output of the detector passes near the initial one.
4.3 Real-Time Implementation
Simulation and the time development were done with Matlab , leading to far from real computation times.
The algorithms have been rapidly transfered to C++ , using an efficient matrix library developped in the laboratory and mimicking Matlab syntax.
-150 -100 -50 0 50 100 horizontal position p( Xt |Zt ) -150 -100 -50 0 50 100 p( Xt |Zt ) -150 -100 -50 0 50 100 p (X t |Zt ) -150 -100 -50 0 50 100 p (X t |Zt ) (a) (b) (c) (d) (e) (f) (g) (h) horizontal position
horizontal position horizontal position
Fig. 9.Example of an occlusion of an object by an other object of the same class. When the dark clothed pedestrian walks in front of the clear clothed pedestrian, the posterior probability function estimated from the particle filter function becomes bimodal ((b), (d), (f) and (h)). White frames represent particles.
ZOOM ZOOM
(a) t=0.3s (b) t=15s (c) t=20s (d) t=38s
Fig. 10.Tracking under strong appearance variations of the object. Here, both illumi-nation and object pose variations occur.
(a) (36.2s) (b) (37.0s) (c) (37.5s) (d) (38.5s)
Fig. 11.Weaknesses of the method. The tracker fails and changes of target during the sequence because the new target has a higher classifier score then the initial one. (The video sequence comes from PETS database: Performance Evaluation of Tracking and Surveillance).
On a pentium IV 2Gz, the tracking is done at 16ms using 200 particles and VGA images.
The crucial implementation part is the computation of the Haar masks on the spots given by the particle filter. This can be achivied with great efficacity using an integral image containing the accumulated sums of some interest part
of the current image along rows and columns. Once this image computed, each mask evaluation turn in a linear combination of at most eight interpolated value in the integral image.
5
Conclusion
In this paper, we have shown how recent classifiers can be used as obvervation model into a particle filter. The resulting application is a generic Real-Time object detection and tracking method, robust to occlusion and both illumination and pose variations. This observation model is produced by a learning step and do not need any manual parameter. A statistical learning algorithm is used to produce a generic model of the object to be tracked. When an unseen object appears in the image, it is detected and tracked. The system have been tested for pedestrian tracking.
The Real-Time implementation of this method leaves time to perform other tasks within the tracking as each image can be treated at less than half video rate on a three years old laptop.
References
1. P. Viola, M. Jones: Robust Real-time Object Detection. In: Second International Workshop on statistical and computational theories of vision-modeling, learning, computing, and sampling. (2001)
2. Romdhani, S., Torr, P., Sch¨olkopf, B., Blake, A.: Computationally efficient face detection. In: Int. Conf. of Computer Vision. Volume 2., Vancouver, Canada (2001) 524–531
3. Doucet, A., Godsill, S., Andrieu, C.: On sequential monte carlo sampling methods for bayesian filtering. Statistics and Computing 10 (2000) 197–208
4. Isard, M., Blake, A.: Contour tracking by stochastic propagation of conditional density. In: ECCV, European Conference on Computer Vision, Heidelberg, New York (1996) 343–356
5. P. Perez, C. Hue, J. Vermaak, M. Gangnet: Color-Based Probabilistic Tracking. In: Computer Vision ECCV 2002. Volume 1. (2002) 661–675
6. Deutscher, J., Blake, A., Reid, I.: Articulated body motion capture by annealed particle filtering. In: Computer Vision and Pattern Recognition. Volume 2. (2000) 126–133
7. C. Papageorgiou, M. Oren, T. Poggio: A general framework for object detection. In: IEEE Conference on Computer Vision. (1998) 555–562
8. Avidan, S.: Support vector tracking. In: International Conference on Computer Vision and Pattern Recognition, Hawaii (2001)
9. Viola, P., Jones, M.: Robust real time face detection. International Journal of Computer Vision 57 (2004) 137–154
10. Williams, O., Blake, A., Cipolla, R.: A sparse probabilistic learning algorithm for real-time tracking. In: Int. Conf. Computer Vision, Nice, France (2003) 353–361 11. Tipping, M.: The relevance vector machine. In: Advances in Neural Information
12. Okuma, K., Taleghani, A., de Freitas, N., Little, J., Lowe, D.G.: A boosted par-ticle filter: Multitarget detection and tracking. In: IEEE, ECCV, 8th European Conference on Computer Vision. Volume 1., Prague, Czech Republic (2004) 28–39 13. Arulampalam, S., Maskell, S., Gordon, N., Clapp, T.: A tutorial on particle filters for on-line non-linear/non-gaussian bayesian tracking. IEEE Transactions on Signal Processing 50 (2002) 174–188
14. M. Isard, A. Blake: Condensation – conditional density propagation for visual tracking. IJCV : International Journal of Computer Vision 29 (1998) 5–28 15. Zadrozny, B., Elkan, C.: Obtaining calibrated probability estimates from decision
trees and naive Bayesian classifiers. In: Proc. 18th International Conf. on Machine Learning, Morgan Kaufmann, San Francisco, CA (2001) 609–616
16. Niculescu-Mizil, A., Caruana, R.: Obtaining calibrated probabilities from boosting. In: Proc. 21st Conference on Uncertainty in Artificial Intelligence (UAI ’05), AUAI Press (2005)
17. Friedman, J., Hastie, T., Tibshirani, R.: Additive logistic regression: a statistical view of boosting. Tge Annas of Statistics 38 (2000)
18. Platt, J.: Probabilistic outputs for support vector machines and comparisons to regularized likelihood methods. In: Advances in Large Margin Classifiers. MIT Press (1999)
19. Tieu, K., Viola, P.: Boosting image retrieval. International Journal of Computer Vision 56 (2004) 17–36
20. Viola, P., Jones, M.J., Snow, D.: Detecting pedestrians using patterns of motion and appearance. In: Int. Conf. Computer Vision, Nice, France (2003) 734–741 21. Freund, Y., Schapire, R.: A decision-theoretic generalization of online learning and
an application to boosting. Journal of Computer and Systems Sciences 55 (1997) 119–139
22. Vapnik, V.N.: Statistical Learning Theory. John Wiley and Sons, New York, USA (1998)
23. Cristianini, N., Shawe-Taylor, J.: An introduction to Support Vector Machines and other kernel-based learning methods. Cambridge University Press (2000) 24. D. Comaniciu, V. Ramesh, P. Meer: Real-time tracking of non-rigid objects using
mean shift. Conference on Computer Vision and Pattern Recognition 2 (2000) 142–149
25. Bradski, G.R.: Computer video face tracking for use in a perceptual user interface. Technical report, Intel Technology Journal, Q2 (1998)