Publisher’s version / Version de l'éditeur:
Journal of Chromatography A, 1400, pp. 124-130, 2015-06-26
READ THESE TERMS AND CONDITIONS CAREFULLY BEFORE USING THIS WEBSITE. https://nrc-publications.canada.ca/eng/copyright
Vous avez des questions? Nous pouvons vous aider. Pour communiquer directement avec un auteur, consultez la première page de la revue dans laquelle son article a été publié afin de trouver ses coordonnées. Si vous n’arrivez pas à les repérer, communiquez avec nous à PublicationsArchive-ArchivesPublications@nrc-cnrc.gc.ca.
Questions? Contact the NRC Publications Archive team at
PublicationsArchive-ArchivesPublications@nrc-cnrc.gc.ca. If you wish to email the authors directly, please see the first page of the publication for their contact information.
This publication could be one of several versions: author’s original, accepted manuscript or the publisher’s version. / La version de cette publication peut être l’une des suivantes : la version prépublication de l’auteur, la version acceptée du manuscrit ou la version de l’éditeur.
For the publisher’s version, please access the DOI link below./ Pour consulter la version de l’éditeur, utilisez le lien DOI ci-dessous.
https://doi.org/10.1016/j.chroma.2015.04.040
Access and use of this website and the material on it are subject to the Terms and Conditions set forth at
Determination of thiocyanate in saliva by headspace gas
chromatography-mass spectrometry, following a single-step aqueous
derivatization with triethyloxonium tetrafluoroborate
Ammazzini, Sara; Onor, Massimo; Pagliano, Enea; Mester, Zoltán;
Campanella, Beatrice; Pitzalis, Emanuela; Bramanti, Emilia; D'Ulivo,
Alessandro
https://publications-cnrc.canada.ca/fra/droits
L’accès à ce site Web et l’utilisation de son contenu sont assujettis aux conditions présentées dans le site LISEZ CES CONDITIONS ATTENTIVEMENT AVANT D’UTILISER CE SITE WEB.
NRC Publications Record / Notice d'Archives des publications de CNRC:
https://nrc-publications.canada.ca/eng/view/object/?id=a8070629-de69-4fa5-83d8-5d59b7dd0f78 https://publications-cnrc.canada.ca/fra/voir/objet/?id=a8070629-de69-4fa5-83d8-5d59b7dd0f78
Determination of thiocyanate in saliva by headspace gas chromatography-mass spectrometry, following a single-step aqueous derivatization with triethyloxonium tetrafluoroborate
Sara Ammazzini a,b, Massimo Onor a, Enea Pagliano c,#, Zoltán Mester c, Beatrice Campanella a,b, Emanuela Pitzalis a, Emilia Bramanti a, and Alessandro D’Ulivo a
a C.N.R., Institute of Chemistry of Organometallic Compounds, UOS of Pisa, Via Moruzzi, 1, 56124 Pisa, Italy b University of Pisa, Department of Chemistry and Industrial Chemistry, Via Risorgimento, 35 56125 Pisa, Italy
c National Research Council of Canada, 1200 Montreal Road, Ottawa, ON K1A 0R6, Canada
#
corresponding author’s e-mails: enea.pagliano@nrc.ca and enea.pagliano@outlook.com
Abstract
A novel method for the determination of salivary thiocyanate is presented. Thiocyanate was converted into ethyl thiocyanate by single-step aqueous derivatization based on triethyloxonium tetrafluoroborate and measured by gas chromatography-mass spectrometry (15 min runtime). The ethyl thiocyanate derivative is volatile and can be sampled from the headspace. The derivatization chemistry proposed allows for separation of the analyte from saliva matrix whose introduction in the measurement system is avoided. Quantitation of the analyte was obtained by isotope dilution, employing a 13C-enriched thiocyanate as internal standard. Technical details and fundamental aspects of derivatization chemistry and calibration strategy are presented.
The method was validated by comparison with a standard method based on ion chromatography. The two independent methodologies produced results in agreement within 3%. Also a three level spike recovery
determination of thiocyanate (low part-per-billion range). For the application described the full detection potential of the method was not required and the sample preparation presented has been designed for quantitation of saliva samples containing 1-400 g/g of thiocyanate with a combined standard uncertainty of 2% relative for saliva samples containing 25 g/g of thiocyanate. This method was applied for the determination of thiocyanate in human saliva samples.
Keywords: Thiocyanate, saliva, smokers and nonsmokers, triethyloxonium tetrafluoroborate derivatization, GC/MS, isotope dilution
1. Introduction
The determination of thiocyanate in biological fluids is of biomedical and toxicological relevance [1]. Thiocyanate is the major metabolic detoxification product of cyanide and its generation is associated with the transsulfuration reaction between a sulfur-donor molecule – such as thiosulfate – and CN−, catalyzed by the rhodanese enzyme [2-4]. Traces of cyanide can be found in almost all edible plants such as almonds, cabbages, and turnip [5]. However, the main pathway for human exposure to cyanide is represented by tobacco smoke which can yield up to 500 g of HCN per cigarette [6]. HCN may enter the body via lungs, gastrointestinal tract and skin; chronic exposure to cyanide, even at low levels, can promote the development of serious health conditions, including myelin degeneration and abnormal thyroid activity [7]. Thiocyanate is regarded as a long-term biomarker for cyanide exposure [6]; it is the first biomarker for the assessment of the internal smoking dose [6] and its determination in saliva, serum and urine is still used to distinguish smokers from nonsmokers [8-9].
Historically, the first analytical approaches for the determination of thiocyanate in biological fluids [10] were based on the spectrophotometric detection of colored complexes [11-12]; for example, Bowler’s method exploited the reactivity of SCN− with Fe(III) in acidic media to yield reddish complex [Fe(SCN)]2+ [8, 13]. The use of ion chromatography was proposed later, and detection of thiocyanate was accomplished by UV at 210 nm [14], or suppressed conductivity [15]. The use of a chromatographic technique is surely an advantage with respect to the direct spectrometric detection in terms of control of the interferences, but the use of a non-analyte specific detector may give rise to specificity problems when complex matrices are investigated. In this vein, the introduction of mass spectrometry has been beneficial in addressing both specificity and sensitivity issues. Moreover, mass spectrometry allows for isotope dilution quantitation, thus making the analytical methods adequate for precise measurements [16]. For the determination of thiocyanate in biological fluids, mass spectrometry has been proposed in combination
been applied to convert SCN− into F
5Bz-SCN [18]. Pentafluorobenzyl derivatization, however, entails a non-aqueous media, a reaction temperature of 70 °C and a solvent extraction of the derivative. For biological samples solvent extraction is not an ideal approach because hydrophobic matrix compounds are also solubilized and introduced into the GC. Moreover, mass spectrometry in EI+ mode is not very sensitive (0.2 g/mL of SCN−) for detection of F
5Bz-SCN [18], and only the use of chemical ionization in negative mode can bring the limit of detection into the low part-per-billion range [20]. To overcome the disadvantages of the F5Bz-Br approach, we recently proposed an alternative carbon-based derivatization chemistry which employs triethyloxonium salts [21-22]. Et3O+[BF4]− [23-25] is a water soluble reagent able to perform ethylation directly in aqueous media and at room temperature. The derivatization step is straightforward and allows for conversion of thiocyanate anion to the corresponding ethyl derivative Et-SCN. Ethyl thiocyanate is a semi-volatile molecule (boiling point: 146 °C [26]) suitable for headspace sampling. The sample preparation proposed achieves a first order separation of thiocyanate ions from the sample matrix. In this paper we describe this novel analytical method for the determination of thiocyanate by GC/MS. The method has been validated and designed for the determination of salivary thiocyanate.
2. Materials and methods
2.1 Reagents and standards
Isotopically enriched thiocyanate, KS13CN (x(13C) = 0.99 mol/mol) was purchased from Aldrich, whereas a primary standard solution of thiocyanate of natural isotopic composition was obtained from Fluka (1000 ± 5 g/mL SCN− in water, analytical standard). Triethyloxonium tetrafluoroborate (Fluka; w(Et3O+[BF4]−)
0.97 g/g), sodium hydroxide solution (Fluka, TraceSELECT®; w(NaOH) 0.3 g/g), and sodium sulfate decahydrate (Carlo Erba; w(Na2SO4·10 H2O]) 0.99 g/g) were used. Preparation/dilution of samples and solutions was performed gravimetrically using ultrapure water (MilliQ; 18.2 M cm at 25 °C).
2.2 Samples of saliva
Saliva samples were collected from ten healthy volunteers by using STARSTED Salivette® for Cortisol Testing. The sampling was performed in the morning before breakfast, first cigarette, and teeth brushing by holding the Salivette’s swab in the mouth for 10 min without chewing. Each sample was then kept frozen at –20 °C until the day of analysis. Among the volunteers, five were nonsmokers (samples C1 to C5) whereas five were smokers (samples C6 to C10). The volunteers were chosen regardless of age (from 20 to 60 years old) and gender.
2.3 Safety considerations
Triethyloxonium tetrafluoroborate is a strong alkylating agent and a water-soluble nonvolatile salt. To avoid exposure, it is recommended to handle this chemical in a fumehood wearing gloves and goggles. The solid Et3O+[BF4]− should be kept in a refrigerator at –20 °C.
2.4 Analytical procedure
For the calibration of the instrumental response, aliquots of 50, 100, 200, 400, and 800 L of a primary standard solution of thiocyanate (3.05 g/g of SCN−) were introduced in 10 mL headspace vials (Agilent Technologies, Part No. 8010-0038). A blank was also prepared for the construction of the calibration plot. For the preparation of the samples, the saliva was gravimetrically diluted 1:10 with ultrapure water and 50 L of this solution were placed in a headspace vial. The transfer of such volumes was accomplished using adjustable pipettes and, for better precision, all aliquots were weighted. At this point each vial was spiked with 50 L of isotopic internal standard (100.0 g/g of S13CN−) followed by the addition of 1 g of Na2SO4·10 H2O, 10 L of 10 M NaOH, and ultrapure water to reach a volume of 6 mL. After dilution the mass fraction of the thiocyanate primary standard of natural isotopic composition in the six calibration blends was 0, 25.4, 50.8, 102, 204, and 408 ng/g SCN− (Figure 1), whereas the mass fraction of the isotopic internal standard was 833 ng/g S13CN− for all sample/calibration blends. All solutions were then reacted with 100 L of an aqueous solution of triethyloxonium tetrafluoroborate prepared by dissolving 1 g Et3O+[BF4]− in 1 mL of cold water (4 °C). The Et3O+[BF4]−aqueous solution is stable for only 10 minutes, therefore it must be added quickly to samples and standards. The vials were then sealed with holed screw-caps equipped with teflon/silicone septa for use with the CombiPAL (Agilent Technologies, Part No. 8010-0139) and kept at room temperature in the dark for at least 30 min.
2.5 Gas chromatography mass spectrometry
Et3O+[BF4]− converts thiocyanate to ethyl thiocyanate which can be analyzed by headspace GC/MS. An Agilent 6850 gas chromatograph, equipped with a split/splitless injector, was used in combination with an Agilent 5975c mass spectrometer. A CTC CombiPAL autosampler was employed for the headspace sampling. The vials were incubated at 70 °C for 10 min. A 1 mL headspace volume was then sampled (gas-tight syringe held at 80 °C) and injected into the gas chromatograph. The syringe was flushed with helium for cleaning (no carry-over problems were encountered). The inlet liner (internal diameter of 1
mm) was held at 200 °C and the injection was performed in split mode (split ratio 8:1; helium flow rate: 1 mL/min). Compounds were then separated on a mid-polarity column (DB-624; length: 60 m; stationary phase: 6%-cyanopropyl-phenyl-94%-dimethyl polysiloxane; 0.25 mm inner diameter; 1.40 µm coating) using the following temperature program: 2 min at 60 °C, 15 °C/min to 200 °C followed by 30 °C/min to 250 °C held for 2 min (total runtime: 15 min). The temperature of the transfer line was set at 260 °C. After GC separation, ethyl thiocyanate was ionized in positive EI. The MS acquisition was performed in total ion chromatography (TIC) and in selected ion monitoring (SIM) modes. TIC allowed for the identification of the derivative, whereas SIM was implemented for quantitative purposes by monitoring
m/z of 59, 60, 87 and 88 (100 ms dwell time).
2.6 Ion chromatography UV-vis method
The analytical performance of the novel method was compared against a standard method based on ion chromatography [14]. A Dionex DX-500 ion chromatograph equipped with a GP40 gradient pump and a Rheodyne 7125 injector (75 L sample loop) was employed. Chromatographic separation was carried out in isocratic mode (flow rate: 1.0 ml/min; eluent: 35 mmol/L NaOH) on a Dionex IonPac AS 16 column (4 x 250 mm, 9 m particle diameter) equipped with a Dionex IonPac AG 16 guard column (2 x 50 mm, 13 m particle diameter). The detection of thiocyanate ions was obtained with AD-20 variable wavelength UV-vis detector at 230 nm. A Dionex PeakNet chromatography data system (version 4.5) was used for data acquisition and processing. Before introduction, saliva samples were diluted 1:10 and passed through a Dionex On-Guard II RP cartridge for retention of hydrophobic substances. The eluent was then filtered at 0.45 m on Agilent Captiva Premium Syringe Filters and then injected in the ion chromatography system.
3. Results and discussion
3.1 Triethyloxonium derivatization
Triethyloxonium tetrafluoroborate has been recently introduced in the field of analytical chemistry as derivatizing agent for several inorganic anions of environmental and biomedical interest [21-22]. These inorganic anions – that cannot be analyzed directly by gas chromatography – are converted into volatile ethyl-derivatives by reaction with triethyloxonium. For example, thiocyanate reacts with Et3O+(aq) according to the following reaction:
SCN−(aq) + Et
3O+(aq) → Et−SCN(aq) + Et2O (1)
Et−SCN(aq) Et−SCN(g) (2)
Triethyloxonium salts can perform ethylation in aqueous media at room temperature. An aqueous solution of Et3O+[BF4]− is readily prepared by dissolving the oxonium reagent in water and can be employed directly for derivatization of the sample.
Aqueous solutions of triethyloxonium, however, are not stable because of their disposition to hydrolysis. At room temperature complete hydrolysis occurs after 3 hours:
H2O + Et3O+ → Et−OH + Et2O + H+ (3)
Aqueous Et3O+[BF4]− is being typically used within 10 minutes from its preparation. In general, the reactivity of triethyloxonium tetrafluoroborate toward the analytes of interest and, consequently, the efficiency of the derivatization, depend on experimental conditions such as the amount of reagent used for derivatization, and the acidity of the reaction media.
By increasing the amount of triethyloxonium, derivatization yield increases, but the pH of the sample turns acidic (3). For certain analytes, such as thiocyanate, strongly acidic conditions are undesirable because of the potential protonation of the analyte:
The protonation of the analyte is responsible for the deactivation of the analyte toward ethylation, resulting in decreased derivatization yield. The use of an alkaline buffer is therefore suggested for the derivatization of thiocyanate.
3.2 Quantification model
The use of an isotopic internal standard in analytical chemistry allows for isotope dilution calibration, which is regarded as a primary method of analysis [27]. Over the years isotope dilution has witnessed many reformulations [16]. In the most intuitive approach to isotope dilution, the isotopic material is regarded as a classical internal standard. In this vein, the calibration plot is constructed by preparing several calibration blends (A*B) obtained by mixing varying amounts of a primary standard (mA*(A*B)) with a set amount of isotopic internal standard (mB(A*B)). The isotope ratio (rA*B) of the A*B calibrators is then measured by mass spectrometry and a calibration line is constructed by plotting the ratio
wA*[mA*(A*B)/ mB(A*B)] (x-axis) versus rA*B, (wA* is the mass fraction of the analyte in the primary standard used for preparation of the calibration blends). In our case, the isotope ratio rA*B is the ratio between the area of the chromatographic peak at m/z = 87 (CH3CH2S12CN+, the most abundant natural isotope) and the area of the chromatographic peak at m/z = 88 (CH3CH2S13CN+, most abundant in the isotopic internal standard). The dependence of wA*[mA*(A*B)/ mB*(A*B)] versus rA*B is theoretically described by a hyperbola [28] and this model should be used to interpret the data. The intrinsic non-linearity of an isotope dilution plot is due to the potential overlap of the signals of analyte and internal standard. This effect can be relevant especially for large molecule and low isotopic enrichment [28]. In our case, however, no deviations from linearity were detected and a linear model was utilized for quantitation. In the supplemental information the residual analysis on the calibration plot (Figure 1) and more details on the calibration are provided.
3.3 Advantages and limitations of isotope dilution
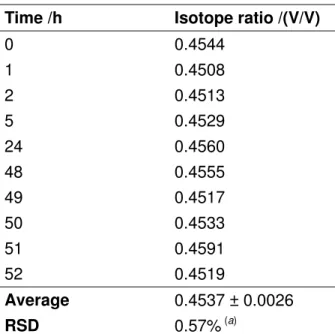
The use of isotope dilution for analysis of biological matrices can be very convenient. Since the chemical and physical behaviors of the isotopic internal standard can perfectly mimic the analyte, in such an experiment the analyte losses due to sample preparation or incomplete derivatization, and the matrix effects are entirely compensated for [29]. In this vein, the labelled material internal standard should always be added first. An isotope dilution experiment, however, does not correct for possible formation of analyte occurring during sample preparation [30]. In a complex biological sample the formation of analyte can originate from degradation processes or enzymatic activity. In order to confirm that no analyte formation occurs in our case, a blend of saliva and S13CN− was prepared and monitored versus time. In Table 1 the measured isotope ratios (rAB) of this blend are reported. rAB does not vary with time (two days) within the limit of the experimental error u(rAB) = 0.6%. The formation of endogenous SCN− (natural isotopic composition) would have resulted in the variation of the isotopic composition of this mixture. This experiment confirms that no formation of analyte occurred and that the homogenization between sample and internal standard is instantaneous. This result provides a first indication of the validity of the method.
3.4 Gas chromatography mass spectrometry
Typical chromatograms of thiocyanate in saliva are shown in Figure 2. The chromatograms of Figure 2a and 2b were obtained during analysis of a pool prepared from 10 saliva samples. Despite the matrix complexity, the chromatogram is clean, the baseline is stable and no co-eluting peaks are observed with the analytical one. These merits are a direct consequence of the sample preparation step. In fact, the derivatization chemistry proposed here has the great advantage of converting the analyte into a derivative that can be sampled from the headspace, allowing an initial separation of the analyte from the matrix.
thiocyanate elutes under the form of the ethyl-derivative which is readily detected with mass spectrometry in EI+ mode. The EtSCN mass spectrum is shown in Figure 3. The mass spectrum of the ethyl thiocyanate generated from a standard of natural isotopic composition reveals main signals at m/z = 87 [Et-S12CN]+, 72 [CH
2-S12CN]+, 59 [HS12CN]+, 45 [CH-S]+, and 29 [CH3CH2]+. The mass spectrum of the isotopic internal standard, enriched in 13C, exhibits the expected +1 shift.
Table 1. Variation of the S12CN−/S13CN− isotope ratio in a saliva sample
Time /h Isotope ratio /(V/V)
0 0.4544 1 0.4508 2 0.4513 5 0.4529 24 0.4560 48 0.4555 49 0.4517 50 0.4533 51 0.4591 52 0.4519 Average 0.4537 ± 0.0026 RSD 0.57%(a)
(a). A blend of saliva sample was prepared according to the procedure describe herein and measured at different times. No
Figure 2. Gas chromatograms of salivary thiocyanate (retention time 8.97 min). a. Selected ion monitoring (m/z = 87) of a saliva sample diluted 1:10. b. Total ion chromatography of the same saliva sample. c. Selected ion monitoring (m/z = 87) of a saliva sample sourced from a nonsmoker (blue line, Figure 4) and from a smoker (red line, Figure 4).
Figure 3. Experimental EI+ mass spectra of the ethyl thiocyanate of natural isotopic composition (top) and of the 13C enriched ethyl thiocyanate (bottom)
3.5 Method validation
Due to the lack of Certified Reference Materials for thiocyanate in saliva, method validation was performed by comparing the analytical results derived from application of the novel methodology versus a standard method based on ion chromatography and by a series of spike recovery tests. For this purpose, a pool of saliva was prepared by mixing samples from 20 healthy volunteers (Pool-1). From Pool-1 a three level spike recovery test was prepared by adding to three aliquots of Pool-1 known amounts of thiocyanate primary standard (Pool-2 to 4). All four saliva samples were analyzed in parallel by the novel GC/MS method, and by ion chromatography. An agreement of results within 3% between the two independent methodologies could be found (Table 2). Ion chromatography data were systematically lower than GC/MS data because the SPE cartridge used to pre-clean the saliva samples before injection into the ion chromatograph provides for a recovery of thiocyanate of 98% (n = 3). Results of the spike recovery test provide a further validation of the method proposed: recovery of thiocyanate spike in Pool-2 to 4 samples was quantitative within the experimental error (Table 3).
Table 2. Comparison of novel GC/MS method with ion chromatography UV-vis
Sample Novel GC/MS method Ion chromatography UV-vis
w(SCN−) /( g/g) w(SCN−) /( g/g)
Pool-1 93.44 ± 0.87 91.1 ± 1.4
Pool-2 113.5 ± 1.4 112.8 ± 1.2
Pool-3 133.7 ± 1.0 131.6 ± 1.6
Pool-4 152.9 ± 1.0 147.7 ± 1.7
The combined standard uncertainty on the analytical results has been estimated accordingly to ISO GUM [32].
Table 3. Spike recovery test: novel GC/MS method and ion chromatography UV-vis
Sample w(SCN −
)ADDED /( g/g)
Novel GC/MS method Ion chromatography UV-vis
w(SCN−) /( g/g) Recovery w(SCN−) /( g/g) Recovery Pool-2 20.3 20.1 ± 1.7 99% 21.7 ± 1.8 107% Pool-3 39.3 40.3 ± 1.3 103% 40.5 ± 2.1 103% Pool-4 58.6 59.5 ± 1.3 102% 56.5 ± 2.2 97%
The combined standard uncertainty on the analytical results has been estimated accordingly to ISO GUM [32].
3.6 Determination of salivary thiocyanate of smokers and nonsmokers
The method was applied for quantitation of thiocyanate in some saliva samples. Among ten healthy volunteers, five of them were nonsmokers (C1 to C5) and five smokers (C6 to C10). Within the smokers the sampling was performed after at least 12 hours’ time from the last cigarette (the half-life of thiocyanate in saliva ranges from 10 to 14 days [6]). The levels of thiocyanate observed in the saliva of these volunteers are reported in Figure 4. In a grand average the smoking group shows a mass fraction of thiocyanate in their saliva of 145.0 ± 49.3 g/g whereas the nonsmoking group of 36.1 ± 21.7 g/g. The analytical results obtained are consistent with the data reported in the literature [9, 33] which support the belief that such data can be used to distinguish smokers from nonsmokers [8]. The use of thiocyanate concentration in body fluids like saliva, however, cannot efficiently differentiate between moderate-light smokers and nonsmokers [6]. In fact, sample C6 (light-smoker, Figure 4) has a content of salivary thiocyanate of 62.78 ± 0.67 g/g, that is lower than sample C1 70.05 ± 0.67 g/g (nonsmoker). This evidence is coherent to the fact that salivary thiocyanate can be related to cyanide sources other than tobacco smoke, such as environmental pollution or certain types of food [34-35].
3.7 Figures of merit
The combined standard uncertainty of all analytical results presented here has been estimated according to the ISO GUM [32] approach. Data reported in Figure 4 and Table 2 show that the worst relative uncertainty was observed for sample C3 (10.99 ± 0.51 g/g SCN−, u
R = 4.6%) whereas precision better than 2% are reported for all other measurements (25-200 g/g SCN− in undiluted saliva). From the spike recovery test reported in Table 3, the quantitation of a spike of 20.3 g/g SCN− over a background of 93.4 g/g SCN− could be performed with a relative standard uncertainty of 8% (20.3 g/g SCN− added; 20.1 ± 1.7 g/g SCN− recovered). This method is also very sensitive. When 1 mL of 50 ng/g SCN− standard was analyzed, a signal-to-noise ratio of 250 was observed for the analytical peak. This method is potentially suitable to perform quantitation at the part-per-billion level. Thus, a detection limit of 5 ng/g and a limit
of quantitation of 25 ng/g can be considered conservative. Since thiocyanate measurement in biological fluids is not an ultra-trace determination, the sample preparation was designed for higher level of concentration. For this purpose the saliva samples were diluted and only a small amount was analyzed. Sample C3 (Figure 4) has the lowest level of salivary thiocyanate (10.99 ± 0.51 g/g SCN− in the undiluted saliva). A 50 L aliquot of a 1:10 dilution of sample C3 produced an analytical peak detectable with a signal-to-noise ratio of 250. The method here described is therefore suitable for quantitation of salivary thiocyanate in the mass fraction range 1-400 g/g SCN−. For applications that require more detection power, sample preparation can be revised accordingly, for example by increasing the amount of sample processed and/or decreasing the dilution factor.
Figure 4. Salivary thiocyanate levels from ten healthy volunteers. The bars from C1 to C5 report the mass fraction of thiocyanate recovered from the saliva of nonsmokers (on average 36.1 ± 21.7 g/g), whereas the bars from C6 to C10 present the mass fraction of thiocyanate recovered from the saliva of smokers (on average 145.0 ± 49.3 g/g). Error bars represent the combined standard uncertainty of the measurement estimated accordingly to ISO GUM [32].
4. Conclusion
Since the end of the 19th century, thiocyanate has been regarded as a biomarker to evaluate cyanide exposition, and its determination in biological fluids has served to discriminate between smokers and nonsmokers. The GC/MS method proposed here for the determination of this analyte is sensitive, specific, and can be applied for the analysis of complex biological matrices such as saliva. The derivatization is a safe single-step process based on aqueous chemistry. The ethyl thiocyanate generated is volatile and can be sampled from the headspace, avoiding introduction of the matrix into the measurement system. Quantitation is based on isotope dilution formalism and precision better than 5% relative were attained for all analytical results.
References
[1] D.M. Prue, J.E. Martin, A.S. Hume, A critical evaluation of thiocyanate as a biochemical index of smoking exposure, Behav. Ther. 11 (1980) 368-379.
[2] S.I. Baskin, D.W. Porter, G.A. Rockwood, J.A. Romano Jr., H.C. Patel, R.C. Kiser, C.M. Cook, A.L. Ternay Jr., In vitro and in vivo comparison of sulfur donors as antidotes to acute cyanide intoxication, J. Appl. Toxicol. 19 (1999) 173-183.
[3] L. Frankenberg, Enzyme therapy in cyanide poisoning: effect of rhodanese and sulfur compounds, Arch. Toxicol. 45 (1980) 315-323.
[4] H. Fiedler, J.L. Wood, Specificity studies on the -mercaptopyruvate-cyanide transsulfuration system, J. Biol. Chem. 222 (1956) 387-397.
[5] R.G.H. Baumeister, H. Schievelbein, G. Zickgraf-Rüdel, Toxicological and clinical aspects of cyanide metabolism, Arzneim.-Forsch. Drug Res. 25 (1975) 1056-1064.
[6] G. Scherer, Carboxyhemoglobin and thiocyanate as biomarkers of exposure to carbon monoxide and hydrogen cyanide in tobacco smoke, Exp. Toxicol. Pathol. 58 (2006) 101-124.
[7] S.L. Youso, G.A. Rockwood, B.A. Logue, The analysis of protein-bound thiocyanate in plasma of smokers and non-smokers as a marker of cyanide exposure, J. Anal. Toxicol. 36 (2012) 265-269. [8] W.C. Butts, M. Kuehneman, G.M. Widdowson, Automated method for determining serum thiocyanate, to distinguish smokers from nonsmokers, Clin. Chem. 20 (1974) 1344-1348.
[9] M.T. Jafari, M. Javaheri, Selective method based on negative electrospray ionization ion mobility spectrometry for direct analysis of salivary thiocyanate, Anal. Chem. 82 (2010), 6721-6725.
[10] B.A. Logue, D.M. Hinkens, S.I. Baskin, G.A. Rockwood, The analysis of cyanide and its breakdown products in biological samples, Crit. Rev. Anal. Chem. 40 (2010) 122-147.
[11] A.R. Pettigrew, G.S. Fell, Simplified colorimetric determination of thiocyanate in biological fluids, and its application to investigation of the toxic amblyopias, Clin. Chem. 18 (1972) 996-1000.
[12] W.N. Aldridge, A new method for the estimation of micro quantities of cyanide and thiocyanate, Analyst 69 (1944) 262-265.
[13] R.G. Bowler, The Determination of Thiocyanate in Blood Serum, Biochem. J. 38 (1944) 385-388. [14] Y. Michigami, K. Fujii, K. Ueda, Y. Yamamoto, Determination of thiocyanate in human saliva and urine by ion chromatography, Analyst 117 (1992) 1855-1858.
[15] I. Demkowska, . Polkowska, J. Namie nik, Application of ion chromatography for the determination of inorganic ions, especially thiocyanates in human saliva samples as biomarkers of environmental tobacco smoke exposure, J. Chromatogr., B 875 (2008) 419-426.
[16] E. Pagliano, Z. Mester, J. Meija, Reduction of measurement uncertainty by experimental design in high-order (double, triple, and quadruple) isotope dilution mass spectrometry: application to GC-MS measurement of bromide, Anal. Bioanal. Chem. 405 (2013) 2879-2887.
[17] R.K. Bhandari, E. Manandhar, R.P. Oda, G.A. Rockwood, B.A. Logue, Simultaneous
high-performance liquid chromatography-tandem mass spectrometry (HPLC-MS-MS) analysis of cyanide and thiocyanate from swine plasma, Anal. Bioanal. Chem. 406 (2014) 727-734.
[18] S. Kage, T. Nagata, K. Kudo, Determination of cyanide and thiocyanate in blood by gas chromatography and gas chromatography-mass spectrometry, J. Chromatogr., B 675 (1996) 27-32. [19] B.D. Paul, M.L. Smith, Cyanide and thiocyanate in human saliva by
gas chromatography-mass spectrometry, J. Anal. Toxicol. 30 (2006) 511-515.
[20] R.K. Bhandari, R.P. Oda, S.L. Youso, I. Petrikovics, V.S. Bebarta, G.A. Rockwood, B.A. Logue, Simultaneous determination of cyanide and thiocyanate in plasma by chemical ionization gas
chromatography mass-spectrometry (CI-GC-MS), Anal. Bioanal. Chem. 404 (2012) 2287-2294. [21] A. D’Ulivo, E. Pagliano, M. Onor, E. Pitzalis, R. Zamboni, Vapor generation of inorganic anionic
[22] E. Pagliano, J. Meija, J. Ding, R.E. Sturgeon, A. D’Ulivo, Z. Mester, Novel ethyl-derivatization approach for the determination of fluoride by headspace gas chromatography/mass spectrometry, Anal. Chem. 85 (2013) 877-881.
[23] H. Meerwein, E. Battenberg, H. Gold, E. Pfeil, G. Willfang, Über tertiäre Oxoniumsalze, II, J. Prakt. Chem. 154 (1939) 83-156.
[24] H. Perst, Oxonium Ions in Organic Chemistry, Verlag Chemie GmbH, Weinheim, 1971. [25] G.A. Olah, K.K. Laali, Q. Wang, G.K. Surya Prakash, Onium Ions, Wiley, New York, 1998.
[26] R.C. Weast, J.G. Grasselli, CRC Handbook of Data on Organic Compounds, 2nd Editon, CRC Press, Inc., Boca Raton, FL, 1989, 1.
[27] P. De Bievre, Isotope Dilution Mass Spectrometry as a Primary Method of Analysis, Anal. Proc. 30 (1993) 328-333.
[28] J.F. Pickup, K. McPherson, Theoretical considerations in stable isotope dilution mass spectrometry for organic analysis, Anal. Chem. 48 (1976) 1885-1890.
[29] J. Meija, Z. Mester, Paradigms in isotope dilution mass spectrometry for elemental speciation analysis, Anal. Chim. Acta 607 (2008) 115-125.
[30] H. Hintelmann, R. Falter, G. Ilgen, R.D. Evans, Determination of artifactual formation of monomethylmercury (CH3Hg+) in environmental samples using stable Hg2+ isotopes with ICP-MS detection: Calculation of contents applying species specific isotope addition, Fresenius J. Anal. Chem. 358 (1997) 363-370.
[31] R.E. Sturgeon, X. Guo, Z. Mester, Chemical vapor generation: are further advances yet possible? Anal. Bioanal. Chem. 382 (2005) 881-883.
[32] Evaluation of measurement data – Guide to the expression of uncertainty in measurement JCGM 100 (2008).
[33] Z.-F. Chen, B.W. Darvell, V.W.-H. Leung, Human salivary anionic analysis using ion chromatography, Arch. Oral. Biol. 49 (2004) 863-869.
[34] D.A. Jones, Why are so many food plants cyanogenic? Phytochemistry 47 (1998) 155-162.
[35] N. Mlingi, N.H. Poulter, H. Rosling, An outbreak of acute intoxications from consumption of insufficiently processed cassava in Tanzania, Nutr. Res. 12 (1992) 677-687.