HAL Id: hal-02414970
https://hal.archives-ouvertes.fr/hal-02414970
Submitted on 24 Aug 2020
HAL is a multi-disciplinary open access
archive for the deposit and dissemination of
sci-entific research documents, whether they are
pub-lished or not. The documents may come from
teaching and research institutions in France or
abroad, or from public or private research centers.
L’archive ouverte pluridisciplinaire HAL, est
destinée au dépôt et à la diffusion de documents
scientifiques de niveau recherche, publiés ou non,
émanant des établissements d’enseignement et de
recherche français ou étrangers, des laboratoires
publics ou privés.
modelling in northern Morocco
Yves Tramblay, R. Bouaicha, L. Brocca, W. Dorigo, Christophe Bouvier, S.
Camici, Éric Servat
To cite this version:
Yves Tramblay, R. Bouaicha, L. Brocca, W. Dorigo, Christophe Bouvier, et al.. Estimation of
an-tecedent wetness conditions for flood modelling in northern Morocco. Hydrology and Earth System
Sciences, European Geosciences Union, 2012, Hydrology and Earth System Sciences, 16 (11),
pp.4375-4386. �10.5194/hess-16-4375-2012�. �hal-02414970�
www.hydrol-earth-syst-sci.net/16/4375/2012/ doi:10.5194/hess-16-4375-2012
© Author(s) 2012. CC Attribution 3.0 License.
Earth System
Sciences
Estimation of antecedent wetness conditions for flood modelling
in northern Morocco
Y. Tramblay1, R. Bouaicha2, L. Brocca3, W. Dorigo4, C. Bouvier1, S. Camici3, and E. Servat1
1IRD – UMR5569, Hydrosciences-Montpellier, Montpellier, France
2Direction de la Recherche et de la Planification de l’Eau (DRPE), Rabat, Morocco 3Research Institute for Geo-Hydrological Protection, CNR, Perugia, Italy
4Institute of Photogrammetry and Remote Sensing, Vienna University of Technology, Vienna, Austria Correspondence to: Y. Tramblay (ytramblay@gmail.com)
Received: 26 June 2012 – Published in Hydrol. Earth Syst. Sci. Discuss.: 10 August 2012 Revised: 11 October 2012 – Accepted: 6 November 2012 – Published: 23 November 2012
Abstract. In northern Morocco are located most of the dams
and reservoirs of the country, while this region is affected by severe rainfall events causing floods. To improve the man-agement of the water regulation structures, there is a need to develop rainfall–runoff models to both maximize the stor-age capacity and reduce the risks caused by floods. In this study, a model is developed to reproduce the flood events for a 655 km2catchment located upstream of the 6th largest dam in Morocco. Constrained by data availability, a stan-dard event-based model combining a SCS-CN (Soil Conser-vation Service Curve Number) loss model and a Clark unit hydrograph was developed for hourly discharge simulation using 16 flood events that occurred between 1984 and 2008. The model was found satisfactory to reproduce the runoff and the temporal evolution of floods, even with limited rain-fall data. Several antecedent wetness conditions estimators for the catchment were compared with the initial condition of the model. Theses estimators include an antecedent dis-charge index, an antecedent precipitation index and a con-tinuous daily soil moisture accounting model (SMA), based on precipitation and evapotranspiration. The SMA model performed the best to estimate the initial conditions of the event-based hydrological model (R2= 0.9). Its daily output has been compared with ASCAT and AMSR-E remote sens-ing data products, which were both able to reproduce with accuracy the daily simulated soil moisture dynamics at the catchment scale. This same approach could be implemented in other catchments of this region for operational purposes. The results of this study suggest that remote sensing data are potentially useful to estimate the soil moisture conditions in the case of ungauged catchments in Northern Africa.
1 Introduction
Northern Morocco is the rainiest part of the country, with a Mediterranean type of climate influenced by the nearby Atlantic Ocean. This region hosts some of the largest dams and reservoirs in the country (Bouaicha and Benabdelfadel, 2010), which are mainly used for water supply and irrigation. Like other regions bordering the Mediterranean Sea, this region is also affected by violent floods, causing extended damage to the populations and infrastructures (Bouaicha and Benabdelfadel, 2010; Llasat et al., 2010). Estimates of flood volumes are needed to improve dam management in this re-gion, focusing on maximizing the storage of the reservoirs to address regional water scarcity while avoiding dam overtop-ping and failure. With the recent development of hydrometric data transmission systems in Morocco, it will soon be possi-ble to implement real-time flood modelling to increase dam safety. Therefore, there is a current need to improve the flood modelling approaches in Morocco.
Like in many developing countries, long records of rain-fall and runoff data at short time steps are rarely available in North Africa (Hugues, 2011). Therefore, in the context of flood modelling, event-based models are representing a sound alternative to continuous ones. Easy-to-use and sim-ple, event-based models are also often preferred to continu-ous models for real time operational applications in South-ern Europe. However, their main limitation is that the initial soil moisture conditions need be set from external informa-tion (Berthet et al., 2009; Tramblay et al., 2010). Several studies have shown the strong influence of the antecedent soil moisture conditions on the response of a catchment to
a rainfall event in different regions such as Spain (Castillo et al., 2003; Rodr´ıguez-Blanco et al., 2012), Southern France (Tramblay et al., 2010, 2011; Cousteau et al., 2012), Italy (Brocca et al., 2009a; Norbiato et al., 2008), Southwest-ern USA (Wagener et al., 2007), and China (Huang et al., 2007). An important research question, as stated by Wa-gener et al. (2007), is how sensitive the model predictions of runoff are to the specification of initial wetness conditions, and how complex an inter-storm model must be to meet this requirement.
In recent studies, relationships have been established be-tween indicators of catchment’s antecedent wetness con-ditions and the initial concon-ditions of event-based models. In particular, the Soil Conservation Service Curve Number (SCS-CN) method (Mishra and Singh, 2003) is widely used for operational flood modelling in Mediterranean countries (Brocca et al., 2009a, 2011b; Tramblay et al., 2010). More-over, this model is suitable to account for initial soil moisture conditions with its S parameter describing the initial soil po-tential maximum retention. Several authors have successfully correlated in-situ soil moisture measurements with the S pa-rameter of the SCS-CN model for floods occurring in semi-arid environments (Huang et al., 2007; Brocca et al., 2009a; Tramblay et al., 2010). When no measurements of soil mois-ture are available, alternatively a continuous Soil Moismois-ture Accounting (SMA) model can be used. This approach has been also used to set up the initial conditions of event-based models (Norbiato et al., 2008; Javelle et al., 2010; Cousteau et al., 2012).
In addition, soil moisture data retrieved from active and passive microwave sensors has become readily available at a temporal resolution of approximately one day (Brocca et al., 2011a). Nowadays, the most established products are those provided by the Advanced Microwave Scanning Ra-diometer for the Earth observing system (AMSR-E) on-board the Aqua satellite, which will be continued by the recently launched AMSR-2, the Advanced SCATterometer (ASCAT) on board the MetOp (Meteorological Operational) satellite, and the Soil Moisture and Ocean Salinity (SMOS) mission of the European Space Agency. The various remote sensing products have been successfully validated against ground soil moisture data in different Mediterranean catch-ments (Amri et al., 2012; Gruhier et al., 2008; Albergel et al., 2009; Brocca et al., 2011a; Parrens et al., 2012). In the recent years, a growing number of studies are considering the use of this type of data to improve flood modelling and forecasting, through the implementation of data assimilation techniques (Beck et al., 2009; Brocca et al., 2010a, 2012; Meier et al., 2011; Matgen et al., 2012).
In this study, the feasibility of setting up a rainfall–runoff model with limited rainfall data is tested in order to repro-duce the flood events occurring upstream of a large dam in northern Morocco. A standard event-based model is devel-oped and tested as if it were used in an operational context. All model parameters are set as a constant for all the flood
events, except for the initial condition of the model for which different indicators of antecedent wetness conditions are compared. These indicators include antecedent precipita-tion and discharge indexes, as well as a simplified continu-ous SMA model depending on precipitation and evapotran-spiration data and a single parameter. Also, AMSR-E and ASCAT remote sensing data of soil moisture are evaluated for their ability to reproduce antecedent wetness conditions in the catchment. In Sect. 2 the study area and data are pre-sented. The rainfall–runoff model is presented in Sect. 3, and the modelling results and the comparison with AMSR-E and ASCAT datasets in Sect. 4.
2 Study area and datasets 2.1 Mdouar catchment
The Mdouar catchment (655 km2) is located upstream of the Makhazine Dam (1800 km2), the 6th largest in the country, in northern Morocco (Fig. 1). The climate is Mediterranean, with a wet season with moderate temperatures from October to April and a hot dry season from May to September. It is also influenced by the Atlantic Ocean, 40 km downstream. The basin consists of plains in the western part, while in the east the terrain becomes more rugged and mountainous. The altitude increases progressively eastward until reaching 1600 m with the foothills of the Rif mountain range. This configuration is causing large precipitation amounts in the basin, reaching up to 1100 mm per year on average but with a strong inter-annual variability. The soil substrate consists of an alternation of marl and sandstone. The western and cen-tral parts are subject to severe erosion. The predominance of impermeable soils in the watershed is favoring runoff, which is increased by the effect of slope in the eastern part. There are neither cities nor urban centers in the catchment; vege-tation is characterized by the presence of matorral, a typi-cal Mediterranean land cover, with a predominance of cork oak forests. Most of the forest cover is located in the head-water’s sub-catchments. In the lowest parts, on cultivated plains, agriculture is the dominant economic activity. The lo-cation of the basin provides a significant potential for water resources. The Makhazine Dam was built in 1979 for irri-gation, water supply, energy production, as well as protec-tion against flooding of the plain downstream. It is a 67 m high dam of mixed earth and rocks, creating a reservoir with a usable capacity of 724 Mm3. The mean annual inflow is 678 million m3 and the mean evaporation is 1176 mm yr−1.
The city of Ksar El Kebir (200 000 inhabitants) located im-mediately (8 km) downstream of the dam is a plain area highly vulnerable to flooding.
Fig. 1. Catchment and rain gauges stations.
2.2 Precipitation and discharge data
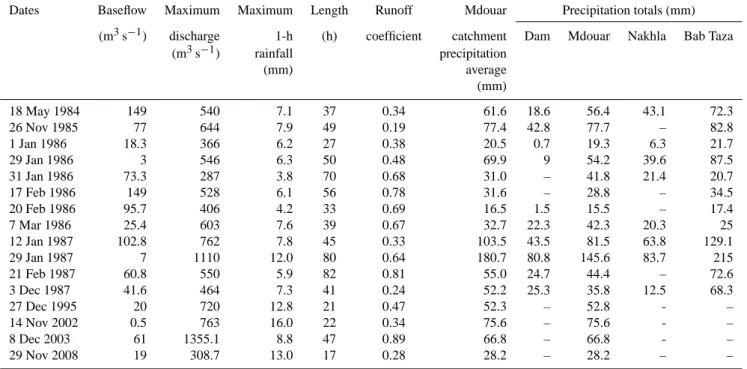
Daily precipitation data are available for stations Makhazine dam (60 m), Mdouar (90 m), Nakhla (210 m) and Bab Taza (900 m) between 1980 and 2011 (Fig. 1). For these stations, 5-min precipitation data are also available for a few episodes. The inventory of rainfall accumulations per episode is re-ported in Table 1. Total precipitation over the Mdouar catch-ment during the flood events was computed with the inverse distance method. There is a significant west–east gradient, with precipitation increasing from the Makhazine dam to the Bab Taza stations (Fig. 2). This gradient follows the grad-ual increase in altitude towards east. There is also a signif-icant correlation in the cumulative rainfall per episode be-tween the different stations, in particular bebe-tween Mdouar and Bab Taza (r = 0.96). There is a fairly strong temporal co-incidence of rainfall between the different stations: rainfall affects almost simultaneously the four stations, although sta-tions Nakhla and Bab Taza are respectively 67 km and 60 km away from the station located at the dam. Therefore, rainfall events causing flooding in the basin have a large spatial ex-tension. Such a configuration of rainfall fields supports the generation of potentially significant flooding by generating runoff simultaneously in the different tributaries. However, due to the low density of rain gauge stations for such a large area, it is difficult to analyze in detail the spatial distribution of rainfall intensities across the entire watershed.
Daily river discharge has been measured at Mdouar since 1969 and shows a strong seasonality, with most flow amount observed during winter. 75 % of annual maximum daily runoff occurs from December to February. No trends in ex-treme discharges are found between 1969 and 2008, similarly to what Tramblay et al. (2012) observed for extreme precip-itation in northern Morocco. There is a high variability of annual maximum daily values, between 69 and 1023 m3s−1, depending on the year. Hourly discharge data is available for 16 flood events between 1984 and 2008 (Table 1), of which
Fig. 2. Monthly mean precipitation (1980–2010) at the different
stations.
the vast majority occurred during winter. The base flow was extracted at the beginning of each episode, and the volume of runoff was separated from the base flow modelled by the recession model detailed in Sect. 3.1. The average runoff coefficient of all these episodes is 0.52 but it can vary be-tween 0.19 and 0.89, giving a first indication of the high vari-ability of the initial conditions of saturation of the basin from one episode to another.
2.3 Remote sensing soil moisture 2.3.1 ASCAT
The Advanced SCATterometer (ASCAT) is a real-aperture radar instrument successfully launched on board the MetOp satellite in 2006 that measures radar backscatter at C-band (5.255 GHz) in VV polarization. The spatial resolution of ASCAT is 25 km (resampled at 12.5 km) and, for Morocco, measurements are generally obtained at least once a day. The surface soil moisture product is retrieved from the AS-CAT backscatter measurements using the WARP 5.4 retrieval
Table 1. Flood events characteristics.
Dates Baseflow Maximum Maximum Length Runoff Mdouar Precipitation totals (mm)
(m3s−1) discharge 1-h (h) coefficient catchment Dam Mdouar Nakhla Bab Taza
(m3s−1) rainfall precipitation (mm) average (mm) 18 May 1984 149 540 7.1 37 0.34 61.6 18.6 56.4 43.1 72.3 26 Nov 1985 77 644 7.9 49 0.19 77.4 42.8 77.7 – 82.8 1 Jan 1986 18.3 366 6.2 27 0.38 20.5 0.7 19.3 6.3 21.7 29 Jan 1986 3 546 6.3 50 0.48 69.9 9 54.2 39.6 87.5 31 Jan 1986 73.3 287 3.8 70 0.68 31.0 – 41.8 21.4 20.7 17 Feb 1986 149 528 6.1 56 0.78 31.6 – 28.8 – 34.5 20 Feb 1986 95.7 406 4.2 33 0.69 16.5 1.5 15.5 – 17.4 7 Mar 1986 25.4 603 7.6 39 0.67 32.7 22.3 42.3 20.3 25 12 Jan 1987 102.8 762 7.8 45 0.33 103.5 43.5 81.5 63.8 129.1 29 Jan 1987 7 1110 12.0 80 0.64 180.7 80.8 145.6 83.7 215 21 Feb 1987 60.8 550 5.9 82 0.81 55.0 24.7 44.4 – 72.6 3 Dec 1987 41.6 464 7.3 41 0.24 52.2 25.3 35.8 12.5 68.3 27 Dec 1995 20 720 12.8 21 0.47 52.3 – 52.8 - – 14 Nov 2002 0.5 763 16.0 22 0.34 75.6 – 75.6 - – 8 Dec 2003 61 1355.1 8.8 47 0.89 66.8 – 66.8 - – 29 Nov 2008 19 308.7 13.0 17 0.28 28.2 – 28.2 – –
scheme. This method relies on a time series-based change detection approach which was previously developed for the ERS-1/2 scatterometer by Wagner et al. (1999). In this ap-proach, soil moisture is considered to have a linear relation-ship to backscatter (in dB), while the surface roughness is assumed to have a constant contribution in time. By knowing the typical yearly vegetation cycle and how it influences the backscatter–incidence angle relationship for each location on Earth, the vegetation effects are removed, revealing the soil moisture variations. The derived surface soil moisture prod-uct (corresponding to a depth of 2–3 cm) ranges between 0 % (dry) and 100 % (wet) and is available for the period 2007– 2011. Validation studies of the ASCAT soil moisture prod-ucts assessed their reliability for estimating both in-situ and modelled soil moisture observations across different regions in Europe (Albergel et al., 2009; Brocca et al., 2010b, 2011a; Parrens et al., 2012) and also in Africa (Sinclair and Pegram, 2010), thus addressing their use for practical applications.
2.3.2 AMSR-E
The AMSR-E sensor on board the NASA’s Aqua satellite provided passive microwave measurements at 6.9 GHz (C-band) and five higher frequencies (including 36.5 GHz Ka-band) between May 2002 and October 2011, with daily as-cending (13:30 equatorial local crossing time) and descend-ing (01:30 equatorial local crossdescend-ing time) overpasses, over a swath width of 1445 km. For this study, both ascending and descending passes are tested to select the configuration, providing the better results. We used the AMSR-E-based Land Parameter Retrieval Model (LPRM) v5 (Owe et al.,
2001, 2008) product, which is produced in collaboration be-tween the VU University Amsterdam and NASA. This prod-uct was found to provide better agreement with in-situ obser-vations than other publicly available products (e.g. Brocca et al., 2011a). LPRM is a three-parameter retrieval model (soil moisture, vegetation optical depth, and soil/canopy temper-ature) from passive microwave data based on a microwave radiative transfer model. It uses the dual polarized chan-nel (either 6.9 or 10.6 GHz) for the retrieval of both surface soil moisture and vegetation optical depth. The land surface temperature is derived separately from the vertically polar-ized 36.5 GHz channel. Here, the gridded 0.25◦soil moisture product is employed; the dataset covers the period 2002– 2011. Similarly to ASCAT, the AMSR-E-LPRM soil mois-ture product was also extensively validated (e.g. De Jeu et al., 2008; Dorigo et al., 2010; Brocca et al., 2011a).
2.3.3 Soil water index
For many applications, the knowledge of soil moisture for a very thin surface layer is not sufficient. In this study, the semi-empirical approach (also known as exponential filter) proposed by Wagner et al. (1999) is adopted to obtain a root-zone soil moisture product (SWI, Soil Water Index) from the satellite-based surface soil moisture observations. The SWI depends on a single parameter T (characteristic time length) that represents the time scale of soil moisture variation. The reader is referred to Wagner et al. (1999) and Albergel et al. (2009) for a detailed description of the exponential filter approach. Systematic differences between satellite-derived and modelled data of soil moisture prevent
an absolute agreement between the two time series. Conse-quently, in this study remotely sensed data are normalized through a linear regression fit between satellite and modelled soil moisture values, thus obtaining the SWI∗index (Brocca et al., 2011a).
3 Flood modelling
This section describes the conceptual model for the Mdouar catchment. It includes several components: the base flow, the losses, and the flow transfer towards the outlet. The mod-elling has been carried out through the Hydrologic Modeling System (HEC-HMS) software (USACE, 2010).
3.1 Base flow
A good knowledge of base flow is important to model the recession of the hydrograph and to estimate the flood volume. Here, an exponential recession base flow model was selected; this approach is adequate for basins where the flood volume is strongly influenced by rainfall events (USACE, 2010).
Bt =BiRtc, (1)
with Bi(m3s−1) being the initial discharge at the beginning
of the simulation and Rc([0–1]), the recession constant,
de-scribing the decay rate of the base flow. Two parameters need to be estimated, Rc and the threshold, Td([0-1]), being the
point in the hydrograph where total flow equals base flow; it is expressed as a proportion of the peak flow of the flood.
3.2 Losses
In this study, the Soil Conservation Service loss model (USDA-SCS, 1985) has been retained. Different versions of this model have been proposed (Michel et al., 2005); how-ever, here the classical version has been chosen for a bet-ter comparability of the results with other studies. Indeed, many studies have successfully used this model in semi-arid Mediterranean environments (e.g. Brocca et al., 2009a; Tramblay et al., 2010). Moreover, this model is suitable to account for initial soil moisture conditions through the ad-justment of the parameter S, the soil potential maximum re-tention that can be related to various indicators of soil mois-ture. In the SCS model, the cumulative excess at time t is (USACE, 2010)
Pe =
(P −0.2 S)2
P +0.8 S . (2)
Pe is the accumulated precipitation excess at time t , P the
accumulated rainfall depth at time t, and S the potential max-imum retention.
3.3 Transfer
The rainfall excess is routed to the outlet by using the Clark unit hydrograph. This method is particularly effective for
reproducing complex hydrographs in basins with variable to-pography and land use (Sabol, 1988). The Clark unit hydro-graph represents two processes: translation and attenuation (USACE, 2010). The translation is based on a synthetic time– area histogram with a time of concentration Tc(hours). The
histogram represents the watershed area contributing to flow at the outlet with time. Attenuation is modelled by a reser-voir representing the impact of basin storage, with one con-stant linear reservoir parameter, R. The average outflow of reservoir for a period t is given by
Ot =CAIt +CBOt −1, (3)
with Itthe inflow into the reservoir at time t; CA, CB, the
co-efficients calculated for each time step (1t) with the equation
CB= 1 − CA; and
CA =
1t
R +0.5 1t. (4)
3.4 Model calibration and goodness-of-fit measures
The quantitative measure of the degree of adjustment is given by the objective function, measuring the difference between an observed and simulated hydrograph. Here, the peak-weighted root mean square error (PWRMSE) was se-lected as the objective function. It has the advantage of con-sidering both the magnitude and time synchronization of the flood peak by giving more weight to values of above-average flow rates for a given event.
PWRMSE = v u u u t N P t =1
(QObs(t ) − QSim(t ))2 QObs2 Q(t ) + QA A
N . (5)
QObs is the observed flow, the QSim the simulated flow at
time step t, and QAthe mean observed discharge.
The calibration process aims to find the optimal param-eters to minimize the objective function. Here, the method of Nelder and Mead (Rao, 1978) that uses the Simplex ap-proach, was chosen to optimize the different parameters. Be-side the visual inspection of simulated hydrographs, differ-ent metrics exist to measure the ability of the rainfall–runoff model to reproduce the flood events. The Nash–Sutcliffe (NS) efficiency coefficient (Nash and Sutcliffe, 1970) was used to evaluate the agreement between the simulated and the reference runoff hydrograph. In addition, the average values of the absolute errors on the estimated peak flow and volume obtained for each event were also computed to analyze the results.
3.5 Estimators of antecedent wetness conditions
Different approaches exist in the literature to estimate the
S parameter for each flood event, either using base flow, antecedent rainfall, or soil moisture measured in situ or through satellites. In the classical SCS approach, the S-values
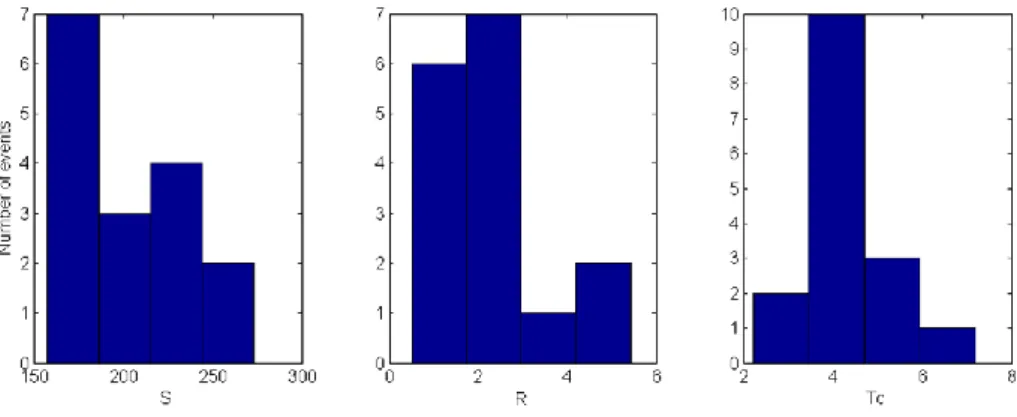
Fig. 3. Distribution of the calibrated model parameters S, R and Tc.
are modulated based on the 5-days antecedent precipitation (USDA-SCS, 1985); however, several studies have shown that, mainly for Mediterranean catchments with a strong sea-sonality of the soil moisture temporal pattern, this approach was not adequate (Brocca et al., 2009a,b; Tramblay et al., 2010). In our study the calibrated S parameter is first com-pared to different estimators of antecedent wetness condi-tions, including
1. LogQnJ: the logarithm of the mean discharge over the n previous days. Since daily discharge is routinely moni-tored at Mdouar river section, the mean runoff averaged over several days prior to a flood event is computed, with the optimal number of days selected to maximize the correlation with S.
2. API: the antecedent precipitation index (Kohler and Linsley, 1951). This index is intended to reproduce the saturation state of the basin by calculating the cumula-tive rainfall of previous days. The index of one day j is the index of the previous day j − 1 multiplied by the factor k. If rainfalls occur on day j , it is added to the index
APIj =kAPIj −1+Pj. (6)
The k parameter is here optimized to maximize the cor-relation between API and S.
3. SMA: a continuous Soil Moisture Accounting model. Here, a simplified version (without percolation) of the SMA reservoir of the GR4J model (Perrin et al., 2003) is used, following the same approach as Javelle et al. (2010). The SMA model computes the water level,
S∗/A, of the production store of maximum capacity A, by using daily rainfall depth over the Mdouar catchment interpolated from the rain gauges by inverse distance and the daily evaporation measured at the Makhazine Dam between 1984 and 2011. The complete equations are available in Perrin et al. (2003).
Successively, the ability of different remote sensing products to reproduce the simulated soil storage data, S∗/A, by the continuous SMA model is analyzed.
4 Results
4.1 Calibration of the hydrological model
The model structure detailed in the previous section is used to model the 16 available flood events in the Mdouar catch-ment (655 km2). Due to the limited number of rain gauges, precipitation was interpolated by the method of the inverse distance to compute areal rainfall over the catchment. An hourly time step was chosen, given the observed catchment response times between 2 and 4 h, depending on the event. Since the objective is to test a model suitable for operational forecasting, it is necessary to set all parameters and provide techniques for estimating the parameters that cannot be fixed to a single value for all events. Initially, the parameters are calibrated to reproduce each flood event.
The parameters for the recession model were determined by the analysis of the recession limbs of the flood hydro-graphs. They are assumed constant for every flood event, since they are dependent on the morphology of the basin. The recession constant (Rc) was set at 0.75 and the
thresh-old (Td) to 0.3. Therefore, only the initial base flow at the
beginning of each event is necessary, varying from 0.5 to 149 m3s−1 (Table 1). The parameters of the Clark hydro-graph are also determined by the basin characteristics such as size, shape and topography. The values of R and Tcwere
first calibrated for each episode, successively with different fixed S values to avoid dependencies between production and transfer model parameters. Then, the S parameter, represent-ing the deficit of water storage in the basin prior to an event, is also calibrated for each episode. Figure 3 shows the distri-bution of the optimal S, R and Tc values obtained for each
event after this calibration procedure. The median values of
R= 2.5 h and Tc= 4.1 h are suitable for most episodes, except
Table 2. Model calibration and validation results.
Total runoff Direct runoff
NS1 ErrQp2 ErrVol3 NS1 ErrQp2 ErrVol3
Calibration 0.81 0.18 0.09 0.83 0.19 0.11 Validation LogQ6J 0.66 0.27 0.19 0.68 0.29 0.26 by leave- API 0.7 0.27 0.18 0.73 0.29 0.25 one-out SMA 0.71 0.25 0.19 0.75 0.27 0.26 Median S −0.54 0.5 0.37 0.38 0.34 0.61 Validation LogQ6J 0.63 0.29 0.16 0.70 0.26 0.18 by split- API 0.63 0.28 0.16 0.76 0.24 0.22 sample SMA 0.70 0.27 0.14 0.77 0.24 0.22 Median S 0.58 0.35 0.28 0.66 0.29 0.41
1NS: mean of NS-values for each event;2ErrQp: mean of absolute values of Peak discharge error for each event; 3ErrVol: mean of absolute values of volume error for each event.
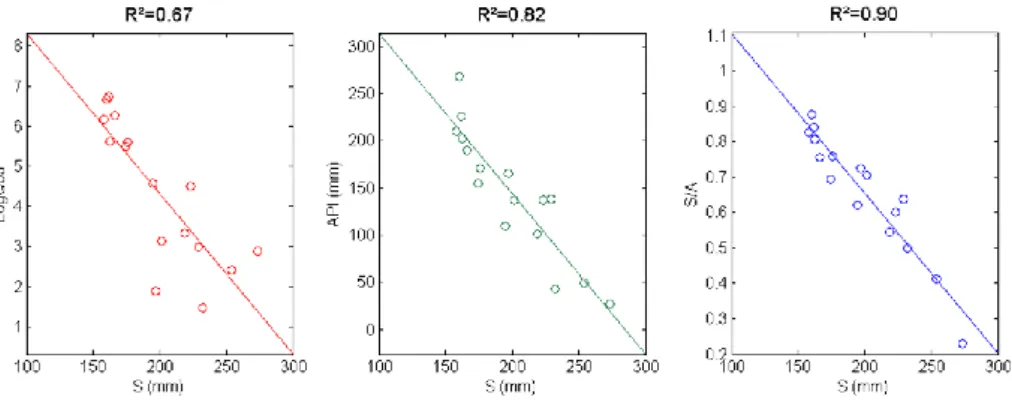
Fig. 4. Relationships between S and the antecedent wetness conditions indicators LogQ6J, API and S∗/A.
which the calibrated R-values are exceeding 4. However, for these two events the model simulations are not very sensitive to the values taken by this parameter. On the contrary, a pre-liminary analysis has shown that the flood simulations were much more sensitive to the S parameter.
The optimized values of S for each event ranged from 157.8 to 273.3 mm, indicating a wide range of initial condi-tions of soil saturation at the beginning of the events. Fig-ure 3 shows a great variability in the calibrated values of the S parameter, indicating that a single mean – or median – value of the S parameter may not be adequate for most of the events. The calibrated S parameter values have been related to the different estimators of antecedent wetness con-ditions (Fig. 4). The optimal relationship between S and the discharge of the previous days was obtained when averaging the logarithm of the discharge over 6 days prior to the flood event dates (thereafter LogQ6J), with R2= 0.67. Similarly, the optimal relationship between S and API was obtained for k = 0.98, with R2= 0.82. By comparison, if using the cu-mulative rainfall 5 days prior to the flood events, adopted in the classical formulation of the SCS-CN method, R2= 0.19.
Finally, the best relationship is obtained with the S∗/Alevel
of the SMA store for A = 218 mm, leading to a R2= 0.90. The model performance obtained with the S parameter cal-ibrated for each event is shown in Table 2, leading to a mean Nash value of 0.81. The observed and simulated flood hydro-graphs are displayed in Fig. 5. Half of the flood events have different successive peaks of discharge, caused by the long duration of rainfall events in this region. Indeed, the most important rainfall events are caused by the cyclonic activity over the Atlantic Ocean, they usually last longer than 24 h with a strong intermittency. For some events the flood peaks are underestimated most certainly because of the uncertain-ties of rainfall over the catchment; rainfall is indeed the most critical input for flood modelling (Andr´eassian et al., 2001). However, the causes for model failure may be manifold; the model structure, parameter values or stream flow measure-ments may also be blamed for low model efficiency. Despite some discrepancies, the model is able to reproduce well the flood dynamics at the hourly time step.
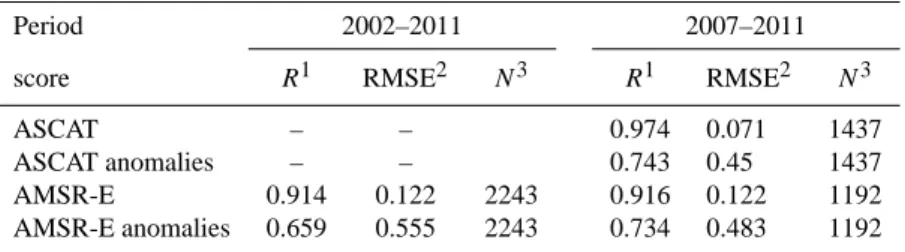
Table 3. Summary of the performance of the two satellite soil moisture products for estimating the data modelled through the SMA model.
Period 2002–2011 2007–2011
score R1 RMSE2 N3 R1 RMSE2 N3
ASCAT – – 0.974 0.071 1437
ASCAT anomalies – – 0.743 0.45 1437
AMSR-E 0.914 0.122 2243 0.916 0.122 1192
AMSR-E anomalies 0.659 0.555 2243 0.734 0.483 1192
1R: correlation coefficient,2RMSE: root mean square error,3N: sample size.
4.2 Validation of the hydrological model
The model is validated using two different approaches. Due to the limited sample size, a leave-one-out resampling pro-cedure is implemented; for the n flood events, each event i is successively removed and the relationship between S and the three different antecedent conditions estimators (LogQ6J, API and SMA) is re-estimated using the remaining n − 1 episodes. The R and Tcparameters for the event i are fixed
at the median of the R and Tcparameters calibrated for the
n −1 episodes. To provide a simple benchmark model, a
model version is introduced in which S is fixed at the me-dian optimized value of the remaining n − 1 episodes. The parameter values obtained by this procedure are then used to model the flood event i, and the simulated discharge is com-pared to the observed discharge. This approach provides in-sights into the uncertainties on many episodes, and thus eval-uates the performance that the model could have with new episodes. It must be noted that by comparison to the S pa-rameter, the R and Tcparameters vary only slightly with this
validation approach. In addition, a classical split-sample ap-proach is tested, using the 10 first events for calibration and the remaining 6 events for validation.
Results are presented in Table 2, indicating a better model performance when using the SMA model to estimate the S parameter values, with Nash coefficients of 0.71 for total runoff and 0.75 for direct runoff, using the leave-one-out pro-cedure. Similar results are obtained using a split-sample val-idation with Nash coefficients of 0.70 and 0.77, respectively, for total runoff and direct runoff. The lowest errors on peak discharge are obtained when setting S with the SMA model. When using a median S parameter, instead of estimating S from antecedent wetness conditions, the model performance for total or direct runoff is very low with negative Nash val-ues. This highlights the importance of taking into account the antecedent wetness conditions in this type of catchment.
4.3 Antecedent moisture conditions from remote sensing data
Finally, the capability of the two satellite soil moisture prod-ucts derived by ASCAT and AMSR-E sensors to reproduce the modelled soil moisture data with the SMA approach was
analyzed. In particular, the comparison was shown between the normalized SWI, SWI∗, and modelled data, considering both the relative soil moisture values and their anomalies. We note that the comparison considering the anomalies is more robust, as the strong seasonality of soil moisture could artificially produce high correlations (Albergel et al., 2009). Anomalies were computed as in Albergel et al. (2009) by considering a 5-week sliding window. For the computation of the SWI, the T parameter of the semi-empirical approach by Wagner et al. (1999) has to be estimated. It was obtained here by maximizing the correlation between satellite and mod-elled data considering the whole dataset, i.e. 2002–2011 for AMSR-E and 2007–2011 for ASCAT. The obtained T-values are found to be equal to 26 and 15 days for ASCAT and AMSR-E, respectively, in accordance with the results ob-tained by Brocca et al. (2010a) who contrasted modelled and ASCAT-derived soil moisture data for several catchments in central Italy.
Figure 6 shows the comparison between modelled, S∗/A, and satellite soil moisture data for the period 2007–2011 for which both products are available, while Table 3 summarizes all the comparisons in terms of correlation coefficient, R, and root mean square error, RMSE. As can be seen, the perfor-mance of both satellite products for the period 2007–2011 is high, with R-values equal to 0.974 and 0.916 for ASCAT and AMSR-E, respectively. Also, the comparison in terms of anomalies provide satisfactory results with R-values higher than 0.73. For AMSR-E, even when considering the whole period 2002–2011 (10-yr) the performance is still good. The good agreement between satellite and modelled data gives a clear indication for the possibility to use this data source for the estimation of the antecedent moisture conditions used in the initialization of the rainfall–runoff model. This approach could be really effective, as long-term time series of rain-fall and evaporation (needed to run the SMA model) are no longer required.
5 Conclusions and perspectives
An event-based rainfall–runoff model has been developed in a Moroccan catchment located in the north of the coun-try. The model is able to reproduce the flood events at the
Fig. 6. Comparison between modelled relative soil moisture data, S∗/A, and the two satellite soil moisture products, ASCAT and AMSR-E, for the common period 2007–2011. (a) and (c) Relative soil moisture values, and (b) and (d) soil moisture anomalies.
hourly time step, even if only a limited number of rain gauges were available. Different estimators of the antecedent wet-ness conditions of the catchment have been tested; the best results were obtained with a daily soil moisture account-ing model. In addition, two different satellite soil moisture products were tested (ASCAT and AMSR-E) and both were able to reproduce with satisfactory accuracy the daily soil moisture dynamics simulated by the SMA model. There-fore, this study demonstrates the feasibility of rainfall–runoff modelling at sub-daily timescales in northern Morocco. Due to the limited data availability, it was not possible to esti-mate directly the initial conditions of the model with satel-lite data. However, since the soil moisture accounting model showed a strong correlation with both the initial condition of the event-based model and AMSRE or ASCAT data, this shows the potential interest of remote sensing data to esti-mate the initial conditions, avoiding the use of a soil moisture accounting model that requires long time series of precipita-tion and evapotranspiraprecipita-tion. The approved continuity of the satellite missions (AMSR-E will be shortly followed up by the recently launched AMSR-2 on board GCOM-W1, while MetOp-B/ASCAT was launched in September 2012) guaran-tees that such a service can be continued operationally at least
until 2020. With the current deployment of hydrometric data transmission systems in several river basins of Morocco, this approach could be useful to set up real-time models to im-prove dam management. Several large dams are located in northwestern Morocco in catchments with similar character-istics, therefore the proposed approach is likely to be useful in this region.
If more data would be available, continuous modelling ap-proaches could also be tested to compare the simulation re-sults. The model efficiency could definitely be improved by increasing the knowledge of the rainfall amounts intercepted by the catchment during the flood events. This could be ac-complished by the installation of additional rain gauges, in particular in the most elevated areas. Another option would be to consider spatial rainfall data that could be provided by the meteorological radar recently installed in the city of Larache (50 km downstream). Also, satellite-based precipi-tation datasets such as the Tropical Rainfall Measuring Mis-sion (TRMM) Multisatellite Precipitation Analysis (TMPA), or the Precipitation Estimation from Remotely Sensed Infor-mation using Artificial Neural Network (PERSIANN) could be tested to evaluate the spatial variability during rainfall events (Hughes, 2006; Ward et al., 2011). Further studies
should focus on the applicability of such models for other catchments in a regional context, and provide guidelines for application in the case of partly gauged or ungauged catch-ments. The good relationships obtained between satellite data and modelled soil moisture provides insights for fur-ther research on different catchments in Norfur-thern Africa to palliate the lack of ground measurements for hydrological applications.
Acknowledgements. This research project has been supported by the Institut de Recherche pour le Developpement (IRD, France); the financial support provided is gratefully acknowledged. The data was provided by the department of Water Research and Planning (DRPE) in Morocco. Thanks are due to the staff of the Hydrometeorology division for their collaboration. Wouter Dorigo is partly funded by the EU-FP-7 Global Water Scarcity Information Service (GloWASIS) project (Grant Agreement No. 262255). The authors would like to thank the Handling Editor, Anas Ghadouani, and Charles Perrin, Pierre Javelle, and Philipp Meier for their useful reviews.
Edited by: A. Ghadouani
The publication of this article is financed by CNRS-INSU.
References
Albergel, C., R¨udiger, C., Carrer, D., Calvet, J.-C., Fritz, N., Naeimi, V., Bartalis, Z., and Hasenauer, S.: An evaluation of ASCAT surface soil moisture products with in-situ observations in Southwestern France, Hydrol. Earth Syst. Sci., 13, 115–124, doi:10.5194/hess-13-115-2009, 2009.
Amri, R., Zribi, M., Chabaane, Z. L., Wagner, W., and Hasenauer, S.: Analysis of C-band scatterometer moisture estimations de-rived over a semiarid region, IEEE T. Geosci. Remote, 50, 2630– 2638, 2012.
Andr´eassian, V., Perrin, C., Michel, C., Usart-Sanchez, I., and Lavabre, J.: Impact of imperfect rainfall knowledge on the effi-ciency and the parameters of watershed models, J. Hydrol., 250, 206–223, 2001.
Beck, H. E., de Jeu, R. A. M., Schellekens, J., van Dijk, A. I. J. M., and Bruijnzeel, L. A.: Improving Curve Number Based Storm Runoff Estimates Using Soil Moisture Proxies, IEEE J. Select. Top. Appl. Earth, 2, 250–259, 2009.
Berthet, L., Andr´eassian, V., Perrin, C., and Javelle, P.: How cru-cial is it to account for the antecedent moisture conditions in flood forecasting? Comparison of event-based and continuous approaches on 178 catchments, Hydrol. Earth Syst. Sci., 13, 819– 831, doi:10.5194/hess-13-819-2009, 2009.
Bouaicha, R. and Benabdelfadel, A.: Variabilit´e et gestion des eaux de surface au Maroc, S´echeresse, 21, 1–5, 2010.
Brocca, L., Melone, F., Moramarco, T., and Singh, V. P.: Assimila-tion of observed soil moisture data in storm rainfall–runoff mod-elling, J. Hydrol. Eng.-ASCE, 14, 153–165, 2009a.
Brocca, L., Melone, F., Moramarco, T., and Morbidelli, R.: An-tecedent wetness conditions based on ERS scatterometer data, J. Hydrol., 364, 73–87, 2009b.
Brocca, L., Melone, F., Moramarco, T., Wagner, W., Naeimi, V., Bartalis, Z., and Hasenauer, S.: Improving runoff prediction through the assimilation of the ASCAT soil moisture product, Hydrol. Earth Syst. Sci., 14, 1881–1893, doi:10.5194/hess-14-1881-2010, 2010a.
Brocca, L., Melone, F., Moramarco, T., Wagner, W., and Hasenauer, S.: ASCAT Soil Wetness Index validation through in-situ and modeled soil moisture data in central Italy, Remote Sens. Env-iron., 114, 2745–2755, 2010b.
Brocca, L., Hasenauer, S., Lacava, T., Melone, F., Moramarco, T., Wagner, W., Dorigo, W., Matgen, P., Mart´ınez-Fern´andez, J., Llorens, P., Latron, J., Martin, C., and Bittelli, M.: Soil mois-ture estimation through ASCAT and AMSR-E sensors: an inter-comparison and validation study across Europe, Remote Sens. Environ., 115, 3390–3408, 2011a.
Brocca, L., Melone, F., and Moramarco, T.: Distributed rainfall– runoff modeling for flood frequency estimation and flood fore-casting, Hydrol. Process., 25, 2801–2813, 2011b.
Brocca, L., Moramarco, T., Melone, F., Wagner, W., Hasenauer, S., and Hahn, S.: Assimilation of Surface- and Root-Zone ASCAT Soil Moisture Products Into Rainfall–Runoff Modeling, IEEE T. Geosci. Remote, 50, 2542–2555, 2012.
Castillo, V. M., Gomez-Plaza, A., and Martinez-Mena, M.: The role of antecedent soil water content in the runoff response of semi-arid catchments: a simulation approach, J. Hydrol., 284, 114– 130, 2003.
Coustau, M., Bouvier, C., Borrell-Estupina, V., and Jourde, H.: Flood modelling with a distributed event-based parsimo-nious rainfall–runoff model: case of the karstic Lez river catchment, Nat. Hazards Earth Syst. Sci., 12, 1119–1133, doi:10.5194/nhess-12-1119-2012, 2012.
De Jeu, R. A. M., Wagner, W., Holmes, T. R. H., Dolman, A. J., Van De Giesen, N. C., and Friesen, J.: Global Soil Moisture Patterns Observed by Space Borne Microwave Radiometers and Scatterometers, Surv. Geophys., 29, 399–420, 2008.
Dorigo, W. A., Scipal, K., Parinussa, R. M., Liu, Y. Y., Wagner, W., de Jeu, R. A. M., and Naeimi, V.: Error characterisation of global active and passive microwave soil moisture datasets, Hy-drol. Earth Syst. Sci., 14, 2605–2616, doi:10.5194/hess-14-2605-2010, 2010.
Gruhier, C., de Rosnay, P., Kerr, Y., Mougin, E., Ceschia, E., Calvet, J.-C., and Richaume, P.: Evaluation of AMSR-E soil moisture product based on ground measurements over temper-ate and semi-arid regions, Geophys. Res. Lett., 35, L10405, doi:10.1029/2008GL033330, 2008.
Huang, M., Gallichand, J., Dong, C., Wang, Z., and Shao, M.: Use of soil moisture data and curve number method for estimating runoff in the Loess Plateau of China, Hydrol. Process., 21, 1471– 1481, 2007.
Hughes, D. A.: Comparison of satellite rainfall data with observa-tions from gauging station networksm J. Hydrol., 327, 399–410, 2006.
Hugues, D. A.: Regionalization of models for operational purposes in developing countries: an introduction, Hydrol. Res., 42, 331– 337, 2011.
Javelle, P., Fouchier, C., Arnaud, P., and Lavabre, J.: Flash flood warning at ungauged locations using radar rainfall and an-tecedent soil moisture estimations, J. Hydrol., 397, 267–274, 2010.
Kohler, M. A. and Linsley, R. K.: Predicting Runoff from Storm Rainfall, Res. Paper 34, US Weather Bureau, Washington, DC, 1951.
Llasat, M. C., Llasat-Botija, M., Prat, M. A., Porc´u, F., Price, C., Mugnai, A., Lagouvardos, K., Kotroni, V., Katsanos, D., Michaelides, S., Yair, Y., Savvidou, K., and Nicolaides, K.: High-impact floods and flash floods in Mediterranean coun-tries: the FLASH preliminary database, Adv. Geosci., 23, 47–55, doi:10.5194/adgeo-23-47-2010, 2010.
Matgen, P., Fenicia, F., Heitz, S., Plaza, D., de Keyser, R., Pauwels, V. R. N., Wagner, W., and Savenije, H.: Can ASCAT-derived soil wetness indices reduce predictive uncertainty in well-gauged ar-eas? A comparison with in-situ soil moisture gauges in an assim-ilation application, Adv. Water Resour., 44, 49–65, 2012. Meier, P., Fr¨omelt, A., and Kinzelbach, W.: Hydrological real-time
modelling in the Zambezi river basin using satellite-based soil moisture and rainfall data, Hydrol. Earth Syst. Sci., 15, 999– 1008, doi:10.5194/hess-15-999-2011, 2011.
Michel, C., Andr´eassian, V., and Perrin, C.: Soil Conservation Ser-vice Curve Number method: How to mend a wrong soil mois-ture accounting procedure?, Water Ressour. Res., 41, W02011, doi:10.1029/2004WR003191, 2005.
Mishra, S. K. and Singh, V. P.: Soil conservation service curve num-ber (SCS-CN) methodology, Kluwer, Dordrecht, The Nether-lands, 2003.
Nash, J. E. and Sutcliffe, J. V.: River flow forecasting through con-ceptual models part I: a discussion of principles, J. Hydrol., 10, 282–290, 1970.
Norbiato, D., Borga, M., Degli Esposti, S., Gaume, E., and An-quetin, S.: Flash flood warning based on rainfall depth-duration thresholds and soil moisture conditions: an assessment for gauged and ungauged basins, J. Hydrol., 362, 274–290, 2008. Owe, M., De Jeu, R. A. M., and Walker, J.: A methodology for
surface soil moisture and vegetation optical depth retrieval us-ing the microwave polarization difference index, IEEE T. Geosci. Remote., 39, 1643–1654, 2001.
Owe, M., De Jeu, R. A. M., and Holmes, T. R. H.: Multi-Sensor Historical Climatology of Satellite-Derived Global Land Surface Moisture, J. Geophys. Res., 113, F01002, doi:1029/2007JF000769, 2008.
Parrens, M., Zakharova, E., Lafont, S., Calvet, J.-C., Kerr, Y., Wag-ner, W., and Wigneron, J.-P.: Comparing soil moisture retrievals from SMOS and ASCAT over France, Hydrol. Earth Syst. Sci., 16, 423–440, doi:10.5194/hess-16-423-2012, 2012.
Perrin, C., Michel, C., and Andr´eassian, V.: Improvement of a parsi-monious model for streamflow simulation, J. Hydrol., 279, 275– 289, 2003.
Rao, S. S.: Optimization – Theory and applications, Wiley Eastern Limited, India, p. 747, 1978.
Rodr´ıguez-Blanco, M. L., Castro, M. M., and Taboada-Castro, M. T.: Rainfall–runoff response and event-based runoff coefficients in a humid area (northwest Spain), Hydrolog. Sci. J., 57, 1–15, 2012.
Sabol, G. V.: Clark Unit Hydrograph and r-parameter estimation, J. Hydraul. Eng., 114, 103–111, 1988.
Sinclair, S. and Pegram, G. G. S.: A comparison of ASCAT and modelled soil moisture over South Africa, using TOPKAPI in land surface mode, Hydrol. Earth Syst. Sci., 14, 613–626, doi:10.5194/hess-14-613-2010, 2010.
Tramblay, Y., Bouvier, C., Martin, C., Didon-Lescot, J.-F., Todor-ovik, D., and Domergue, J.-M.: Assessment of initial soil mois-ture conditions for event-based rainfall–runoff modeling, J. Hy-drol. 387, 176–187, 2010.
Tramblay, Y., Bouvier, C., Ayral, P.-A., and Marchandise, A.: Im-pact of rainfall spatial distribution on rainfall–runoff modelling efficiency and initial soil moisture conditions estimation, Nat. Hazards Earth Syst. Sci., 11, 157–170, doi:10.5194/nhess-11-157-2011, 2011.
Tramblay, Y., Badi, W., Driouech, F., El Adlouni, S., Neppel, L., and Servat, E.: Climate change impacts on extreme precipitation in Morocco, Global Planet. Change, 82–83, 104–114, 2012. USACE: Hydrologic Modeling System HEC-HMS, Technical
ref-erence manual version 3.5, US Army Corps of Engineers, Hy-drologic Engineering center, Davis, USA, 2010.
USDA-SCS: National Engineering Handbook, Section 4, Hydrol-ogy, Washington, DC, USA, 1985.
Wagener, T., Gupta, H., Yatheendradas, S., Goodrich, D., Un-krich, C., and Shaffner, M.: Understanding sources of uncertainty in flash-flood forecasting for semi-arid regions, Proceedings of Symposium HS2004 at IUGG2007, IAHS Publ. 313, Perugia, Italy, 2007.
Wagner, W., Lemoine, G., and Rott, H.: A method for estimat-ing soil moisture from ERS scatterometer and soil data, Remote Sens. Environ., 70, 191–207, 1999.
Ward, E., Buytaert, W., Peaver, L., and Wheater, H.: Evaluation of precipitation products over complex mountainous terrain: A wa-ter resources perspective, Adv. Wawa-ter Resour., 34, 1222–1231, 2011.