Publisher’s version / Version de l'éditeur:
Vous avez des questions? Nous pouvons vous aider. Pour communiquer directement avec un auteur, consultez la première page de la revue dans laquelle son article a été publié afin de trouver ses coordonnées. Si vous n’arrivez pas à les repérer, communiquez avec nous à PublicationsArchive-ArchivesPublications@nrc-cnrc.gc.ca.
Questions? Contact the NRC Publications Archive team at
PublicationsArchive-ArchivesPublications@nrc-cnrc.gc.ca. If you wish to email the authors directly, please see the first page of the publication for their contact information.
https://publications-cnrc.canada.ca/fra/droits
L’accès à ce site Web et l’utilisation de son contenu sont assujettis aux conditions présentées dans le site LISEZ CES CONDITIONS ATTENTIVEMENT AVANT D’UTILISER CE SITE WEB.
Photonics North 2011, pp. 1-7, 2011-08-31
READ THESE TERMS AND CONDITIONS CAREFULLY BEFORE USING THIS WEBSITE.
https://nrc-publications.canada.ca/eng/copyright
NRC Publications Archive Record / Notice des Archives des publications du CNRC :
https://nrc-publications.canada.ca/eng/view/object/?id=15949a67-c030-45ad-a5d2-dd8542afeb87 https://publications-cnrc.canada.ca/fra/voir/objet/?id=15949a67-c030-45ad-a5d2-dd8542afeb87
NRC Publications Archive
Archives des publications du CNRC
This publication could be one of several versions: author’s original, accepted manuscript or the publisher’s version. / La version de cette publication peut être l’une des suivantes : la version prépublication de l’auteur, la version acceptée du manuscrit ou la version de l’éditeur.
For the publisher’s version, please access the DOI link below./ Pour consulter la version de l’éditeur, utilisez le lien DOI ci-dessous.
https://doi.org/10.1117/12.902617
Access and use of this website and the material on it are subject to the Terms and Conditions set forth at
Simultaneous 1310/1550 dual-band swept laser source and fiber-based
dual-band common-path swept source optical coherence tomography
Simultaneous 1310/1550 Dual-Band Swept Laser Source and
Fiber-Based Dual-band Common-Path
Swept Source Optical Coherence Tomography
Youxin Mao, Shoude Chang, Erroll Murdock, and Costel Flueraru
Institute for Microstructural Sciences, National Research Council Canada,
1200 Montreal Rd, Ottawa, K1A 0R6, ON, Canada
ABSTRACTA simultaneous two wavelength band swept laser source and a fiber-based dual-band common-path swept source optical coherence tomography is reported. Simultaneous 1310/1550 dual-wavelength tuning is performed by using two fiber-ring cavities with corresponding optical semiconductor amplifier as their gain mediums and two narrowband optical filters with a single dual-window polygonal scanner. Measured average output powers of 60 mW and 27 mW have been achieved for 1310 and 1550 nm bands, respectively, while the two wavelengths were swept simultaneously from 1227 nm to 1387 nm for 1310 nm band and from 1519 nm to 1581 nm for 1550 nm band at an A-scan rate of 65 kHz. A broadband 1310/1550 wavelength-division multiplexing is used for coupling two wavelengths into a common-path single-mode GRIN-lensed fiber probe to form a dual-band common-path swept-source optical coherence tomography. Simultaneous OCT imaging at 1310 and 1550 nm is achieved by using a depth ratio correction method. This technique allows potentially for in vivo endoscopic high-speed functional OCT imaging with high quality spectroscopic contrast with low computational costs. On the other hand, the common path configuration is able to reject common mode noise and potentially implement high stability quantitative phase measurements.
Keywords: wavelength swept source, optical coherence tomography, simultaneous dual-band swept laser source, simultaneous dual-band swept source optical coherence tomography, common-path, biomedical imaging.
1. INTRODUCTION
Optical Coherence Tomography (OCT) [1] is an emerging non-invasive cross-sectional imaging modality for visualizing tissue details in vivo at resolutions approaching histology. Because OCT uses light, with different fromother existing imaging techniques such as ultrasound, a variety of functional and spectroscopic techniques are available to expand its capabilities, including polarization, absorption, elastography, Doppler, and dispersion analysis [2]. In terms of improving the classification of different tissue types and pathology, the analysis of spectroscopic properties has shown to be a simple and powerful tool for achieving additional imaging contrast [3]. The conventional methods of extraction spectroscopic information are computational expensive and reply on the wavelength dependency of the scattering and absorption coefficients within one wavelength band only [4-7]. Simultaneously imaging at two distinct spectral regions has been demonstrated by time-domain [8], full-field [9], and spectral-domain [10] OCT. However, limitations of their slow imaging speed and/or free-space optical probing configuration restrict them in many real-time, in vivo, and endoscopic applications.
Swept-source OCT (SS-OCT) [11] has received much attention in recent years not only because of its higher SNR at high imaging speeds but also for its imaging possibilities in the longer wavelength range, where the reduced light scattering by tissue enables OCT to collect signal from deeper structure compared to OCT imaging based on shorter source wavelengths. With advantage of the balanced detection and high-speed swept source, SS-OCT can offer higher imaging speeds and SNR by comparing to spectrometer based SD-OCT system. Two appropriate wavelength swept laser sources have been demonstrated based on the polygonal mirror filter [11] and piezo-tunable Fabry-Perot (FP) filter [12]. In the polygonal mirror scheme, the angular wavelength dispersion resulting from a diffraction grating was directed to match the facet size and angular sweep of the high-speed polygon scanner with [13] and without [14] a telescope. * Linda.mao@nrc-cnrc.gc.ca; phone 1 613 993-7331; fax 1 613 954 3338; http://ims-ism.nrc-cnrc.gc.ca/
In the piezo-tunable FP filter scheme, resonant operation of the filter results in high-speed turning with a sinusoidal and bidirectional scan. In comparison, the high-power unidirectional linear wavelength sweeps generated by the polygonal mirror scheme are more favorable for OCT imaging applications than that generated by the piezo-tunable FP filter. Both swept sources published so far, based on our knowledge, produce sweeping in only a single wavelength band.
In this paper, we report a simultaneous two wavelength bands swept laser source and fiber-based dual-band common-path swept source optical coherence tomography imaging. Simultaneous 1310/1550 dual-wavelength tuning is performed by using two fiber-ring cavities with corresponding optical semiconductor amplifier as their gain mediums and two narrowband optical filters using a single dual-window polygonal scanner. The measured average output power of 60 mW and 25 mW have been achieved in 1310 and 1550 nm bands, respectively, while the two wavelengths were swept simultaneously from 1235 nm to 1395 nm for 1310nm band and from 1520 nm to 1580 nm for 1550 nm band. A broadband wavelength-division multiplexing is used for coupling 1310/1550 two bands to a common-path interferometer with a single fiber probe. Simultaneous OCT imaging at 1310 and 1550 nm at an A-scan rate up to 65 kHz is demonstrated. This technique allows potentially for in vivo high-speed functional OCT imaging with high quality spectroscopic contrast. In the other hand, the common path configuration is able to reject common mode noise and potentially implement high stability quantitative phase measurement [15].
2. METHOD
2.1. Fiber-based high-speed and high-power simultaneous dual-band swept laser source
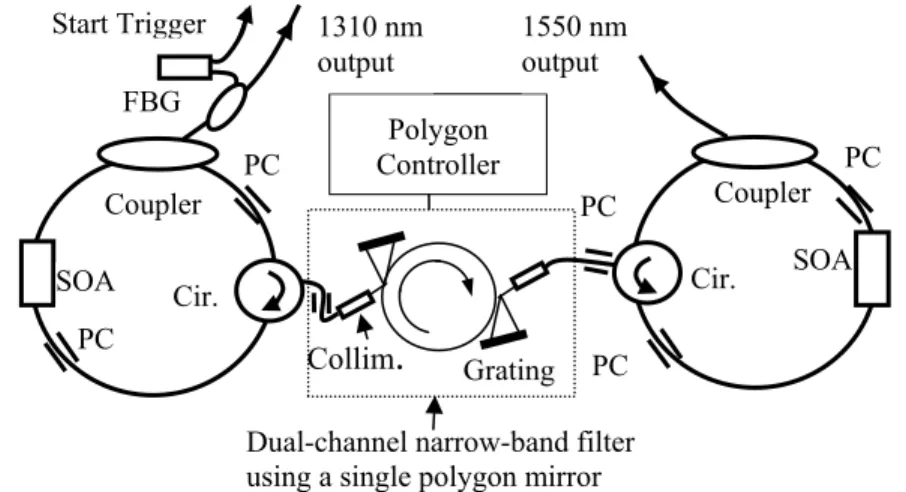
Fig. 1. Schematic diagram of the dual-band swept laser source. Cir: circulator, SOA: semiconductor optical amplifier, PC: polarization controllers, FBG: fiber Bragg grating.
The schematic of 1310/1550 dual-band swept laser is presented in Fig. 1. The dual-band swept source comprises of two extended ring cavity semiconductor lasers and two high-speed optical narrow-band intra-cavity wavelength-scanning filters with a single high-speed polygonal scanner. Tuning of the laser with two wavelength bands is accomplished by spinning the polygon with two opened windows, enabling synchronized sweeping of two wavelength bands. Two broadband optical semiconductor amplifiers (SOA) at 1310 nm (Covega, BOA1132) and at 1550 nm (Covega, BOA1004SXL) central wavelengths were used as the cavity gain medium. A customized two-window 72-facet polygon scanner with four adjustable repetition rates (SA34, Lincoln Laser) was employed. The maximum repetition rate of the polygon filter is 65 kHz. For increasing free spectral range (FSR) of the polygonal narrowband filter, Littrow configurations were utilized for both bands. The reflected light from the polygon scanner facets illuminate the diffraction gratings at Littrow’s angle and retrace the path back to the collimators. Two complete wavelength sweeps are produced simultaneously for each partial rotation of the polygon through an angle of 2π/N in the two windows, where N (=72) is the number of mirror facets. The sweeping angles of the reflected light for the two bands double the polygon’s rotation
Grating Dual-channel narrow-band filter using a single polygon mirror Cir. Coupler Collim
.
FBG Polygon Controller PC PC PC Coupler Cir. PC PC SOA SOA 1310 nm output 1550 nm output Start Triggerangle. Two Newport gratings (33009BK02-540R and 53015BK01-530R) with the same groove frequency (T) of 1200 lines/mm were used in the filter for the 1310 and 1550 nm bands respectively. The calculated Littrow’s angles (θlitt) are 52 and 68 degrees at the center wavelength of 1310 and 1550 nm, respectively. The two diffraction gratings are placed close to their polygon scanner facets to decrease beam displacement on the diffraction gratings and reduce the cavity lengths. Three in-line miniature polarization controllers (PC) were placed before the SOA, fiber circulator and grating in both cavities for individually aligning their polarization states. The in-line miniature PC can reduce further cavity lengths. About 1.5 meter of cavity lengths were obtained for both bands. An output coupler with a 60/40 ratio was used (60% of the power is coupled out) for both cavities. 10% output power of 1310nm band was connected to a fiber Bragg grating (FBG) for a swept laser start trigger [13].
2.2. Fiber-based simultaneous dual-band common-path swept-source optical coherence tomography
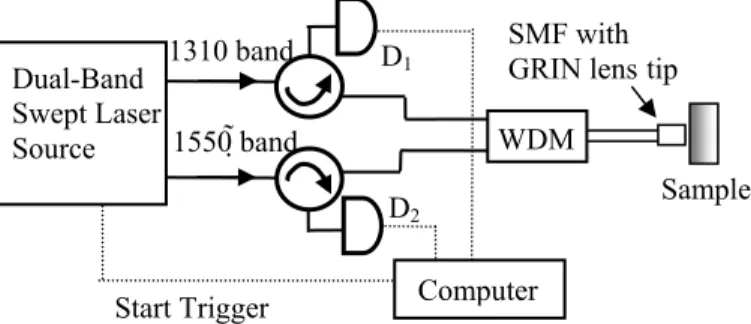
Fig. 2. Schematic diagram of our fiber-based dual-band common-path SS-OCT system. D: detector. WDM: wavelength division multiplex. Solid and dotted line: optical and electronic paths, respectively
Fig. 2 shows setup of the fiber-based dual-band common-path swept-source optical coherence tomography system. The simultaneous swept laser outputs of 1310 and 1550 nm bands are connected to two matched optical circulators. The appropriate output is then connected to a broadband 1310/1550 WDM outputting into a single-mode optical fiber (SMF). The SMF is fusion-spliced with a GRIN fiber lens [16]. The light reflected from the glass-air surface of the GRIN lens is used as reference reflection, which is combined with light reflected from inside the sample to form a common-path configuration. This common-path interferometer can pass both bands of light, this not only overcomes the difficulty of bandwidth limitation in fiber circulators used in conventional fiber-based OCT systems, but also gives highly stable quantitative phase measurements [15]. The GRIN lens used in this work has a diameter of 0.14 mm with a beam profile: working distance of 0.7 mm, depth of field of 0.4 mm, and 1/e2 spot diameter, e.g. lateral OCT image resolution, of 19 μm. Detector (PDB120C, Thorlabs) outputs of each wavelength band are digitized using a two channels data acquisition card (DAQ) (ATS 9440, Alazartech, Montreal) with 14-bit resolution and sampling speed of 100 MS/s. The start trigger signal is used to initiate the function generator for the galvo scanner and initiate the data acquisition process for each A-scan. K-linear sampling is implemented by using pre-calibrated tables for each wavelength. Encoded color images with the dual-band wavelength are processed using a method of depth ratio correction after inverse Fourier transformation (IFT). The method of depth ratio correction will be described in the following section.
3. RESULTS and DISCUSSIONS
Normalized spectrum emitted from our dual-band swept laser, measured using an optical spectrum analyzer (OSA) in peak-hold mode with a resolution of 1 nm, is shown in Fig. 3 (a). Full sweeping wavelength ranges of 160 and 62 nm centered at 1307 and 1550 nm for the two bands were obtained, respectively, The FSR of the Littrow configuration used in our filter setup are given in the following equations by assuming there is no beam clipping [14]:
)
cos(
4
1
2
littN
T
FSR
=
⋅
⋅
π
⋅
θ
(1) Sample 1310 band 1550 band Start Trigger SMF with GRIN lenstip WDM Dual-Band Swept Laser Source Computer D1 D2FSR of 179 and 109 nm are calculated at the center wavelength of 1310 and 1550nm in our setup, which respectively
correspond to the maximum wavelength sweeping ranges for the two bands. Measured full sweeping wavelengths of 160 and 62 nm are 91 % and 51 % of the theoretical FSR values for the two respective central wavelengths. The FWHM bandwidth of 121 and 47 nm would respectively correspond to 6.2 and 22.5 μm OCT axial resolutions in air for 1310 and 1550 bands.
(a) (b) (c)
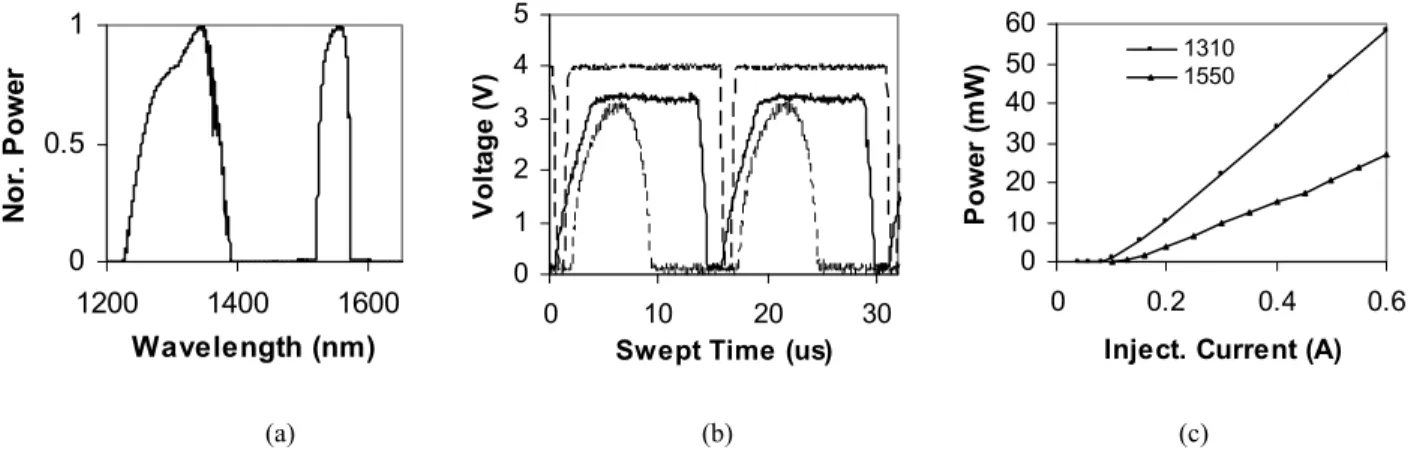
Fig.3 Measured normalized dual-band spectrum (a), oscilloscope traces (1550 band: solid-line and 1310 band: dotted-line) with start trigger (dashed-line) at a repetition rate of 65.19 kHz (b), and output powers versus injection current of the SOA (c) of our dual-band swept laser.
Fig. 3 (b) shows the measured related output power of our dual-band swept laser over two wavelength scans using an oscilloscope. The observed scan duration of 15.34 us corresponds to a repetition rate of 65.19 kHz. The duty cycles of 91% and 51% for the 1310 and 1550 bands, respectively, match their percentages of the theoretical FSR values. The lower duty cycles at the 1550 band could be caused by the beam clipping on the polygon facet and/or the lower efficiency of the grating at the longer wavelength near 1600nm. Better managing of the beam size of the collimator and/or using of a high efficient Holographic grating (Newport, 33009FL02-544H) may overcome this issue. Fig. 3 (c) shows output power versus the injection current of the SOA. Measured average output powers of 60.2 and 26.9 mW were obtained in the 1310 and 1550 nm bands, respectively, at an injective current of 0.6 A on both SOA. The laser threshold currents were 80 and 130 mA for the 1310 and 1550 bands, respectively.
In an optical coherence tomography system, bandwidth (Δf) of the interference signal frequency corresponding to optical source properties (i.e. central wavelength λ0 and bandwidth Δλ) at a certain image depth (z) is given [2]:
A
f
z
f
=
Δ
⋅
⋅
Δ
2 02
λ
λ
(2)where, fA is A-scan frequency. From Eq. (2), the interference signal frequency will be difference at the different central wavelengths. It will induce the different image pixel scales when the optical source used in the different central wavelengths which caused by the inverse Fourier transformation. Therefore, the ratio of the image pixel scales at the two central wavelengths will equal to the ratio of the signal frequency bandwidth.
Fig. 4 (a) shows the waveforms of the interference signals at 1310 nm shown in a solid line and at 1550 nm shown in a dashed line measured when put a mirror at 100 μm distance away from the end surface of the GRIN fiber probe in our dual-band common-path SS-OCT system. The ratio of the signal frequency bandwidth at 1310 and 1550 nm of 2.46 is obtained measured from Fig. 4 (a). Fig.4 (b) shows normalized point-spread functions (PSF) at 1310 nm (solid line) and at 1550 nm (dashed line) obtained by inverse Fourier transformations of interference signals without any depth corrections. The ratio of the peak pixels of the two wavelengths is equal to 2.46 as well, which agreed with above theory. After the depth ratio correction, e.g. dividing the pixel of 1310 nm by 2.46 and converting the pixel to distance for both
0 1 2 3 4 5 0 10 20 30
Swept Time (us)
V o lt ag e ( V ) 0 10 20 30 40 50 60 0 0.2 0.4 0.6
Inject. Current (A)
Po w e r ( m W ) 13101550 0 0.5 1 1200 1400 1600 Wavelength (nm) No r. P o w e r
wavelength, the normalized point-spread functions at 1310 nm (solid line) and at 1550 nm (dashed line) are shown in Fig. 4 (c). By using the same method to the all acquired A-scan data, encoded color images in the same scale with the different wavelengths can be obtained. The tissue structures with high quality spectroscopic contrast with different wavelength can be visualized directly without high computational costs.
(a) (b) (c) (d)
Fig. 4. (a) Measured interference signals at 1310 nm (solid line) and 1550 nm (dashed line) when put a mirror at 100 μm distance from the end surface of the GRIN fiber probe. (b) Normalized point-spread functions at 1310 nm (solid line) and at 1550 nm (dashed line) obtained after inverse Fourier transformations of interference signals without any depth ratio correction. (c) Normalized point-spread functions at 1310 nm (solid line) and at 1550 nm (dashed line) after depth ratio correction. (d) Normalized point-spread functions shown the FWHM bandwidth at 1310 nm (solid line) and at 1550 nm (dashed line).
Fig. 4 (d) shows thenormalized point-spread functions indicating the full width half maximum (FWHM) bandwidth at 1310 nm (solid line) and at 1550 nm (dashed line). Measured FWHM of 9 and 19 μm at 1310 and 1550 nm central wavelength, respectively, are obtained, which correspond the axial resolutions of the OCT system for the two wavelengths. The higher FWHM bandwidths of PSF measured at 1310 nm wavelength band in comparison with that calculated from the FWHM swept source bandwidth (6.2 μm) could be caused by the limitation of the bandwidth of the low-cost fiber fused WDM used in the system. A well designed high quality high cost WDM made by thin-film filter could improve the resolutions at the wavelength band.
4. DUAL-BAND IMAGINGS
Application of our technique to biological imaging is demonstrated in Fig. 5. Fig. 5 (a) and (b) show in vivo OCT images (2.5mm
×
1.7 mm) of human finger acquired from our fiber-based simultaneous dual-band SS-OCT system processing at individual center wavelength of 1310 nm and 1550 nm, respectively. Higher axial resolution in the image at 1310 nm is0 0.2 0.4 0.6 0.8 1 0 50 100 150 Depth (pixel) N o r. In te n s it y 1300nm 1550nm 0 0.2 0.4 0.6 0.8 1 0 500 1000 Pixel Vo lt a g e ( V ) 1300nm1550nm 0 0.5 1 0.08 0.1 0.12 0.14 Depth (mm) N o r. In te n s it y 9μm 19μm 0 0.2 0.4 0.6 0.8 1 0 0.1 0.2 0.3 0.4 0.5 Depth (mm) N o r. In te n s it y 1300nm 1550nm
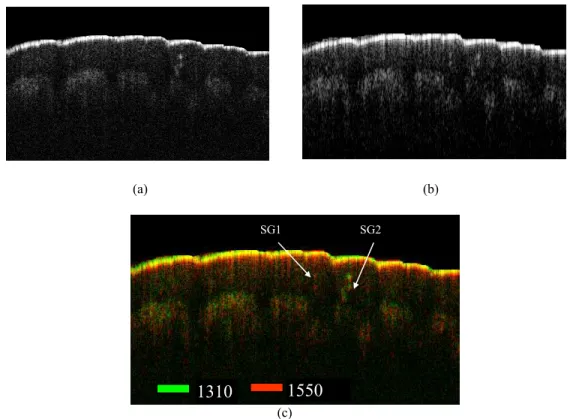
visualized in comparison with that at 1550 nm wavelength band. The penetration depth of image at 1550nm is slight larger than that at 1310 nm although the water absorption at 1550nm wavelength is higher than that at 1310 nm wavelength. Fig. 5 (c) shows the color encoded OCT image of the human finger processed using the depth ratio correction method described above in this paper at 1310 (green) and 1550 nm (red) center wavelengths. The two sweat glands in epidermis layer as shown in SG1 and SG2 in Fig. 5 (c) have different dispersion properties. SG1 is only discovered in the 1550 nm band, and SG2 is shifted at the two center wavelengths. The different dispersion property between the 1310nm and 1550 nm bands of sweat gland ducts could be caused by the local water amount, collagen and muscles.
(a) (b)
(c)
Fig 5. In vivo OCT images (2.5mm×1.7 mm) of human finger acquired from our fiber-based simultaneous dual-band SS-OCT system processed at individual center wavelength of 1310 nm (a) and 1550 nm (b). Color encoded OCT image of the human finger processed by the depth ratio correction method at 1310 (green) and 1550 nm (red) center wavelengths. SD: sweat gland.
4. CONCLUSION
A high-speed and high-power simultaneous dual-wavelength-band swept laser source based on a single two-window polygon filter was demonstrated. A dual-band common-path swept source optical coherence tomography system was implemented. Simultaneous 1310/1550 dual-wavelength tuning is performed by using two fiber-ring cavities with corresponding optical semiconductor amplifier as their gain mediums and two narrowband optical filters using a single dual-window polygonal scanner. The measured average output power up to 60 mW and 25 mW have been achieved in 1310 and 1550 nm bands, respectively, while the two full swept wavelength ranges are 160 nm and 62 nm for 1310nm band and 1550 nm band, respectively. A broadband wavelength-division multiplexing is used for coupling 1310/1550 two bands to a common-path interferometer with a single fiber probe. Simultaneous OCT imaging of human finger at 1310 and 1550 nm at an A-scan rate up to 65 kHz is demonstrated. Our novel method allows potentially for instantaneous high-quality OCT spectroscopic analysis and stable phase measurements in simultaneous two wavelength bands. By using an ultra-small fiber probe, this technique allows for in vivo endoscope and interstitial noninvasive diagnostics with potential application in functional (spectroscopic) investigations.
1310
1550
REFERENCE
1. D. Huang, E. A. Swanson, C. P. Lin, J. S. Schuman, W. G. Stinson, W. Chang, M. R. Hee, T. Flotte, K. Gregory, C. A. Puliafito, and J. G. Fujimoto, "Optical coherence tomography", Science 254, 1178-1181 (1991). 2. W. Drexler and J. Fujimoto, Optical Coherence Tomography: Technology and application (Springer, 2008). 3. U. Morgner, W. Drexler, F. X. K¨artner, X. D. Li, C. Pitris, E. P. Ippen, and J. G. Fujimoto, “Spectroscopic
optical coherence tomography”, Opt. Lett., 25, 111 (2000). D. Adler, T. Ko, P. Herz, and J. Fujimoto, Opt. Express 12, 5487 -5501 (2004).
4. D. Adler, T. Ko, P. Herz, and J. Fujimoto, “Optical coherence tomography contrast enhancement using spectroscopic analysis with spectral autocorrelation” Opt. Express 12, 5487 -5501 (2004).
5. C. Xu, P. Carney, and S. Boppart, “Wavelength-dependent scattering in spectroscopic optical coherence tomography”, Opt. Express 13, 5450-5462 (2005).
6. A. Dubois, J. Moreau, and C. Boccara, “Spectroscopic ultrahigh-resolution full-field optical coherence microscopy”, Opt. Express 16, 17082-17091 (2008).
7. R. Leitgeb, M. Wojtkowski, A. Kowalczyk, C. K. Hitzenberger, M. Sticker, and A. F. Fercher, “Spectral measurement of absorption by spectroscopic frequency-domain optical coherence tomography“, Opt. Lett. 25, 820-822 (2000).
8. F. Spöler, S. Kray, P. Grychtol, B. Hermes, J. Bornemann, M. Först, and H. Kurz, “Simultaneous dual-band ultra-high resolution optical coherence tomography“, Opt. Express 15, 10832-10841 (2007).
9. D. Sacchet, J. Moreau, P. Georges, and A. Dubois, “Simultaneous dual-band ultra-high resolution full-field optical coherence tomography” Opt Express 16, 19434 (2008).
10. S. Kray, F.Spöler, M. Först, and H. Kurz, ‚“ High-resolution simultaneous dual-band spectral domain optical coherence tomography“,Opt. Lett. 34, 1970 (2009).
11. S.H. Yun, G.J. Tearney,J.F. de Boer, N. Iftimia, and B.E. Bouma, “High-speed optical frequency-domain imaging”, Opt. Exp. 11, 2953-2963 (2003).
12. R. Huber, M. Wojtkowski, J.G. Fujimoto, J.Y. Jiang, and A.E. Cable, “Three-dimensional and C-mode OCT imaging with a compact, frequency swept laser source at 1300nm”, Opt. Exp. 13, 10523-10537 (2005).
13. Y. Mao, C. Flueraru, S. Sherif, and S. Chang, “High Performance Wavelength-Swept Laser with Mode-Locking Technique for Optical Coherence Tomography”, Opt. Comm., 282, 88-92 (2009).
14. S. M. R. M. Nezam, “High-speed polygon-scanner-based wavelength-swept laser source in the telescope-less
configurations with application in optical coherence tomography”, Opt. Lett., 33, pp.1741-1743 (2008).
15. J. Zhang, B. Rao, L. Yu, and Z. Chen, “High-dynamic-range quantitative phase imaging with spectral domain
phase microscopy”, Opt, Lett. 34, pp. 3442-3444 (2009).
16. Y. Mao, S. Chang, S. Sherif, and C. Flueraru, "Graded-index fiber lens proposed for ultrasmall probes used in