HAL Id: hal-01230949
https://hal.archives-ouvertes.fr/hal-01230949
Submitted on 7 Jun 2017
HAL is a multi-disciplinary open access
archive for the deposit and dissemination of
sci-entific research documents, whether they are
pub-lished or not. The documents may come from
teaching and research institutions in France or
abroad, or from public or private research centers.
L’archive ouverte pluridisciplinaire HAL, est
destinée au dépôt et à la diffusion de documents
scientifiques de niveau recherche, publiés ou non,
émanant des établissements d’enseignement et de
recherche français ou étrangers, des laboratoires
publics ou privés.
and interaction with man-made structures:
the case of the NCA airport, France
O. Cavalié, A. Sladen, and M. Kelner
Géoazur, Université de Nice Sophia Antipolis, CNRS, IRD, Observatoire de la Côte d’Azur, 250 rue Albert Einstein, 06560 Valbonne, France
Correspondence to: O. Cavalié (ocavalie@geoazur.unice.fr)
Received: 20 April 2015 – Published in Nat. Hazards Earth Syst. Sci. Discuss.: 11 June 2015 Revised: 24 August 2015 – Accepted: 31 August 2015 – Published: 8 September 2015
Abstract. River deltas are dynamic coastal systems and their
evolutions are closely monitored as it often concentrates vi-tal natural resources for the surrounding areas. Many deltas worldwide experience subsidence due to geological pro-cesses (sediment loading and compaction) or human activ-ities (groundwater or hydrocarbon extraction, land reclama-tion). This causes shoreline erosion or wetland loss which represent serious issues for the population. In this study we investigate the dynamic of the Var delta (France) where re-claimed lands over sea have been built to host the Nice côte d’Azur airport (NCA). Actually, the stability of this in-frastructure is a permanent concern since, in 1979, a newly built extension of the runway platform collapsed in the sea, causing important damages. The project of land extension stopped, but the present airport platform is still located on reclaimed land. Factors that can trigger such catastrophic landslide are thought to be linked to the delta activity and the artificial airport platform load. We used, therefore, En-visat InSAR data to measure accurately the ground defor-mation of the area that includes the Var delta and NCA air-port. Combining data from ascending and descending orbits, we estimated the east–west and vertical components of the deformation and obtained very accurate displacement rate (with a 1σ error of 0.25 mm yr−1). We found that nearly all the deformation is vertical and impacts the whole Var delta. The Var valley subsides at a very low rate (0.5–1 mm yr−1) but downstream the subsidence rate increases and a clear jump is observed at the transition with the reclaimed lands (1–2 mm yr−1). On average, the reclaimed lands subside at
3 mm yr−1. Since the subsidence rate increases in correlation with the sediment thickness, we interpret it as the compaction of the delta quaternary sedimentary wedge. In addition, three areas subside faster (between 5 and 10 mm yr−1), with one calling for more attention as it is the largest and overlooks the steep Var canyon. The progressive increase of subsidence rates toward the sea also suggests that the underwater parts of the margins could subside at rates well above 10 mm yr−1.
1 Introduction
More than 300 million people live on river deltas (Eric-son et al., 2006) and a major environmental issue is land subsidence. With eustatic sea-level rise, this phenomena causes shoreline erosion, wetland loss, flow inversion in the drainage watercourses, or salt water intrusion (Syvitski et al., 2009). Therefore, accurate quantification of delta subsidence is important data to anticipate the ensuing processes and to protect the exposed population. For example, Milliman et al. (1989) used estimates of eustatic sea-level rise and ground subsidence to estimate land loss for three future scenarios in the Nile and Bengal deltas.
Ground subsidence is also problematic for the stability of infrastructures as bridges, dams or airports. For coastal cities with limited flat lands, it is common practice to have airports partly built on land reclaimed from the sea. This is the case of many international airports such as Haneda and Kansai airports in Japan, the Chek Lap Kok airport in Hong-Kong
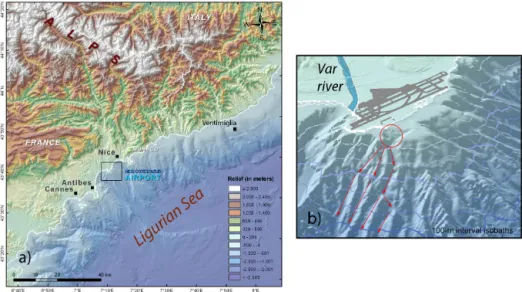
Figure 1. (a) Map of Nice area showing the large topographic gradient between the southern Alps and the offshore margin of the Ligurian sea
(more than 4000 m elevation drop over 40 km). The black square indicates the location of the close-up shown in (b). (b) Zoom on the Nice Côte d’Azur airport platform with a 3-D perspective. The red circle shows the airport extension area which collapsed in 1979 and contributed to the tsunami. The path of the landslide is indicated with red arrows.
or the Incheon airport in South Korea. Although convenient, airport platforms built on reclaimed lands might, over time, lead to stability concerns and/or particular exposure to sea-related natural hazards such as storm or tsunami surges.
The Nice Côte d’Azur international airport (NCA), south-east of France, is one such airport built on reclaimed land. It is located on the North Ligurian Basin (Mediterranean Sea) at the end of the Var river delta (Fig. 1). Most of the air-port’s offshore extension was built in the late seventies. The original project was to reclaim land on the narrow coastal shelf (1–2 km wide) to build new landing tracks and a ma-jor commercial harbour on the edge of those new runways. However, the large harbour seawall disappeared in a ma-jor submarine landslide in October 1979 (Fig. 1). The vol-ume of the surge was estimated to be 150 million m3 (Assier-Rzadkieaicz et al., 2000), rupturing a communication cable 105 km from the source and generating a 2–3 m high local tsunami which killed nine people, mostly on the construction site (Assier-Rzadkieaicz et al., 2000; Sahal and Lemahieu, 2011; Ioualalen et al., 2010). The exact scenario of the land-slide remains a topic of debate (Anthony and Julian, 1997; Mulder et al., 1997; Assier-Rzadkieaicz et al., 2000; Dan et al., 2007; Kopf et al., 2010; Sultan et al., 2010): was it triggered by the exceptional rainfalls in the previous weeks? Did the instability of the newly man-made structure initiate the landslide and turbidity currents? Or is it due to sensitive clay layer failure? At least, the landslide was not triggered by earthquakes at that time which is nevertheless another possi-ble triggering mechanism in this region of moderate seismic activity (Mulder et al., 1994). However, the evaluation of the margin activity from 1991 to 2011 suggests that fresh-water outflow might indeed be a main triggering mechanism for the
more recent landslides (Kelner et al., 2014). The construction of the harbour was cancelled after the 1979 catastrophe but the extension of the airport platform, which had already been completed, was used to build the two main runways, still in use today (Fig. 1). Several studies, focused on the slope of the Nice margin, have collected evidence from core samples (Cochonat et al., 1993; Migeon et al., 2011; Hassoun et al., 2014) or high-resolution bathymetry (Migeon et al., 2012; Kelner et al., 2014) of several past failure events suggesting that the airport platform might be exposed and unstable. Con-cerns were raised after a series of studies using bathymetry data, sediment cores and CPTU data (Dan et al., 2007; Ley-naud and Sultan, 2010; Sultan et al., 2010) which led the authors to conclude that the slopes of the airport platform were probably highly unstable (Sultan et al., 2010). Since the 1979 airport extension (which doubled the size of the air-port), NCA became a critical lever for the economic devel-opment of the French Riviera (11M passengers in 2012, third busiest airport in France), in an area whose terrestrial access is otherwise limited by the sea and the Alps (Fig. 1). All these evolutions have turned the stability of the NCA slopes into a major societal and economic concern.
In this study, we use synthetic aperture radar interferome-try (InSAR) to detect potential deformation of the Var val-ley area. Due to the poor penetration of radar waves into water, our study focuses only on the inland delta and NCA airport deformation, but also gives hints regarding its off-shore extension. We are particularly interested in observing a possible link between the global delta dynamic and the sus-pected deformation on the NCA platform. Actually, Var river is by far the most important river of the French Riviera and it is, in particular, characterized by torrential discharge (up
Figure 2. Relative position of Envisat orbits plotted as a function of image acquisition date for (a) ascending track 301 and (b) descending
track 22. Grey lines show the interferograms included in the time series analysis. (c) Spatial coverage of tracks 301 and 22 are represented by the black squares.
to 3770 m3s−1during the catastrophic 1994 flooding event) (Anthony, 2007), that is one of the proposed scenarios to ex-plain the 1979 submarine landslide (Dan et al., 2007; Kopf et al., 2010). In order to do a comprehensive analysis of the whole margin, this inland ground motion can be compared to submarine analysis that studied the sea-floor deformations (Kelner et al., 2014).
To track the deformation evolution through time and in-crease the signal-to-noise ratio of the averaged velocity over the period 2003–2011, we perform a time series anal-ysis of the SAR images that has been successfully used to measure centimetric ground motion related to volcanoes (Hooper et al., 2008), ground subsidence related to surface load changes (Cavalié et al., 2007), urban subsidence due to ground compaction (López-Quiroz et al., 2009), or active tec-tonic (Cavalié and Jónsson, 2014).
2 Data and InSAR method
We used the Envisat satellite data archive provided by the European Space Agency (ESA) to measure the deformation around the NCA airport from both descending and ascend-ing orbits. For the period 2003–2011, 47 images have been acquired along descending track 22 and 40 images along as-cending track 301 (Fig. 2). Images from asas-cending and de-scending tracks overlap from Cannes, France, to Ventimiglia, Italy (Fig. 2c).
We generated ground displacement time series from inter-ferograms using the New Small BAseline Subset (NSBAS) processing chain (Doin et al., 2012). This chain is based on the ROI_PAC (Repeat Orbit Interferometry Package) soft-ware (Rosen et al., 2004). The main idea consists in limit-ing both the temporal and spatial baseline between the im-ages that will be combined to compute the interferograms in order to optimize the interferometric phase coherence and keep the highest possible number of pixels for the deforma-tion analysis. Figure 2a and b show the network of interfer-ograms based on the image acquisition configuration.
Inter-ferograms are corrected for orbital and topographic compo-nents using DORIS and the 3 arcsec SRTM DEM (Farr and Kobrick, 2000), respectively. To help the phase unwrapping, interferograms are filtered using an adaptive filter (Goldstein and Werner, 1998) and slightly downsampled by pixel multi-looking with 2 looks in range and 2 × 5 looks in azimuth. The resulting pixel spacing is ∼ 40 m × 40 m. The interferogram coherence stays good along the coast, thanks to the strong reflections of the buildings, and very poor in the up-country due to the steep slopes of the mountains and the vegetation that covers most of the area. We used SNAPHU (Statistical-Cost Network-Flow Algorithm for Phase Unwrapping) to un-wrap interferograms. To avoid dealing with the very complex unwrapping process in the mountainous area, we take only a small subset of the images around the airport. This step allows to greatly speed-up the computation of the interfer-ograms. To process the ground displacement time series, it is important that all interferograms are properly referenced. Any stable area (i.e., area that is not deforming and that keeps a good phase coherence through time) can be set as a ref-erence. However, as phase propagation delays affect pixels randomly, a too small area, even stable, should not be used as a reference as it might be off by several radians. We used a constrained least-square inversion (Doin et al., 2012) in order to derive the surface displacement rates from the interfero-grams. A smoothing operator is applied to limit phase varia-tions due to turbulent atmospheric delays. Displacement rate of the ground are estimated by the linear component of the time series result for each pixel. We therefore measured the ground displacement rates from two point of views (or line of sights, LOS) corresponding to the ascending and descend-ing orbits. As the satellite LOS has an average angle of 23◦ with the vertical, the measurements are more sensitive to ver-tical displacements. Moreover, Envisat satellite has a mostly north–south orbit (azimut of ∼ 13◦N) and has a side-looking acquisition mode. InSAR measurements are, thus, almost in-sensitive to north–south ground deformation. In a referential where the east-, north- and up-axis are defined positive, the
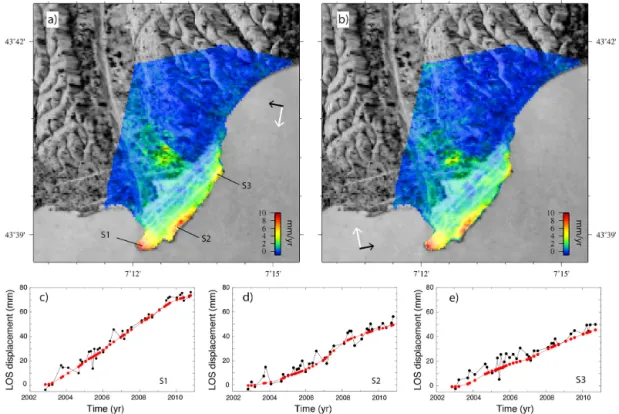
Figure 3. Ground velocity maps from InSAR time series analysis in mm yr−1measured along the satellite line of sight (LOS) direction (black and white arrows show the LOS and flight directions, respectively). For descending track 22 (a) and ascending track 301 (b), velocities are shown positive in the direction away from the satellite (black arrows). Time series of the ground displacement (shown in c–e) for three pixels located in S1, S2, and, S3. Black and red lines represent the ground displacement between 2003 and 2011 without or with smoothing, respectively.
mean line of sight vectors are (0.381; 0.088; −0.921) and (−0.381; 0.088; −0.921) for the ascending and the descend-ing orbits, respectively. Therefore, one can retrieve the east component and the mostly vertical (with a bit of north) com-ponent of the ground displacement in combining both LOSs.
3 Results of the time series InSAR analysis
Figure 3a and b shows the averaged ground velocity maps obtained independently along tracks 301 (descending orbit) and 22 (ascending orbit). Two results jump out: (i) the great similarity between the ascending and descending velocity maps, and (ii) the presence of three areas located along the edge of the airport platform (labelled S1, S2, and S3 on Fig. 3a) moving away from the satellite. Moreover, as shown by the LOS arrows, the view angles between the ascend-ing and descendascend-ing tracks differ mostly in the sign of the east component. Therefore, most of the deformation seems vertical. The fusion of those maps can be done in combin-ing the two LOSs (either by subtraction or addition) in or-der to separate the east component and the quasi-vertical component of the ground displacement. As expected, we find that the ground motion is essentially vertical (Fig. 4a), and not horizontal (i.e., in the east-west direction) (Fig. 4b).
The east-west component is mostly around zero, display-ing a spatially coherent signal only in a few localized ar-eas (Fig. 4b). Indeed, the noise level of the horizontal com-ponent might seem large compared to that of the vertical component (Fig. 4a) but, as the LOS vector makes a rela-tively large angle with horizontal (67◦), when InSAR signal is projected into the east component, the noise gets amplified by a factor ∼ 1/ sin(23◦). Hence, the horizontal motion
can-not be interpreted with the same level of confidence as the vertical motion. Where there is coherent horizontal motion, it does not correlate with well identified ground structures and we interpret these signals as noise. The only exception is the eastward motion along the offshore edge of the run-way platform because the signal is spatially coherent. This area is very narrow (about 1 pixel wide) and could repre-sent the response of the platform seawall (that is made of big concrete blocks) to the wave forces. On the other hand, the vertical component shows very clear patterns of defor-mation (Fig. 4a), with a general trend of subsidence over the whole studied area and a few localized areas of more intense subsidence. All these areas of more intense deformation are on the edges of the airport platform. The largest subsidence rate is located on the southern tip of the platform correspond-ing to the beginncorrespond-ing of the landcorrespond-ing tracks (S1 on Fig. 3a):
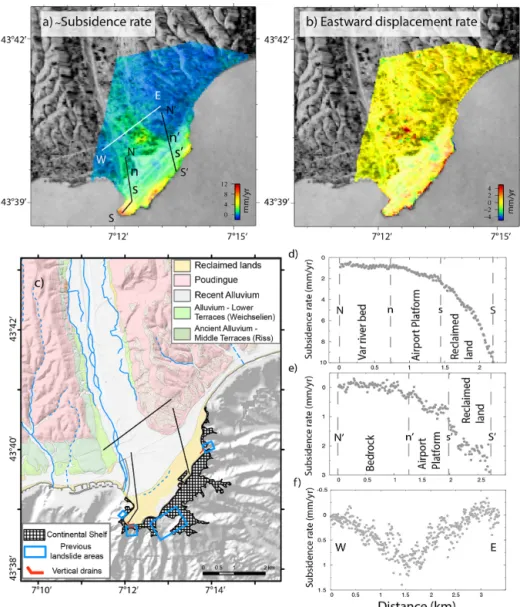
Figure 4. Near vertical component (a) and east component (b) of the ground displacement rate (in mm yr−1) obtained by combining ascend-ing and descendascend-ing track measurements. (c) Geological map extracted from “BRGM 50k standardized”. The topography is from “GO_06 juin 2009” and bathymetry results from compilation of marine campaign data. Observed subsidence rates along N–S (d, e) and E-W (f) profiles are shown (profile locations in Fig. 4a and c). InSAR data (gray dots) are comprised within a 2 km wide box around the profile lines.
this area, roughly 500 m × 500 m and surrounded on all three sides by water, has a subsidence rate that progressively in-creases from 4 to 9.5 mm yr−1near its offshore edge (Fig. 4a and c). A second patch of subsidence (S2 on Fig. 3a), about 1 km northeast of S1, has a similar but slightly lower rate of subsidence (8.5 mm yr−1) and is elongated along the edge of the platform. Finally, a third much smaller patch of de-formation (S3 on Fig. 3a) with 6 mm yr−1of motion is de-tected on the eastern corner of the airport, near the end of the landing tracks. Times series for these three patches of highest subsidence show linear ground displacements over the whole period studied (2003–2011) with little scatter be-tween measurements at each interval of the time series anal-ysis (Fig. 3c–e).
But these patches of more intense deformation are part of a larger scale subsidence pattern (green area on Fig. 4a) starting from zero about 4 km upstream of the Var valley, progressively increasing to a few mm yr−1 toward the air-port, and then strongly increasing across the airport plat-form (runway tracks). While the Var riverbed subsidence rates are small, there are arguments to believe the subsi-dence is real: the pattern is spatially coherent and the ampli-tudes are clearly above the pixel dispersion. A profile across the Var riverbed (Fig. 4f) shows that the pixels dispersion is less than 0.5 mm yr−1 and the subsidence rate goes back to 0 mm yr−1on the edges of the valley. Moreover, the dis-placement rate dispersion over areas that are assumed to be stable (i.e., no displacement) shows a Gaussian distri-bution centered around zero and with a standard deviation
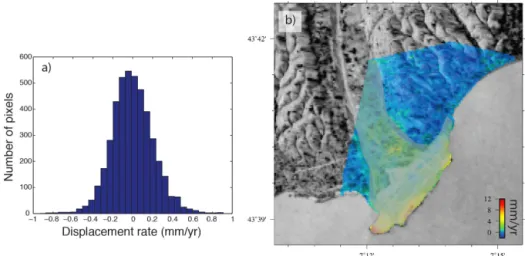
Figure 5. (a) The ground displacement rate, measured over the stable areas, shows a gaussian distribution centered around zero and with
a standard deviation of 0.25 mm yr−1. (b) Map showing in grey the area which has been masked (Var riverbed and the airport platform) to estimate the measurement dispersion.
of 0.25 mm yr−1 (Fig. 5). As there is no reason that this noise distribution changes for the airport platform, we as-sume that 1σ error of 0.25 mm yr−1 can be applied to the rest of the map. To investigate further this large subsidence pattern, we drew two profiles from the riverbed (profile N– S) or coastal range (profile N0–S0) to the edge of the delta (Fig. 4d and e). The profiles reveal a differential motion be-tween the last 3–4 km of the Var riverbed subsiding at about 1 mm yr−1(segment N–n, Fig. 4d) and the stable surround-ing coastal range (segment N0–n0, Fig. 4e). This difference is also clearly visible on the vertical velocity map (Fig. 4a) with the green-blue contrast between subsiding and stable ar-eas respectively. This contrast matches very well the geology of the area (Fig. 4c). But it is only at the transition with the delta, which essentially corresponds to the airport area, that the subsidence rates become really large. Along profile n–S, which reaches the patch S1 of largest subsidence, the rate in-creases from 1 to 9 mm yr−1over a distance of only 1.5 km (Fig. 4d). Further north on the platform, where the gradient of subsidence rate is the smallest (profile n0–S0), there is still an increase of 3 mm yr−1over 1.5 km (Fig. 4e).
4 Discussion
4.1 Origin of the subsidence
The InSAR time series analysis reveals a clear subsidence across the studied area, with a moderate and progressive in-crease of the subsidence in the last few kilometres of the Var riverbed transitioning to larger subsidence rates (4 mm yr−1 with locally higher values up to 10 mm yr−1) in the last cou-ple of kilometres across the aerial platform. Although the viewing angles of the Envisat radar satellite do not allow to resolve the north–south motion, the absence of large-scale horizontal motion on the east–west component (Fig. 4b)
sug-gests that the motion of the delta is almost purely vertical. One exception is a very thin line (1–2 pixels wide) of east-ward motion detected on the edge of the airport track but we suspect that it is related to re-mobilization of the large con-crete blocs during the strong winter storms. This hypothesis is supported by the steep submarine morphology.
To understand the origin of this subsidence, we compared its location with the geologic map of the area (Fig. 4c). The comparison reveals a remarkable spatial correlation between the subsiding areas and the geological units (Fig. 4a and c), where the large-scale subsidence is limited to the quaternary alluvium deposits of the delta and Var riverbed. On both sides of the riverbed, where the transition from alluvium to con-glomerate occurs (poudingue), the subsidence rate quickly drops to zero (Fig. 4f). The conglomerate unit dominates the regional foothill geology and appears to be very stable across our studied area with a rate of 0 ± 0.25 mm yr−1 (Fig. 5). This high correlation between subsidence and geology points to a unique large-scale process that affects the end of the Var riverbed and the delta.
Several processes are known to cause subsidence. Tecton-ics is one of them (e.g. Dokka (2006) discusses the role of a fault on the subsidence of the Mississippi delta) and needs to be considered given that the Ligurian margin is character-ized by active deformation (e.g. Larroque et al., 2011). The deformation of the margin, associated to moderate seismic-ity (Courboulex et al., 2007), is mostly seen through a set of thrust faults at the foot of the continental slope which likely hosted the 1887 earthquake rupture of which the magnitude is estimated around Mw=6.8–6.9 (Larroque et al., 2012).
However, in this part of the margin, the main faults identi-fied by morpho-geological studies are oriented parallel to the margin (Larroque et al., 2011) and are thus not compatible with a motion restricted to the sole riverbed. It also seems un-likely that a slip on a hypothetical fault would cause a steady
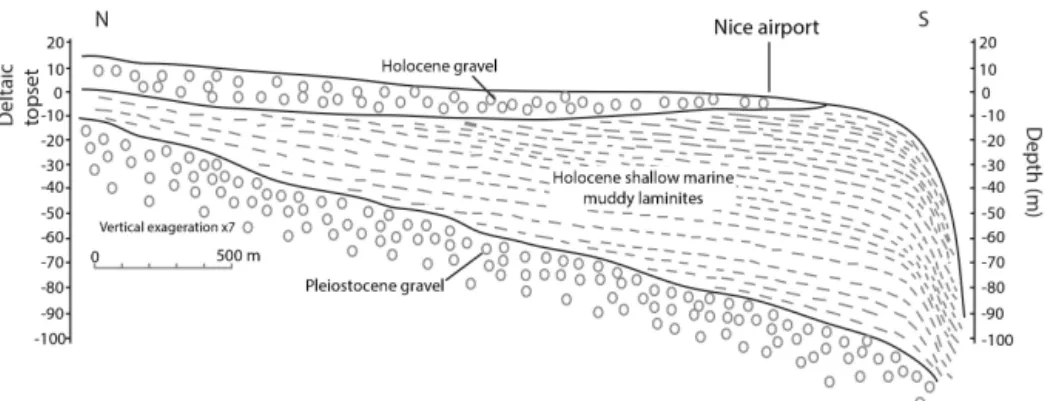
Figure 6. Schematic N–S cross-section of the Var delta deposits (on- and offshore). Figure modified after Dubar and Anthony (1995) and
Dan et al. (2007).
subsidence over the 8-year period of our measurements and not show better in the morphology. Salt tectonic also took place deeper in the basin. Salt creep causes very large land-slides at the foot of the margin (Hassoun et al., 2014). But these deep basin movements are difficult to link with surface deformation limited to the Var riverbed.
If it is not a tectonic movement origin, a shallow local process is most likely causing the subsidence. Because the subsidence pattern has a very large and consistent extent, it is unlikely related to groundwater extraction or permanent anthropogenic modifications which have affected the area in the last 60 years: namely the reclamation of the airport land-ing tracks or the severe channelization of the Var river which involved construction of several dams, large-scale aggregate extraction or water pumping (Anthony and Julian, 1997). Yet it remains possible that these anthropogenic modifications contribute to the subsidence rates at a smaller scale. Because the subsidence is well correlated with the Var riverbed and delta alluviums, and decreases with distance away from the shoreline, we argue that consolidation of the sediments is the primary cause of the observed ground motion. Indeed, many of the world’s largest river deltas are primarily sink-ing under the effect of sediment compaction (Syvitski et al., 2009). Examples include the Fraser river delta in Western Canada (Mazzotti et al., 2009), the Mississippi delta in the USA (Törnqvist et al., 2008), the Po delta in Italy (Teatini et al., 2011) or the Ganges-Brahmaputra delta in Bangladesh (Higgins et al., 2014).
4.2 Deltas and sediment compaction
In the stratigraphic cross-section of the Var delta (Fig. 6, adapted from the reconstruction work of Dubar and Anthony, 1995; Stegmann et al., 2011), we see that the delta is com-posed of a Pleistocene basement overlain by Holocene de-posits. The thickness of the Holocene superficial strata is maximum offshore by the shelf break (100 m) and decreases landward over a distance of about 4 km: this distance to the shore corresponds to the transition between the Var riverbed
and the delta, where the deltaic topset starts to be dominated by gravels as expected for a braided bedload channel. At this distance from the shore, the superficial gravel deposits merge with the basal fluvial Pleistocene gravels. The result-ing Holocene wedge, which took shape before the Var delta was anthropized, is made of a thick succession of muddy laminites and thin peat interbeds resulting from brackish delta-plain and fluvial overbank deposits (Dubar and An-thony, 1995). Looking at the spatial extent of the Holocene wedge, we find that it matches our documented aerial sub-sidence pattern by tapering over a distance of about 4 km from the shelf break. This spatial correlation suggests that the subsidence of the Var delta is mainly controlled by the compaction of these Holocene strata. Since the temporal de-crease of subsidence rate typically follows an exponential curve with a relatively short time constant (likely shorter than 100 years) (Terzaghi and Peck, 1967), it seems unlikely that compaction of the basal Pleistocene strata could explain the 4–10 mm yr−1of compaction rate (CR) observed at the sur-face. We thus conclude that the subsidence is mainly related to the compaction of the Holocene wedge as inferred for other deltas such as the Po, Mississippi, Fraser or Ganges-Brahmaputra deltas (Mazzotti et al., 2009; Törnqvist et al., 2008; Teatini et al., 2011; Higgins et al., 2014, e.g.). More-over, InSAR data show here an increase of the subsidence rate from inland to the coastline that correlates well with the increase of the Holocene sediment thickness.
Wetland and delta compaction with high CR are often as-sociated with the presence of peat because its decomposi-tion can cause fast compacdecomposi-tion in the earliest stage of its formation and burial (Allen, 1995; Long et al., 2006; Törn-qvist et al., 2008). This explains why the compaction was linked to the superficial Holocene layers in most of these previously mentioned studies about delta subsidence. In the case of the Var delta, the peat deposits are interlayered with muddy laminites so only compaction tests on core samples could isolate the contribution of each type of deposit to the overall compaction process. This process might also be in-fluenced by the flow of fresh water in the permeable sandy
sippi deltas (Mazzotti et al., 2009; Wöppelmann et al., 2013; Törnqvist et al., 2008) and up to 15–18 mm yr−1 in some parts of the Po and Ganges-Brahmaputra deltas (Teatini et al., 2011; Higgins et al., 2014). Contrary to those studies (ex-cept for the Po delta that seems to behave similarly), the CR increases until the coastline. As the large-scale compaction gradient observed across the Var delta unlikely stops abruptly at the coastline, it probably continues to increase offshore over the remaining distance (500 m to 1.5 km) that separates the airport edge from the shelf break (Fig. 1). Presently, there is no observation to quantify the deformation rates of the un-derwater platform with a centimetric precision. CPTU mea-surements made offshore suggest that the most critical con-ditions for the stability of the shelf concern sediments down to 30 m below the seafloor (Dan et al., 2007). 30–45 m be-low the seafloor also corresponds to the average depth of the 1979 landslide.
4.3 Stability of the high subsidence rate areas
In addition to the large-scale subsidence, we observe three areas (S1, S2, and S3) along the platform edge with higher displacement rate. We now investigate if these patches reflect processes other than compaction. We are also interested in knowing whether those localized areas inland could reflect a broader scale phenomenon that propagates offshore.
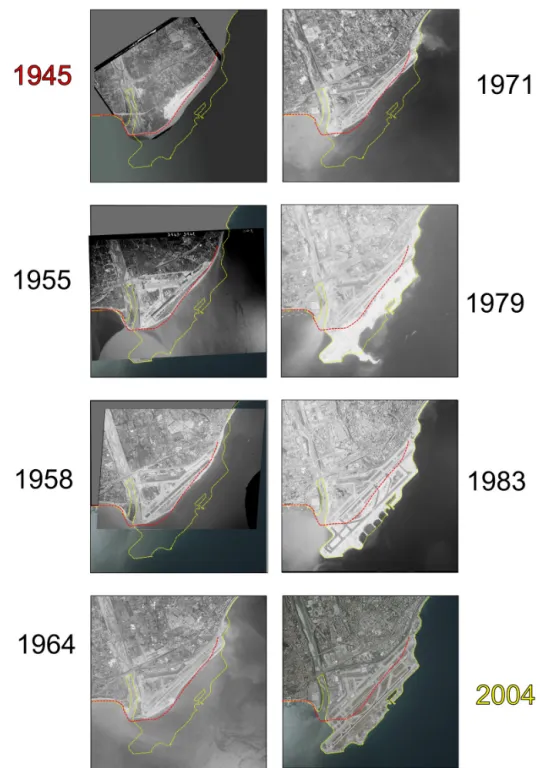
To better understand the possible origin of these patches, we compiled a series of aerial photos at different stages be-tween 1945 (i.e., before any significant lands were reclaimed from the sea) and 2004 (Fig. 7). These aerial photos indi-cate that the S2 patch corresponds to groynes fields reclaimed post 1979. Because this area is on the edge of the platform and was back filled after the 1979 airport extension, it might not have been filled with the same type of material or dynam-ically compacted as the rest of the platform (dynamic com-paction of the landing tracks was done with a 130 t weight dropped from 22 m high; Ollié, 1982). The strong correla-tion of the S2 subsidence pattern with the past groynes fields suggests that these high subsidence values are localized and might not correspond to the edge of an offshore area with higher subsidence rates. Yet, the S2 patch is facing a wide
break and affect the airport embankment. This type of su-perficial slope failure is typical of the slopes surrounding the NCA shelf, with concave-up topographic profile and very steep slopes (15–20◦) (Migeon et al., 2011). The ensuing
bathymetry campaign covering the periods 1999–2006–2011 (Kelner et al., 2014) did not document further extension of the chute. Because there is no clear fluctuation in the dis-placement time series (Fig. 3e), the subsidence in S3 is prob-ably an indirect response of the ground following the ancient erosion activity of the scar. The retreat of the shelf break could promote compaction by lowering the lateral support and providing more efficient paths for the expulsion of pore-pressure. While this process could favour instability, the spa-tial extent of the subsidence and the size of the scar are quite limited. Finally, it is worth noting that S3 corresponds pre-cisely to the location where 566 vertical drains have been installed at 50 m depth to decrease the interstitial pressure in order to stabilize and compact the sediment input (Ollié, 1982). Interestingly, the other place where drains (596) have been set up is located on S1 (Fig. 4c).
Contrary to the S2 area, which remains a few hundred metres away from the shelf break, the S1 deformation area corresponds to a promontory on the southwestern end of the landing track. It is surrounded by steep canyons on three-quarters of its periphery and the distance to the slope break is often smaller than 100 m. Using differential bathymetry, Kelner et al. (2014) have shown that this part of the mar-gin has recently experienced fast morphological changes. Between 1999 and 2006, a strong erosion phase took place and eroded part of the marine airport embankments at the southern point of S1. Around the same place, a landslide, lo-cated 100 m seaward, also reduced the continental shelf up to 30 m. On the other hand, after 2006 this area experienced a much smaller activity with for instance, only sediment de-position around the S1. These strong and rapid changes in aggradation–erosion around the S1 area can be explained firstly by the proximity of the Var canyon, the link river-canyon, and by the steep slopes of chutes (Fig. 4c). The Var is the main river of the northern Ligurian margin and is charac-terized by catastrophic discharge events, typically during fall and spring (Migeon et al., 2011; Guglielmi, 1993): for
in-Figure 7. Sequence of aerial photos from 1945 to 2004 showing the evolution of the contour of the NCA airport (that has not changed since
then). On all photos, the 1945 coastline contour is reported as a red dashed line and the actual contour as a yellow dashed line. The 1979 photo shows the extension of the newly built seawall before it collapsed into the sea, in October 1979 (photo credit: geoportail.ign.fr).
stance, the Var river had a mean flow value of 751 m3s−1the week before the 1979 landslide (Anthony and Julian, 1997).
The InSAR measurements period (2003–2011) overlaps with the periods studied by differential bathymetry (1999– 2011), but does not identify the change of activity detected on the margin around the S1 promontory since the subsi-dence rate is steady over the whole period (Fig. 3c). Hence, if
the erosion process has any direct impact on the subsidence of the promontory, it is of very small amplitude and does not seem to directly affect the long-term compaction trend. However, the rapid changes in the bathymetry can steepen and thus undermine the slopes supporting the upper part of the shelf. Moreover, the rework of the flanks around the S1 promontory and the large surface exposure to the seawater
corners of the airport platform (Potot, 2011), are in good agreement with subsiding zones, S1 and S3, locations. The drains, installed in those areas (Fig. 4c) to help the fluid cir-culation through the sediments, must also participate to in-crease the compaction rate. To summarize: the faster subsi-dence rate measured in S1, the uneven distribution of sed-iments deposits around it, the recent landslides in the area, and the steepening of flanks are all processes that could bring this section of the margin closer to destabilization.
In our analysis of the subsidence pattern, one question re-mains: is there any evidence of the influence of the reclaimed land on the evolution of the delta? Because our measure-ments are limited to land and the area reclaimed by the NCA airport defines the new coastline of the delta, it is difficult to isolate the impact of the man-made structure on the subsi-dence rate. However, one piece of evisubsi-dence that the reclaimed lands have an influence on the compaction is the small jump of about 0.5–1 mm yr−1in the rate of subsidence at the tran-sition between the former coastline and the reclaimed land (Fig. 4). Although small, this change can be followed along almost the whole length of the platform. In the two profiles of subsidence rate across the NCA airport (Fig. 4d and e), the jump is localized at points s and s0, respectively. Hence, there is a detectable influence of the reclaimed lands on the subsi-dence of the delta, but it is difficult to evaluate how much it impacts its evolution.
5 Conclusions
Previous studies have shown that many river deltas, around the world, are sinking. However, the full spatial variabil-ity of the subsidence is often poorly documented. We used, here, very accurate InSAR measurement (1σ error of 0.25 mm yr−1) to show undoubtedly the ongoing subsidence of the whole Var delta. This slow deformation, between 0.5 and 1 mm yr−1 in the Var valley, increases toward the sea and reaches 3 mm yr−1on the Nice airport platform built over reclaimed lands. In addition to this main subsidence pat-tern, three areas located on the edges of the platform have a vertical deformation up to 10 mm yr−1. The main
subsi-land gained over sea. Actually, the accurate ground motion measurements show a ∼ 1 mm yr−1 increase of subsidence across the border between lands and reclaimed lands. How-ever, it is difficult to predict what would be the compaction gradient further south without the airport weight.
On a scientific perspective, tracking and understanding the seafloor deformation is the next step but would call for com-plex and very expensive technologies (Newman, 2011). For our study area, knowing how the inland deformation prop-agates offshore would help to establish the role of the re-claimed area on the delta subsidence. Combined with mod-elling, such data could also greatly help evaluating how much strain such reclaimed lands are able to support and how the subsidence rate will evolve in the future. Finally, as for in-land in-landslide, a better identification of the triggering factors (such as earthquakes, fluid, and groundwater) would help to secure land reclamations.
Acknowledgements. The SAR data were provided by the European
Space Agency through category-1 project 12769. ESA retain own-ership of the original Envisat SAR data. We thank Jenny Trévisan and Wanda Berolo from the Géoazur GIS department for their help to make Figs. 1 and 4. We are also thankful to Frédéric Cappa and Louis De Barros for the fruitful discussions and to Pietro Teatini for his review suggestions.
Edited by: O. Katz
Reviewed by: P. Teatini and another anonymous referee
References
Allen, J. R. L.: Salt-marsh growth and fluctuating sea level: implica-tions of a simulation model for Flandrian coastal stratigraphy and peat-based sea-level curves, Sediment. Geol., 100, 21–45, 1995. Anthony, E. J.: Problems of hazard perception on the steep, urbanised Var coastal floodplain and delta, French Riviera, Méditerranée, J. Mediterr. Geogr., 108, 91–97, 2007.
Anthony, E. J. and Julian, M.: The 1979 Var Delta landslide on the French Riviera: a retrospective analysis, J. Coast. Res., 13, 27– 35, 1997.
Cochonat, P., Bourillet, J.-F., Savoye, B., and Dodd, L.: Geotechni-cal characteristics and instability of submarine slope sediments, the nice slope (NW Mediterranean Sea), Mar. Geores. Geotech-nol., 11, 131–151, 1993.
Courboulex, F., Larroque, C., Deschamps, A., Kohrs-Sansorny, C., Got, C. G. J.-L., Stéphan, J. C. J.-F., Béthoux, N., Virieux, J., Brunel, D., Maron, C., Duval, A.-M., Pérez, L., and Mondi, J.-L.: Seismic hazard on the French Riviera: observations, interpre-tations and simulations, Geophys. J. Int., 170, 387–400, 2007. Dan, G., Sultan, N., and Savoye, B.: The 1979 Nice harbour
catas-trophe revisited: trigger mechanism inferred from geotechnical measurements and numerical modelling, Mar. Geol., 245, 40–64, 2007.
Doin, M.-P., Lodge, F., Guillaso, S., Jolivet, R., Lasserre, C., Ducret, G., Grandin, R., Pathier, E., and Pinel, V.: Presentation of the small baseline NSBAS processing chain on a case exam-ple: the Etna deformation monitoring from 2003 to 2010 using Envisat data, ESA, SP-697, Proc. of FRINGE 2011 Workshop, 19–23 September 2011, Frascati, Italy, 2012.
Dokka, R. K.: Modern-day tectonic subsidence in coastal Louisiana, Geology, 34, 281–284, doi:10.1130/G22264.1, 2006.
Dubar, M. and Anthony, E. J.: Holocene environmental change and river-mouth sedimentation in the Baies des Anges, French Riv-iera, Quaternary Res., 43, 329–343, 1995.
Ericson, J. P., Vörösmarty, C. J., Dingman, S. L., Ward, L. G., and Meybeck, M.: Effective sea-level rise and deltas: causes of change and human dimension implications, Global Planet. Change, 50, 63–82, 2006.
Farr, T. G. and Kobrick, M.: Shuttle radar topography mission pro-duces a wealth of data, Eos Trans. AGU, 81, 583–585, 2000. Goldstein, R. M. and Werner, C. L.: Radar interferogram
filter-ing for geophysical applications, Geophys. Res. Lett., 25, 2517– 2520, 1998.
Guglielmi, Y.: Gydrogéologie des aquifères Plio-Quaternaires de la Basse Vallée du Var, Thèse d’état, Académie d’Aix-Marseille, Aix-Marseille, 170 pp., 1993.
Hassoun, V., Martin, J., Migeon, S., Larroque, C., Cattaneo, A., Eriksson, M., Sanchez-Cabeza, J. A., Mercier de Lepinay, B., Liong Wee Kwong, L., Levy, I., Heimbürger, L.-E., and Miquel, J.-C.: Searching for the record of historical earthquakes, floods and anthropogenic activities in the Var Sedimentary Ridge (NW Mediterranean), Adv. Nat. Technol. Haz., 37, 571–581, 2014.
Higgins, S. A., Overeem, I., Steckler, M. S., Syvitski, J. P. M., Seeber, L., and Akhter, S. H.: InSAR measurements of compaction and subsidence in the Ganges-Brahmaputra
and Taboada, A.: Recent morphological changes of the Nice Continental Slope, Eng. Geol. Soc. Terr., 4, 221–225, 2014. Kopf, A. J., Kasten, J., and Blees, J.: Geochemical evidence for
groundwater-charging of slope sediments: the Nice airport 1979 landslide and tsunami revisited, Adv. Nat. Technol. Haz., 28, 203–214, 2010.
Larroque, C., Mercier de Lépinay, B., and Migeon, S.: Morphotec-tonic and fault earthquake relationships along the northern Lig-urian margin (western Mediterranean) based on high resolution, multibeam bathymetry and multichannel seismic-reflection pro-files, Mar. Geophys. Res., 32, 163–179, 2011.
Larroque, C., Scotti, O., and Ioualalen, M.: Reappraisal of the 1887 Ligurian earthquake (western Mediterranean) from macroseis-micity, active tectonics and tsunami modelling, Geophys. J. Int., 190, 87–104, 2012.
Leynaud, D. and Sultan, N.: 3-D slope stability analysis: A proba-bility approach applied to the nice slope (SE France), Mar. Geol., 269, 89–106, 2010.
Long, A. J., Waller, M. P., and Stupples, P.: Driving mecha-nisms of coastal change: peat compaction and the destruction of late Holocene coastal wetlands, Mar. Geol., 225, 63–84, doi:10.1016/j.margeo.2005.09.004, 2006.
López-Quiroz, P., Doin, M.-P., Tupin, F., Briole, P., and Nico-las, J.-M.: Time series analysis of Mexico City subsidence con-strained by radar interferometry, J. Appl. Geophys., 69, 1–15, doi:10.1016/j.jappgeo.2009.02.006, 2009.
Mazzotti, S., Lambert, A., Van der Kooij, M., and Mainville, A.: Impact of anthropogenic subsidence on relative sea-level rise in the Fraser River delta, Geology, 37, 771–774, doi:10.1130/G25640A.1, 2009.
Migeon, S., Cattaneo, A., Hassoun, V., Larroque, C., Corradi, N., Fanucci, F., Dano, A., Lepinay, B., Sage, F., and Gorini, C.: Mor-phology, distribution and origin of recent submarine landslides of the Ligurian Margin (North-western Mediterranean): some in-sights into geohazard assessment, Mar. Geophys. Res., 32, 225– 243, doi:10.1007/s11001-011-9123-3, 2011.
Migeon, S., Cattaneo, A., Hassoun, V., Dano, A., Casedevant, A., and Ruellan, E.: Failure processes and gravity-flow transforma-tion revealed by high-resolutransforma-tion AUV swath bathymetry on the Nice continental slope (Ligurian Sea), Adv. Nat. Technol. Haz., 31, 451–461, 2012.
Milliman, J. D., Broadus, J. M., and Gable, F.: Environmental and economic implications of rising sea-level and subsiding deltas: the Nile and Bengal examples, Ambio, 18, 340–345, 1989. Mulder, T., Tisot, J.-P., Cochonat, P., and Bourillet, J.-F.: Regional
assessment of mass failure events in the Baie des Anges, Mar. Geol., 122, 29–45, doi:10.1016/0025-3227(94)90203-8, 1994.
Sahal, A. and Lemahieu, A.: The 1979 Nice airport tsunami: map-ping of the flood in Antibes, Nat. Hazards, 56, 833–840, 2011. Stegmann, S., Sultan, N., Kopf, A., Apprioual, R., and Pelleau, P.:
Hydrogeology and its effect on slope stability along the coastal aquifer of Nice, France, Mar. Geol., 280, 168–181, 2011. Sultan, N., Savoye, B., Jouet, G., Leynaud, D., Cochonat, P., Henry,
P., and Kopf, A.: Investigation of a possible submarine landslide at the Var delta front (Nice continental slope, southeast France), Can. Geotech. J., 47, 486–496, 2010.
D., Cazenave, A., Garcin, M., Hanson, S., Marcos, M., and Santamaría-Gómez, A.: Is land subsidence increasing the expo-sure to sea level rise in Alexandria, Egypt?, Geophys. Res. Lett., 40, 2953–2957, doi:10.1002/grl.50568, 2013.