Publisher’s version / Version de l'éditeur:
Powder Diffraction, 21, June 2, pp. 111-113, 2006-06-01
READ THESE TERMS AND CONDITIONS CAREFULLY BEFORE USING THIS WEBSITE.
https://nrc-publications.canada.ca/eng/copyright
Vous avez des questions? Nous pouvons vous aider. Pour communiquer directement avec un auteur, consultez la
première page de la revue dans laquelle son article a été publié afin de trouver ses coordonnées. Si vous n’arrivez pas à les repérer, communiquez avec nous à [email protected].
Questions? Contact the NRC Publications Archive team at
[email protected]. If you wish to email the authors directly, please see the first page of the publication for their contact information.
NRC Publications Archive
Archives des publications du CNRC
This publication could be one of several versions: author’s original, accepted manuscript or the publisher’s version. / La version de cette publication peut être l’une des suivantes : la version prépublication de l’auteur, la version acceptée du manuscrit ou la version de l’éditeur.
Access and use of this website and the material on it are subject to the Terms and Conditions set forth at Quantitative Rietveld analysis of hydrated cement systems
Mitchell, L. D.; Whitfield, P. S.
https://publications-cnrc.canada.ca/fra/droits
L’accès à ce site Web et l’utilisation de son contenu sont assujettis aux conditions présentées dans le site LISEZ CES CONDITIONS ATTENTIVEMENT AVANT D’UTILISER CE SITE WEB.
NRC Publications Record / Notice d'Archives des publications de CNRC: https://nrc-publications.canada.ca/eng/view/object/?id=316787ce-602b-48c8-a5fd-e05b6aab4593 https://publications-cnrc.canada.ca/fra/voir/objet/?id=316787ce-602b-48c8-a5fd-e05b6aab4593
http://irc.nrc-cnrc.gc.ca
Q u a n t i t a t i v e R i e t v e l d a n a l y s i s o f h y d r a t e d
c e m e n t i t i o u s s y s t e m s
N R C C - 5 0 5 6 8
M i t c h e l l , L . D . ; M a r g e s o n , J . C . ; W h i t f i e l d , P . S .
A version of this document is published in / Une version de ce document se trouve dans: Powder Diffraction, v. 21, no. 2, June 2006, pp. 111-113 doi: 10.1154/1.2204056
The material in this document is covered by the provisions of the Copyright Act, by Canadian laws, policies, regulations and international agreements. Such provisions serve to identify the information source and, in specific instances, to prohibit reproduction of materials without written permission. For more information visit http://laws.justice.gc.ca/en/showtdm/cs/C-42
Les renseignements dans ce document sont protégés par la Loi sur le droit d'auteur, par les lois, les politiques et les règlements du Canada et des accords internationaux. Ces dispositions permettent d'identifier la source de l'information et, dans certains cas, d'interdire la copie de documents sans permission écrite. Pour obtenir de plus amples renseignements : http://lois.justice.gc.ca/fr/showtdm/cs/C-42
QUANTITATIVE RIETVELD ANALYSIS OF HYDRATED
CEMENTITIOUS SYSTEMS
L.D. Mitchell, P.S. Whitfield* and J. C. Margeson
Institute for Research in Construction, National Research Council Canada, 1200 Montreal Road, Ottawa, Ontario, K1A 0R6, Canada
*Institute for Chemical Process and Environmental Technology, National Research Council Canada, 1200 Montreal Road, Ottawa, Ontario, K1A 0R6, Canada
ABSTRACT
A study examining the feasibility, and possible necessity, of using transmission data from capillary mounted samples for quantitative analysis of hydrated cement systems was conducted. In order to obtain true quantitative results, the amorphous contents were determined by the addition of an internal standard. The amorphous content of the starting calcium trisilicate was found to be approximately 21-22 wt%, in close agreement with previously published results. The study revealed that the spherical harmonics preferential orientation correction may not be reliable with un-micronized hydrated cement materials in reflection geometry, as chemically unreasonable progressions in portlandite content with time were observed. The data obtained from capillary measurements, however, exhibited little or no preferential orientation, and appeared to produce the progression of phase contents expected from the reaction. The use of capillaries would appear to be justified in some circumstances to obtain reliable quantitative results from hydrated cementitious materials. In this particular system, a significant fraction of calcium carbonate was present as aragonite, as well as the more usual calcite.
INTRODUCTION
The use of Rietveld refinement for quantitative phase analysis was first described in detail in 1987 (1, 2). Its routine application to the quantification of complex mixtures such as ordinary Portland cement is a much more recent development, largely due to the introduction of innovations such as convolution-based peak synthesis and fundamental parameters into Rietveld software (3). The reduction in the number of parameters required to describe the peaks of each phase makes such an analysis fairly routine with rapid acceptance within the commercial cement community for quality control (4).
Rietveld analysis also affords the opportunity to quantify the presence of amorphous materials, both within unhydrated and hydrated cements (5, 6). This is achieved by the addition of a known
amount of a crystalline internal standard material. The difference between the known and refined phase content gives the amount of ‘invisible’ or amorphous material.
Reflection measurements can easily suffer from non-random particle statistics. The problems associated with non-random particle statistics in hydrated cementitious samples are accentuated
by portlandite (Ca(OH)2), one of the major crystalline cement hydration phases, which often
exhibits large plate-like crystal habits leading to preferential orientation. The conventional approach to dealing with these problems would be to micronise the sample, reducing the particle size and the anisotropy of the particle shape. Micronising the sample may not always be appropriate, due to high shear levels, solvents and high drying temperatures. Any one of these treatments may change the nature of the original sample leading to an erroneous result.
The classical approach for dealing with plate-like materials, e.g. clays, has been to use capillary transmission measurements. The use of capillaries in laboratory instruments was once routine. However, capillary stages have become rather unusual accessories for the purchase of a modern instrument, and are often not available to the user. Capillaries yield lower intensities than conventional reflection samples, so either a high speed PSD detector must be used or the experiment time increased significantly. Given the potential difficulties in obtaining high quality capillary data, this study aimed to answer whether it is desirable, or even necessary, to do so.
EXPERIMENTAL
A single-phase triclinic Ca3SiO5 (C3S) was used rather than a Portland cement to simplify the
study. Higher levels of portlandite were expected in the hydrated samples. The samples (water to cement ratio of 0.5) were cast in 15mm moulds and kept in a desiccator at 100% RH. They were removed at the appropriate conditioning interval. Upon removal the hydration reaction was halted using a freeze-drying technique. Materials were ground with a mortar and pestle then stored in sealed vials until the measurements were carried out.
X-ray diffraction data were obtained using a Bruker D8 system equipped with a primary Göbel mirror and a Vantec-1 PSD detector. Using this configuration both reflection and transmission data could be obtained using the same optics. The Vantec-1 detector was equipped with radial Soller slits, and an air-scatter sink was used to reduce parasitic scattering towards lower angles. After an internal standard (25wt%) was added, samples were lightly ground using a mortar and
pestle, and either top-loaded onto a silicon zero background holder, or loaded into a 0.5mm glass/quartz capillary.
The capillary measurements were taken using a 3º detector window, whilst the reflection data was taken with a 6º detector window. A 0.8mm exit slit was used in the primary mirror for both sets of experiments.
The internal standard material chosen for the study was a commercial rutile produced by DuPont
known as R900®. This material has a small (~0.4μm) and uniform particle size, and possesses a
linear absorption coefficient closer to C3S than Al2O3. R900® is known to have an amorphous
content of its own, so was standardised versus the NIST SRM676 corundum standard. Previously the amorphous content of SRM676 was thought to be 2%, but recently this has been revised to approximately 8%. This has a significant effect on the calculated amorphous content
of the R900®, and consequently the sample under study. The effect on the calculated amorphous
content of R900® is to increase it substantially from ~5.6% to approximately 14%. Previous
publications where the old amorphous content of SRM676 was used (6, 7) consequently underestimate the amorphous content.
Samples were loaded into 0.5mm glass/quartz capillaries and sealed using a flame. Glass/quartz capillaries exhibit high backgrounds so data was also collected for a blank capillary. This was used to simplify the background by subtraction. Sample effects such as surface roughness and capillary absorption were accounted for within the software (Topas 3 beta).
The effects of the largely amorphous calcium silica hydrate (C-S-H) particles on the background were corrected for by a Pawley fit on an approximate cell derived from synthetic C-S-H. The
synthetic C-S-H was made by reacting stoichiometrically blended CaO and amorphous SiO2
together in excess water for 360 days.
The Ca(OH)2 was refined with a 4th order Spherical Harmonic (SH) correction in both reflection
and capillary datasets. The SH coefficients from Topas were input into GSAS (General Structure Analysis System ) to calculate a texture index (TI). This index was subsequently used to gauge the randomness of the powder.
The index limits are:-
• 1 = random powder (no orientation)
RESULTS AND DISCUSSION
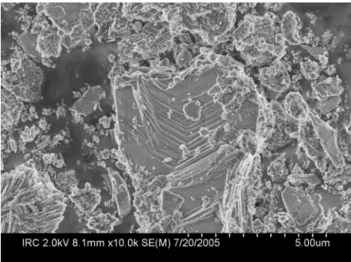
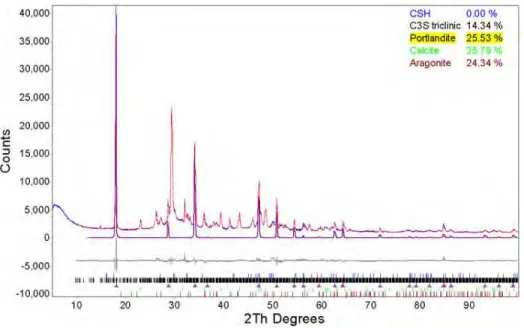
A large layered portlandite crystal can be seen in Figure 1. Also visible in the bottom left of the micrograph are acicular crystals of aragonite. The large and platy portlandite crystals are quite numerous, and can be seen in the samples at all ages. The severe texture, exhibited by these crystals, is responsible for the observed preferential orientation in the X-ray data (see Figure 2). Figure 2 shows the potentially high levels of preferential orientation; the first highlighted peak at 18.0° 2θ is portlandite's 72% peak (PDF#14-1481); with the 100% peak positioned at 34.1° 2θ. It is easily observed that portlandite's 74% peak at 18.05° 2θ is the most intense peak in the pattern, easily overwhelming the true 100% peak at 34.1° 2θ. Without a correction the intensity mismatch caused by orientation will increase the error in the concentration.
Figure 1. SEM micrograph of portlandite found in the 180 day old samples of hydrated C3S
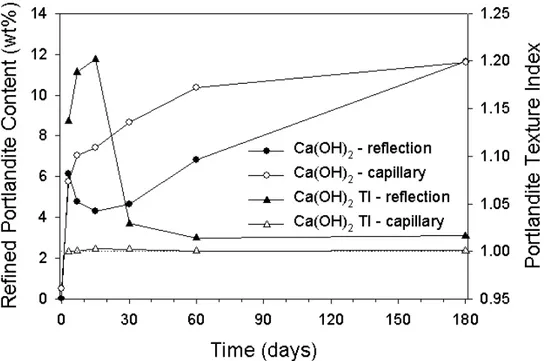
The weight fractions that were calculated from the reflection and transmission data are shown in Figures 3 & 4 respectively. The portlandite results are more clearly shown in Figure 5, along with the results from the textural index. It is apparent that the higher levels of orientation (found by the textural index) in the 7,15 & 30 day reflection results, correspond to the inconsistent
quantified values. Chemically the levels of Ca(OH)2 should not reduce with time.
The textural index for the capillary results show little orientation. This, in addition to a much more acceptable quantified value implies that the use of capillaries can give the X-ray spectroscopist a distinct advantage.
Figure 2. Reflection data from the 180 day hydrated material highlighting the pronounced preferred orientation of the portlandite
Figure 3. Phase fractions (weight %) against time for the data collected in reflection
Figure 4. Phase fractions (weight %) against time for data collected in transmission
Figure 5. Portlandite phase fractions (weight %) against time for data collected in both transmission and reflection. The corresponding textural index values are also shown on a second Y axis.
Some work has been published previously in the literature (8) comparing the effectiveness of the March-Dollase (9) and spherical harmonics (10) preferential orientation correction on quantitative Rietveld analysis. It was concluded on the basis of using synthetic mixtures that the spherical harmonics correction was superior in terms of a figure-of-merit for the quantitative results (8). The results of this study however, indicate that caution is required when naturally occurring mixtures are studied.
CONCLUSIONS
As expected, data from the capillary measurements eliminated preferential orientation from the observed pattern of portlandite. The spherical harmonics correction successfully corrected the portlandite misfits in the Rietveld difference plots of the reflection data. The quantitative results of the capillary and reflection data are however, not equivalent. It has been demonstrated that the presence of texture in the portlandite can lead to chemically unreasonable trends in the portlandite phase fractions.
The problems with the reflection data suggest the presence of significant microabsorption. This is consistent with large, orientating portlandite particles in the reflection samples.
The refined amorphous content of the unhydrated triclinic C3S was found to be 21-22 wt% for
both reflection and transmission geometry, which is in remarkable agreement with the result of
19 wt% for monoclinic C3S reported by De La Torre (11).
REFERENCES
[1] Rietveld, H.M., Acta Cryst., 1967, 22, 151-152.
[2] Hill, R.J.; Howard, C.J., J.Appl.Crystallogr., 1987, 20, 467-474. [3] Cheary, R.W.; Coelho, A.A., J.Appl.Crystallogr., 1992, 25, 109-121.
[4] Scarlett, N.V.Y.; Madsen, I.C.; Manias, C.; Retallack, D., Powder Diffr., 2001, 16, 71-80. [5] Suherman, P.M.; van Riessen, A.; O'Connor, B.; Bolton, D.; Fairhurst, H., Powder Diffr.,
2002, 17, 178-185.
[6] Whitfield, P.S.; Mitchell, L.D., J.Mater.Sci., 2003, 38, 4415-4421.
[7] Winburn, R.S.; Grier, D.G.; McCarthy, G.J.; Peterson, R.B., Powder Diffr., 2000, 15, 163-172.
[8] Sitepu, H.; O'Connor, B.H.; Li, D., J.Appl.Crystallogr., 2005, 38, 158-167. [9] Dollase, W.A., J.Appl.Crystallogr., 1986, 19, 267-272.
[10] Von Dreele, R.B., J.Appl.Crystallogr., 1997, 30, 517-525.