Publisher’s version / Version de l'éditeur:
Vous avez des questions? Nous pouvons vous aider. Pour communiquer directement avec un auteur, consultez la première page de la revue dans laquelle son article a été publié afin de trouver ses coordonnées. Si vous n’arrivez pas à les repérer, communiquez avec nous à [email protected].
Questions? Contact the NRC Publications Archive team at
[email protected]. If you wish to email the authors directly, please see the first page of the publication for their contact information.
https://publications-cnrc.canada.ca/fra/droits
L’accès à ce site Web et l’utilisation de son contenu sont assujettis aux conditions présentées dans le site LISEZ CES CONDITIONS ATTENTIVEMENT AVANT D’UTILISER CE SITE WEB.
Internal Report (National Research Council of Canada. Institute for Research in Construction), 1998-03-01
READ THESE TERMS AND CONDITIONS CAREFULLY BEFORE USING THIS WEBSITE.
https://nrc-publications.canada.ca/eng/copyright
NRC Publications Archive Record / Notice des Archives des publications du CNRC :
https://nrc-publications.canada.ca/eng/view/object/?id=6ccfb301-e1ed-44ae-b83a-36d33b2676fb https://publications-cnrc.canada.ca/fra/voir/objet/?id=6ccfb301-e1ed-44ae-b83a-36d33b2676fb
Archives des publications du CNRC
For the publisher’s version, please access the DOI link below./ Pour consulter la version de l’éditeur, utilisez le lien DOI ci-dessous.
https://doi.org/10.4224/20331484
Access and use of this website and the material on it are subject to the Terms and Conditions set forth at Insulating Buildings Against Aircraft Noise: A Review
Insulating Buildings Against Aircraft Noise: A Review
Bradley, J.S.
IRC-IR-760
A Review
J.S. Bradley
IRC Internal Report, IRC IR-760
March 1998
This review was jointly funded by Transport Canada and the Institute for Research in Construction , National Research Council
Table of Contents
Page
1. Introduction 2
2. Basic Concepts 3
(a) Transmission loss of limp panel 3
(b) Transmission loss of real partitions 5
(c) Multiple elements 7
(d) Holes, leaks and cracks 8
3. Measurement Methods 10
(a) Reverberant room tests 10
(b) Outdoor to indoor measurements 10
(c) Indoor to outdoor measurements 11
(d) Aircraft source spectra 11
(e) Single number ratings 12
4. Walls 15
5. Windows 19
(a) Effects of glass thickness and air spaces between multiple layers 19
(b) Laminated glass 21
(c) Angle of incidence effects and measurement problems 21 (d) Edge conditions and mounting effects 22
(e) Open windows and window seals 25
(f) Interior absorption 27
(g) Active control 27
(h) Other problems 27
6. Doors 29
7. Roofs 32
8. Vents and Holes 35
9. Overall Building Insulation Studies 37
10. Conclusions 40
1.
Introduction
A recent review of aircraft noise issues in Canada was conducted by the National Research Council for Transport Canada [1,2,3]. This review was quite broad in scope but identified the need for improved design procedures for the sound insulation of buildings against aircraft noise. Aircraft noise levels have been considerably reduced at the source over the past 30 years. The result of this effort is the introduction of quieter Chapter 3 commercial jet aircraft. In a few years the change over to these quieter aircraft will be complete and further large reductions at the source are not likely to occur. After noise reduction at the source, the most frequently recommended solution for reducing the negative impact of aircraft noise in buildings near airports, is increased sound insulation.
In Canada a widely accepted design procedure has been in use since the mid 1970s [11].
Unfortunately it is now largely obsolete. It is based on the spectra of older aircraft types and does not include sound insulation data for commonly used modern Canadian exterior façade
construction types. It is quite cumbersome to use and has never been systematically validated by measurements in a range of buildings near airports
This report is the first part of a project to produce a modern design procedure for insulating buildings against aircraft noise. It is intended to be a comprehensive review of current knowledge on the sound insulation of buildings. It discusses what is known concerning the basic principles, measurement procedures and measurement results from previously published studies related to building sound insulation. It is intended that this will provide a basis for planning the next part of this project: to develop a new, up to date, more accurate and easier to use design procedure.
Récemment, le Conseil national de recherches du Canada a procédé, pour le compte de
Transports Canada [1, 2, 3], à une étude sur le bruit émis par les aéronefs au Canada. La portée de cette étude, quoique assez vaste, a permis d’identifier qu’il était nécessaire d’améliorer les méthodes de calcul pour l’insonorisation des bâtiments contre le bruit émis par les aéronefs. Les niveaux de bruit émis par les aéronefs ont été considérablement réduits à la source au cours des 30 dernières années. Tous les efforts déployés mènent à l’apparition de jets commerciaux chapitre 3 plus silencieux. Dans quelques années, la transition à ces avions moins bruyants sera terminée et il ne devrait plus y avoir de grandes réductions du bruit à la source. La solution la plus souvent recommandée, après la réduction du bruit à la source, pour diminuer l’impact négatif du bruit émis par les avions dans les bâtiments situés à proximité des aéroports, est d’améliorer l’insonorisation des bâtiments.
Au Canada, une méthode de calcul consacrée a été utilisée depuis le milieu des années 70 [11]. Malheureusement, elle est maintenant en grande partie dépassée. Elle est fondée sur le spectre de types d’avions plus anciens et ne comprend pas de données sur l’insonorisation pour les types de construction habituellement utilisés au Canada pour les façades extérieures modernes.
D’utilisation assez lourde, cette méthode n’a jamais systématiquement été validée par des mesurages effectués dans un éventail de bâtiments situés à proximité d’aéroports.
Le présent rapport constitue la première partie d’un projet visant à créer une méthode de calcul moderne pour l’insonorisation des bâtiments contre le bruit émis par les aéronefs; son but est de présenter un examen exhaustif des connaissances actuelles sur l’insonorisation des bâtiments. Le rapport traite des principes de base, des méthodes de mesure et des résultats connus publiés dans des études antérieures portant sur l’insonorisation des bâtiments. Nous espérons que ce rapport servira de base à la planification de la prochaine partie du présent projet, soit l’élaboration d’une méthode de calcul qui soit nouvelle, à jour, plus précise et plus facile à utiliser.
Basic Concepts
(a) Transmission loss of limp panel
The transmission of sound through a partition is described by the transmission coefficient
τ which is defined as the ratio of transmitted to incident sound intensity,
τ = I2 / I1 (1)
where I1 is the incident sound intensity and I2 is the radiated intensity on the other side of the partition.
Sound transmission loss, TL, is the logarithmic version of the transmission coefficient expressing the ratio of the incident to transmitted intensities in decibels. The ratio is written as the incident intensity divided by the received intensity so that the transmission loss values are positive.
TL = 10 log [ 1/τ ] = 10 log [ I1 / I2 ], dB (2)
For a simple thin limp material one can derive a theoretical expression for the expected transmission loss at frequencies below the critical frequency of the material [4].
dB c fm TL( ) 10log 1 cos , 2 + = θ ρ π θ (3)
where f is the frequency of the sound (Hz) and m is the surface density of the panel (kg/m2). The symbols, ρc, are the characteristic impedance of air which is 415 mks Rayls at room temperature.
This equation indicates that transmission loss increases with the mass of the panel and
125 250 500 1000 2000 4000 0 10 20 30 40 50 78o 60o 4 5o 00 F ie ld incid e nce T ransm issio n Lo ss, d B F re qu e n cy, H z
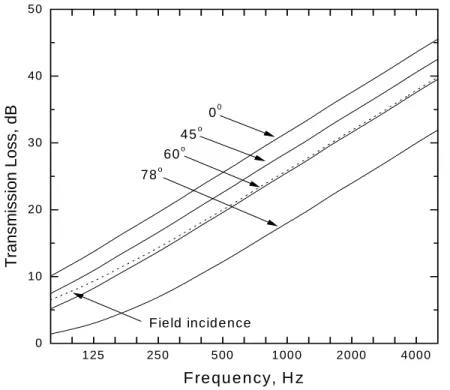
Figure 1. Theoretical mass law transmission loss versus frequency of a 2 mm thick glass panel for varied angle of incidence.
with frequency. As shown in the Figure 1, the transmission loss also varies with the angle of incidence θ. This is the angle between the normal (perpendicular) to the surface and the direction of the incident sound. For a given angle of incidence transmission loss increases 6 dB per doubling of frequency or per doubling of mass according to equation (3) which is often referred to as the mass law.
Figure 2 illustrates the variation of transmission loss with angle of incidence according to equation (3) for the same 2 mm glass panel as in Figure 1. The ‘Field incidence’ result is an average over angles from 0 to 78 degrees and is said to be a good approximation to measured results between pairs of reverberation chambers. Although sound fields in reverberation chambers are intended to be completely diffuse, in reality near grazing angles of incidence (i.e. close to 90° angles of incidence) are less likely to occur and hence the ‘field incidence’ result is representative of standard reverberation chamber tests of transmission loss.
There are several practical forms of the mass law equation that can be easier to use for particular situations. If one is concerned with only normal incidence sound (i.e. θ = 0 degrees), equation (3) simplifies to the following,
TL(0) = 20 log [ fm ] – 42.4, dB (4)
For ‘field incidence’ the following equation can be used.
TLf = 20 log [fm ] – 48, dB (5) 0 20 40 60 80 15 20 25 30 35 Field incidence T ran sm is s io n lo ss , dB
Angle of incidence, degrees
Figure 2. The variation of transmission loss with angle of incidence for the same panel as in Figure 1 and at 1000 Hz according to equation (3).
1 2 5 2 5 0 5 0 0 1 0 0 0 2 0 0 0 4 0 0 0 1 0 2 0 3 0 4 0 C o in c id e n c e d ip s 1 2 .5 m m 2 5 m m Tra n sm issio n Lo ss, d B F re q u e n c y , H z
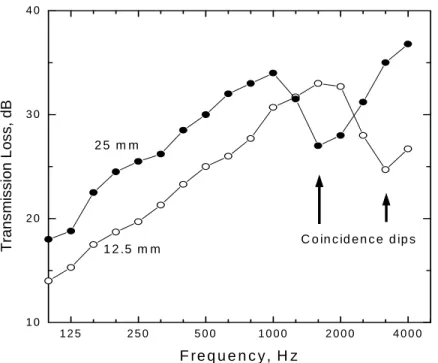
Figure 3. Measured transmission loss of 12.5 mm and 25 mm thick panels of gypsum board showing characteristic coincidence dips.
This is intended to predict the transmission loss of simple limp panels as measured in standard reverberation chamber tests.
(b) Transmission loss of real partitions
Although the transmission loss of many real panels approximately follows the mass law at lower frequencies, there is usually a dip in the transmission loss versus frequency curve referred to as the coincidence dip. This occurs around the critical frequency where the wavelength of the incident sound in air coincides with the wavelength of the bending waves in the panel. At and above this frequency energy is more easily coupled into the panel and hence the transmission loss is reduced. This produces a reduction or dip in the transmission loss of the panel over a range of frequencies from just below the critical frequency to an octave or more above.
Figure 3 illustrates the coincidence dip for gypsum board panels. For a 12.5 mm layer of gypsum board, the critical frequency is calculated to be 3120 Hz [19] which corresponds to the frequency of the dip shown in Figure 3 for the 12.5 mm layer of gypsum board. The critical frequency is influenced by the stiffness of the panel. Thus the transmission loss for the stiffer 25 mm thick layer of gypsum board shown in Figure 3 has a lower
frequency coincidence dip corresponding to a calculated critical frequency of 1560 Hz. Another characteristic feature of transmission loss versus frequency curves occurs for partitions with two layers separated by an air space. The combination of the mass of the two panels and the stiffness of the enclosed air leads to a resonance referred to as the mass-air-mass resonance. This resonance again makes it easier for sound energy to couple into the partition and hence leads to a dip or reduction in the transmission loss. In general multiple layered partitions are an effective method of getting improved
transmission loss. The mass-air-mass resonance can severely degrade the otherwise good performance of double layered partitions.
The frequency of the mass-air-mass resonance can be calculated with the following equation,
(6)
where: m1 is the mass per unit area of the first layer in kg/m2, m2 is the mass per unit area of the second layer in kg/m2, d is the separation of the layers in m,
K = 60 for an empty cavity and 43 for an absorption filled cavity. For heavier materials such as gypsum board and typical spacings between panels, the mass-air-mass resonance can severely limit the low frequency performance of a partition. Increasing the air space or the mass of the layers can sometimes lower this resonance to below the frequency range of interest. For lighter materials and smaller air spaces the mass-air mass resonance can have even larger effects on the overall transmission loss. Figure 4 illustrates measured results for a single 4 mm layer of glass and for double 4 mm layers separated by a 13 mm air space. Around the frequency of the calculated mass-air-mass resonance frequency (235 Hz), the transmission loss of the double glass is actually less than the single layer. Double glazing intended for improved thermal performance is often very similar to this double glass configuration. These results clearly illustrate how
Hz m dm m m K fmam ( ), 2 1 2 1+ = 125 250 500 1000 2000 4000 10 20 30 40 50 Mass-air-mass resonance Coincidence dip Tran smissin Lo ss, dB Frequency, Hz
Figure 4. Measured transmission loss for single 4mm glass (open circles) and two 4 mm glass layers separated by a 13 mm air space (solid circles).
this type of double glazing fails acoustically. Much larger air spaces are required to provide improved sound transmission loss.
(c) Multiple elements
The transmission loss of many real partitions is due to the sum of the sound transmission through several different components. For example a wall may also include a window or door with very different transmission loss than the wall construction. One can calculate the transmission loss of two or more combined components of a partition by summing the area-weighted transmission coefficients of the components. Equation (7) describes this process.
∑
∑
= i i i i i S Sτ
τ
(7)where τi and Si are the transmission coefficient and area of the ith component. The resulting transmission coefficient for the combined elements can then be converted to a transmission loss value in decibels using equation (2) above.
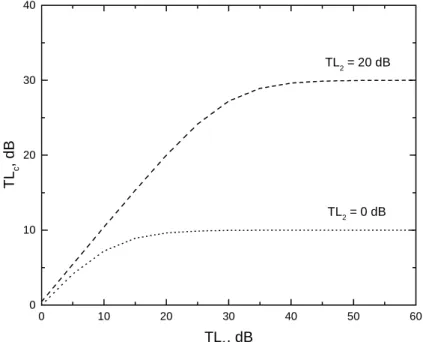
Figure 5 is a graphical illustration of the combined effects for partitions with two different components. The horizontal axis gives the transmission loss of the principal component which in these examples is 90 % of the total area. The vertical axis gives the total transmission loss of the combination of the two elements. Each curve on the graph is for a different second component but in both cases the area of the second component is 10% of the total area.
The upper curve is for the case where the second component has a transmission loss
0 10 20 30 40 50 60 0 10 20 30 40 TL2 = 20 dB TL2 = 0 dB TL c , dB TL1, dB
Figure 5. Illustrations of the combined transmission loss of two elements, where TL1 is 90 % of the total area and TL2 is 10%.
(TL2) of 20 dB. For example, this could be a door with an area of 10% of the total wall area. It is seen that no matter how much the transmission loss of the wall (TL1) is improved, the combined transmission loss never exceeds 30 dB.
The lower curve in Figure 5 would correspond to an opening (TL2 = 0 dB) with an area equal to 10% of the total wall area. In this case the transmission loss of the combination can never exceed 10 dB even when the transmission loss of the wall making up 90% of the area exceeds 60 dB transmission loss. Even quite small holes can quite severely limit the possible transmission loss of a partition. For example, a hole of only 1% of the total wall area would limit the maximum possible transmission loss of the construction to 20 dB.
(d) Holes, leaks and cracks
Small holes or cracks are known to limit the transmission loss of structures intended to be barriers to sound. When these holes are large their effect can be estimated by assuming they have a transmission coefficient of 1 (transmission loss of 0 dB) and calculating the combined transmission loss of the material and the hole as in the above example. When the holes are small then the effect varies systematically with frequency and depends on the particular dimensions of the crack or hole.
This has been examined both theoretically and experimentally. Gomperts and Kihlman [46] have developed a procedure that approximates the transmission of sound through a narrow slit. Wilson and Soroka [47] produced a procedure for predicting the
transmission loss of small circular apertures. The two theories indicate similar phenomena and have been corroborated by comparisons with measurements [48]. The transmission of sound through such small openings is controlled by a series of resonances that occur at frequencies where the panel, through which the hole is found, is an integral number of half wavelengths thick. For example, the middle graph in Figure 6 below corresponds to a 4.5 mm diameter hole through a panel that is 72.6 mm thick. This will have it lowest resonance where the panel is ½ wavelength thick or 2340 Hz. A series of resonances occur at integral multiples of this frequency. At these resonance
frequencies the transmission loss is negative. That is, the resonances amplify the sound passing through the panel at the resonance frequencies. At frequencies below the
frequency where the panel is ½ wavelength thick the transmission loss approaches that of a panel without a hole. Thus small holes will affect transmission loss most at higher frequencies.
As a small hole becomes wider in diameter it will approach the case of a large hole where resonance effects are negligible. In Figure 6 the larger diameter case (10.2 mm diameter) clearly shows that the resonant effects decrease with increasing frequency. In general when the hole is more than ½ wavelength in diameter, the resonant effects become negligible and the transmission loss approaches the 0 dB value expected for a large opening.
Similar patterns occur for long narrow slits. Again the thickness of the panel determines the frequency of the resonances. However, the pattern of resonances does not extend clearly to higher frequencies as found for circular holes. That is, the transmission loss
approaches the 0 dB value expected for large openings more rapidly (i.e. at lower frequencies).
Figure 6. Measured transmission loss of 4.5 mm and 10.2 mm diameter apertures of different lengths and comparison with the Wilson-Soroka equation (dash dot line) [from reference 48].
2.
Measurement Methods
(a) Reverberant room tests
The sound transmission loss of partitions is most commonly measured by constructing the partition between two reverberation chambers. Standard test procedures such as ASTM E90 [5] and ISO 140 [6] prescribe in detail how such measurements are to be made. These tests are based on the assumption of having an approximately diffuse sound field in the reverberation chambers. Under these conditions all angles of incidence are expected to be equally likely to occur. Thus standard tests approximate random
incidence conditions. For such ideal conditions the transmission loss in each frequency band can be measured using the following equation.
TL = L1- L2 + 10 log[S/A], dB (8)
Where L1 and L2 are the average levels in the source and receiving rooms
respectively, S is the area of the test partition in m2 and A is the sound absorption in m2 in the receiving room.
Sometimes the average level difference L1- L2 is referred to as the noise reduction NR. While the transmission loss TL measures only the sound attenuation properties of the partition, the noise reduction is also influenced by the sound absorbing properties of the receiving room.
To obtain the values of L1 and L2, sound levels must be measured at a number of
locations throughout the room. The total absorption in the receiving room A is obtained by measuring the reverberation time in the receiving room. The standards require the measurements to be made in 1/3 octave bands from 125 to 4000 Hz for ASTM E90 and from 100 to 3150 Hz for ISO 140.
(b) Outdoor to indoor measurements
For sound propagation from outdoor sources, one can usually assume that the outdoor incident sound consists of approximately plane waves at some particular angle of incidence. Equation (9) below [7, 8] relates the transmission loss to the area of the partition S in m2, the total absorption in the receiving room A in m2 and the angle of incidence θ.
TL = L1 – L2 + 10 log(4S cos θ/ A) + k, dB (9)
L1 is the outdoor incident sound level and L2 is the indoor received level. The constant k depends on the location of the outdoor microphone used to measure L1. If the
microphone is placed against the façade of the building the direct and reflected sound will be coincident and will add together in phase to produce a 6 dB increase in the measured outdoor levels. If the outdoor microphone is further away a 3 dB energy doubling is expected. Finally if the microphone is located so as not to include any significant reflected sound energy there will be no increase in the value L1. The table below summarises the appropriate values of k for each type of microphone location.
k = 0, dB L1 does not included reflected sound.
k = -3, dB L1 measured 2 m from façade and includes reflected sound energy.
k = -6 dB L1 measured at façade and includes pressure doubling effect.
An outdoor-to-indoor transmission loss measurement can be made with natural sources such as actual aircraft or by using loudspeaker sources. ASTM procedure E966 [8] and ISO standard 140 part V [7] describe standardised procedures for these types of
measurements. The loudspeaker must be located to produce a particular angle of incidence (both standards recommend 45 degrees). Using a loudspeaker test source provides a much more controlled test with more repeatable results than using aircraft as noise sources. Although the use of a loudspeaker source provides potentially more accurate results, there are several practical problems with this method. The loudspeaker source must reproduce very high sound levels so that the levels indoors are adequately above existing ambient noises for accurate measurements. Such levels are difficult to produce and will tend to cause widespread disturbance in the neighbourhood.
(c) Indoor to outdoor measurements
An alternative approach is to measure the building façade attenuation in the reverse direction. This approach was initially proposed by Mulholland [9] and further developed by Sharp [10]. By placing the sound source inside and measuring the resulting sound levels outside the problem of disturbing neighbours is avoided. The effects of varying angles of incidence of aircraft noise are assessed by varying the position of the outdoor microphone. This is much easier to do than to vary the position of an outdoor
loudspeaker source.
Sharp [10] has shown how the results of this approach can be very approximately related to those of the conventional approach with the sound source outdoors. His calculations include many approximations and his measurement results indicate a ± 2 dB standard deviation of the agreement between the two measurement approaches.
(d) Aircraft source spectra
The transmission of outdoor sounds into a building is very much dependent on the shape of the source spectrum. As aircraft have become quieter, the shape of the spectrum of the aircraft noise has changed greatly. In determining the attenuation of building façade components it is very important that the source spectrum is representative of modern aircraft noise. As the noisier chapter 2 aircraft are currently being phased out of service in Canada, the characteristics of a representative spectrum are changing too.
Figure 7 gives examples of modern aircraft noise spectra compared to the source
spectrum used in the CMHC Guide[11]. The CMHC Guide spectrum was intended to be representative of aircraft noise in about 1970. The newer measurements have quite different spectrum shapes with relatively more very low frequency energy but much less higher frequency sound energy. The measurements at schools near Pearson Airport in Toronto [12], obtained in 1991, have a spectrum very similar to results published by Barnhardt [13] in 1992. Barnhardt’s measurements were made near Stapleton Airport, Denver. The Pearson data seem to be contaminated by ambient noise in the highest
frequency bands and have higher levels in the lowest frequency bands than Barnhardt’s data. This greater low frequency sound energy may be due to a different mix of aircraft types being included in the two samples. Overall, the two average spectra are remarkably similar and suggest that it is possible to characterize a typical spectrum shape.
The measurements near Pearson airport [12] were made for 10 or more flybys at 12 different sites. From this combined data the overall mean and the mean ± 1.0 standard deviation were calculated and included in Figure 7. These give an indication of the variation of typical aircraft noise spectra.
(e) Single number ratings
Sound transmission loss is normally measured in 1/3 octave frequency bands. This provides 16 different sound transmission loss values. There is a need for a convenient single number rating for rank ordering the attenuating properties of partitions. For
interior partitions the ASTM Sound Transmission Class rating, STC, [14] and the ISO Rw [15] ratings are very widely used. Both procedures are very similar and involve adjusting a rating contour relative to the measured 1/3 octave transmission loss values, according to a set of rules, to obtain a result that is representative of the overall transmission loss of that particular partition.
63 125 250 500 1000 2000 4000 8000 30 40 50 60 70 80 90 Pearson schools CMHC AVG -1 STD +1 STD Barnhardt SPL, dB Frequency, Hz
Figure 7. Comparison of aircraft noise spectra from the CMHC guide [11], measurements at schools near Pearson airport [12] and measurements by Barnhardt [13].
It is generally accepted that the STC and Rw ratings are only suitable for common indoor noise sources such as speech and office equipment. As a result, two other procedures have been proposed to provide single number ratings of exterior facade elements. These are the Exterior Wall Rating system (EWR) and the Outdoor-Indoor Transmission Class rating (OITC). The EWR proposal is similar to the STC method but uses a different set of rating contours [17]. These contours were developed to better include the effects of low-frequency environmental noise and were based on a spectrum that was intermediate to aircraft and road traffic noise.
The OITC procedure has been standardised in the United States [16]. This procedure uses a specific source spectrum and measured 1/3 octave transmission loss values to calculate the expected indoor A-weighted sound level. The ISO 717[15] single number rating procedure now includes corrections that can be used to estimate the effects of different source spectra.
All of these procedures depend on the actual source spectrum that is used. However, it is not clear that the source spectra used or implied in each method are a good approximation to typical aircraft noise nor whether there can be a single spectrum shape that is
adequately representative of all types of aircraft noise. Figure 8 compares the source spectra from the CMHC Guide [11] and the OITC standard [16] with the average of measurements at schools near Pearson airport. For easy comparisons, the overall levels of the spectra have been adjusted to be equal at 1000 Hz. The measured data near
63 125 250 500 1000 2000 4000 8000 30 40 50 60 70 80 90 Pearson schools OITC CMHC SP L, dB Frequency, Hz
Figure 8. Comparison of source spectra from the CMHC Guide [11]. The OITC standard [16] and the average of measurements near Pearson Airport in 1991 [12].
Pearson airport were obtained in 1991 and are representative of a mix of modern aircraft. The measured spectrum includes much less high frequency energy than the other two spectra. The source spectrum from the CMHC Guide is representative of much older aircraft types and includes less very low frequency energy and much greater higher frequency energy. The OITC source spectrum is intended to be an average of aircraft, road traffic and train noise sources. It is similar to the measured aircraft noise at mid frequencies but includes greater energy at lower and higher frequencies. These are very different source spectra and must lead to different single number ratings of façade attenuation.
Although all of these single number rating procedures are intended to give a rank
ordering of façade transmission loss that would agree with subjective ratings, none of the procedures were derived from controlled subjective experiments. They are only sensible suggestions that should relate reasonably well to actual subjective ratings. There is an obvious need to compare and evaluate the various ratings in controlled subjective tests before they are used to rate the performance of many thousands of dollars of
3.
Walls
There are very few published examples of measured transmission loss of exterior wall constructions. While there are extensive laboratory measurements of interior wall constructions [18], and a good overall understanding of the important parameters [19], there are very few examples of laboratory measurements of exterior walls. The results that are available represent constructions that would not be commonly used in Canada today [20]. There are examples of field measurements, but they either only report overall A-weighted level reductions[11, 21] or are related to a combination of façade elements [22, 23] and do not separately identify the transmission loss of the wall component. In general, laboratory measurements can provide more precise measurements of transmission loss. However, the laboratory measurements are representative of
approximately randomly incident sound. As described in Section 2, corrections can be added to these values so that they are representative of a particular angle of incidence. Field measurements are inevitably less precise. It is difficult to obtain the same carefully controlled conditions in the field. When aircraft noise is used as the sound source, each flyby will produce different transmission loss values due to variations in source spectrum and source position. Even the average results of complete flybys can vary considerably.
EW1 12.7 mm gypsum board, vapour barrier, 2” by 4” (38 by 89 mm) wood studs, 50 mm glass or mineral fibre insulation in cavity, sheathing, wood or metal siding EW2 12.7 mm gypsum board, vapour barrier, 2” by 4” (38 by 89 mm) wood studs, 50
mm glass or mineral fibre insulation in cavity, 25-50 mm rigid insulation, wood or metal siding and fibre backer board.
EW4 12.7 mm gypsum board, vapour barrier, 2” by 4” (38 by 89 mm) wood studs, 50 mm glass or mineral fibre insulation in cavity, sheathing and 20 mm stucco. EW5 12.7 mm gypsum board, vapour barrier, 2” by 4” (38 by 89 mm) wood studs, 50
mm glass or mineral fibre insulation in cavity, sheathing, 25 mm air space, 100 mm brick veneer.
EW4R 12.7 mm gypsum board on resilient clips, vapour barrier, 2” by 4” (38 by 89 mm) wood studs, 50 mm glass or mineral fibre insulation in cavity, sheathing and 20 mm stucco.
EW6 12.7 gypsum board, 100 mm concrete block, 25-50 mm rigid insulation 25 mm air space, 100 mm brick veneer.
EW5R 12.7 mm gypsum board on resilient clips, vapour barrier, 2” by 4” (38 by 89 mm) wood studs, 50 mm glass or mineral fibre insulation in cavity, sheathing, 25 mm air space, 100 mm brick veneer.
EW7 12.7 mm gypsum board, 25-50 mm rigid insulation, 140 mm block, 100 mm face brick.
EW8 12.7 mm gypsum board, 25-50 mm rigid insulation, 200 mm concrete. Table 1. Wall constructions included in the CMHC Guide [11].
The CMHC Guide [11] for insulating homes against aircraft noise included A-weighted attenuations for a limited number of types of wall constructions. These data were obtained directly or indirectly from field measurements using actual aircraft noise as a sound source. These constructions are listed in Table 1. The wood frame constructions included only 2” by 4” (38 by 89 mm) wood studs. These are rarely used in modern constructions that typically include thicker thermal insulation. Many of the details and materials are no longer in use.
While laboratory measurements of exterior wall sound transmission loss were only found for older types of constructions, these results give some indication as to what to expect for more modern walls. They also help to determine the important parameters that should be considered in new tests. In the early 1970s a series of building façade elements were tested in the USA [20]. The results for the more relevant wall constructions are included in Figures 9, 10 and 11. In all cases the basic construction was 2” by 4” (38 by 89 mm) wood studs.
Figure 9 compares constructions with a wood siding exterior cladding. In both cases the interior surface was 12.7 mm gypsum board, but in one case the gypsum board was mounted on resilient channels. As would be expected, the addition of resilient channels has a significant improvement on the measured transmission loss.
Figure 10 shows a similar comparison for walls with an exterior stucco construction. Again the addition of resilient channels has a significant improvement to the measured transmission loss values at almost all frequencies. Mounting the gypsum board on
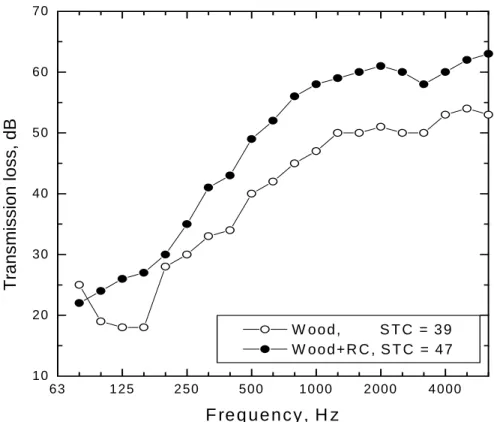
63 1 25 2 50 500 10 00 2 000 4 000 10 20 30 40 50 60 70 W o o d , S T C = 3 9 W o o d + R C , S T C = 4 7 Tr a n smissi o n loss, dB F re q u e n c y , H z
Figure 9. Measured transmission loss of wood stud constructions with wood siding. (from Figure 20 reference [20].
63 125 250 500 1000 2000 4000 10 20 30 40 50 60 70 S tucco, S T C = 46 S tucco+R C , S T C = 57 Tra n smiss io n lo ss, dB F requency, H z
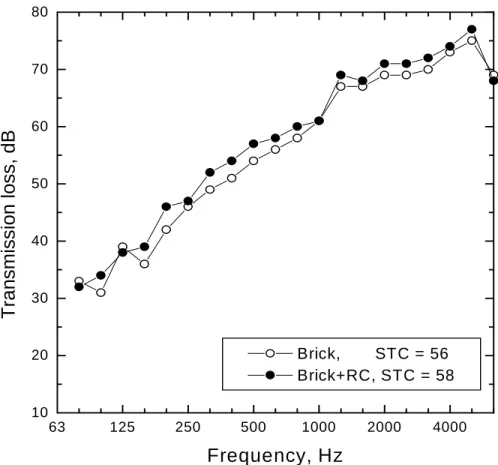
Figure 10. Measured transmission loss of wood stud constructions with stucco exterior. (from Figure 19 reference [20]. 63 125 250 500 1000 2000 4000 10 20 30 40 50 60 70 80 Brick, STC = 56 Brick+RC, STC = 58 Tran smissio n lo ss, dB Frequency, Hz
Figure 11. Measured transmission loss of wood stud constructions with brick veneer exterior. (from Figure 18 reference [20].
resilient channels creates a vibration break between the interior and exterior surfaces and substantially improves the overall performance of these double layer constructions. Similar comparisons are made in Figure 11 for a brick veneer wall on the same wood studs. Again mounting the gypsum board on resilient channels increases the transmission loss but the increase is much smaller than in the previous two figures. The brick veneer is a quite heavy construction which naturally has quite high sound transmission loss. In this case, the added benefit of the resilient channels is relatively small. This may have been because the brick layer was already vibrationally separated from the rest of the construction.
4.
Windows
Windows are one of the most critical components of a building façade in that it is difficult to design them to have high sound transmission loss while also fulfilling their function as a window. Of course this problem becomes particularly acute if it is intended to also open a window that is exposed to significant levels of outdoor noise. Because windows are often the weak link in the building façade, there have been many studies of the sound transmission loss of windows. Earlier reviews found, at times, a confusing and not completely consistent range of results [27-29]. More recent work has developed a good understanding of many of the important parameters influencing the sound transmission loss of windows.
(a) Effects of glass thickness and air spaces between multiple layers
Perhaps the most important parameters for determining the sound transmission loss of windows are the thickness of the glass and the spacing between multiple panes of glass. Very simply, thicker panes of glass have greater mass per unit area and hence the mass law (see section 2(a)) would indicate that transmission loss should increase with the thickness of the glass. Figure 12 shows measured transmission loss results for 3, 4 and 6 mm thick glass panes. As expected the transmission loss values at most frequencies systematically increase with increasing thickness of the glass. However, the changes in transmission loss are complicated by shifts in the frequency of the coincidence dip. As the glass gets thicker (and stiffer) the coincidence dip moves to lower frequencies. For the 3, 4 and 6 mm thick glass panes the corresponding critical frequencies were
calculated to be 5067, 3800 and 2533 Hz which are in good agreement with the dips in
125 250 500 1000 2000 4000 10 20 30 40 Coincidence dips 3 mm 4 mm 6 mm Tra n smi ssio n L o ss, dB Frequency, Hz
Figure 12. Measured transmission loss of 3, 4 and 6 mm thick single layers of glass.[24].
the measured transmission loss values in Figure 12.
Double layers of glass with an air cavity between them can be considerably more effective than the same weight of glass in a single layer. Unfortunately the potential improvement is often limited by the mass-air-mass resonance (see section 2(b)). For common thicknesses of glass and practical air spaces, the mass-air mass resonance occurs at frequencies where high transmission loss would normally be required. Figure 13 shows calculated mass-air-mass resonance frequencies for three thicknesses of glass as a function of the separation between the two panes. It is seen that for windows it is difficult to lower this resonance frequency below the frequency range of concern. Even with two 6 mm thick glass panes separated by a 200 mm air space, the resonance can only be reduced to 50 Hz.
Figure 4 compared measured transmission loss values for single and double 4 mm glass panes. Although the double glass construction had considerably improved performance in many frequency bands, the combined effects of the mass-air-mass resonance and the coincidence dip produce quite complex results. It is not possible to accurately predict the transmission loss of such double (or triple) glass windows but many combinations of glass thickness and air space have been measured in an extensive measurement study [24]. Some of these measurements are summarised in terms of the single number STC rating in Figure 14. Data are included for double layers of 3, 4 and 6 mm glass as a function of the separating distance between the two panes. STC values increase approximately 3 dB for each doubling of the separation between the two panes and for the larger spacings quite substantial STC values can be achieved.
0 50 100 150 200 0 100 200 300 400 3 mm 4 mm 6 mm FMA M , H z Separation, mm
Figure 13. Calculated mass-air-mass resonance frequencies for double layers of glass with varied air space separating the two equal panes (according to equation (6)).
Triple glazing has been reported to have approximately the same performance as a double window with the same total thickness and mass [19]. Thus the complexity of triple glazing is generally not justified for achieving improved sound transmission loss. Double windows have been developed with special heavy gases in the cavities. Measurements have shown these windows may have improved transmission loss at mid frequencies [19].
(b) Laminated glass
Laminated glass is created by bonding two or more layers of glass together with thin plastic interlayers. This increases the damping of the bending waves in the glass and so can increase the transmission loss in the region of the coincidence dip. As seen from the examples of Figures 4 and 10 the coincidence dip can cause a significant reduction of the transmission loss of the glass. This is especially a problem for thicker glass for which the coincidence dip can occur at important mid frequencies. Experimental results [19] have confirmed the improvements possible in the coincidence dip region with laminated glass. A recent study considered how the properties of the interlayer material affect sound transmission loss [25].
(c) Angle of incidence effects and measurement problems
The mass law predicts (see Figure 1) that sound transmission loss varies systematically with the angle of incidence of the incident sound. Transmission loss is expected to be greatest for normal incidence and least for grazing incidence. As Figure 1 illustrates,
10 100 30 35 40 45 50 3-x-3, mm 4-x-4, mm 6-x-6, mm ST C , dB Separation, mm
Figure 14. Measured STC values of double glass windows as a function of the separating air space for 3, 4 and 6 mm thick glass (reference [24]).
results for a 60 degree angle of incidence are expected to best approximate random incidence laboratory results. Extensive field measurements of a variety of windows and varying angles of incidence confirmed the expected variations of transmission loss with angle of incidence [30]. However, measured results for a 45 degree angle of incidence were found to best resemble laboratory (random incidence) test results.
Jonasson and Carlsson made many field measurements of window transmission loss to develop a standard test method [31]. They confirmed significant variations of
transmission loss with angle of incidence. It was concluded that results obtained with a 60 degree angle of incidence best approximated laboratory (random incidence) results. Differences between the results for 45 and 60 degree angles of incidence were small, and they recommended a 45 degree angle of incidence in the test method. At low frequencies they found differences of up to 10 dB between the field test results and laboratory results. They also found that ground reflections could have large effects on the measured
transmission loss (up to 10 dB) depending on the location of the loudspeaker test source. Locating the loudspeaker test source on the ground was recommended so that direct and ground-reflected sound arrive at the same time. This avoids spurious changes to the spectrum of the incident sound. Windows are often located in a recess in the face of the building façade. The acoustical properties of such recesses were found to have only small effects on measured transmission loss [31].
Schumacher and Mechel [32] state that differences between laboratory (random incidence) and field measurements of windows are in the ±5 dB range. They again recommend a 45 degree angle of incidence as is included in the ISO 140/V standard [8] for field measurements. They also mention an “open-closed” method in which the difference between indoor levels with the window both open and closed are measured. They point out that this method leads to significantly higher sound transmission loss values and is not recommended.
(d)Edge conditions and mounting effects
Glass is a material with very low internal damping. However, when mounted in a window frame the damping is greatly increased. Thus damping of vibrations at the edge of each pane of glass is an important energy loss and is therefore expected to affect the sound transmission loss of complete windows. Because this damping will affect bending waves in the glass, the maximum effects on transmission loss are expected to occur at and above the critical frequency where the coincidence dip normally occurs (see section 2(b)).
Damping can be measured using one of two approaches. In the frequency domain one can measure the relative width of resonance peaks,
η = ∆f / fres (7)
where ∆f is the bandwidth of the resonance to the 3 dB down points fres is the resonance frequency, Hz
Alternatively in the time domain, one can measure the decay time after excitation has ceased. This is usually defined in terms of the reverberation time of the glass, that is, the time for the decay to decrease by 60 dB.
Alternatively then damping is defined as follows,
η = 2.2/(T fres) (8)
where T is the reverberation time of the glass in seconds.
Measurements of heavy glass in different mountings [33] showed the transmission loss values to vary as much as 10 dB near the coincidence dip for different methods of mounting the glass in the frame. They also showed that Cremer’s theory [34] provided reasonable estimates of the expected effects of differing amounts of edge damping. A second investigation compared the effects of mounting glass in neoprene with mounting it in putty [35]. Figure 15 shows results from this study for single layers of 6.4 mm glass. As expected the largest differences are in the region of the coincidence dip. Figure 16 shows further results from the same study for two layers of 6.4 mm glass separated by an air space. The difference between neoprene and putty mounting is as much as 15 dB in the coincidence dip region.
Utley and Fletcher [35] identified three mechanisms whereby the edge conditions would influence the measured transmission loss of the window. These were: (a) edge damping, (b) edge restraint, and (c) edge transmission. The internal damping of glass was said to have a value of about 0.001 but their measurements of glass in frames had damping values of about 0.05. The increased damping would contribute to energy losses and hence increase measured transmission loss values. Edge restraint affects the modes of vibration that can exist in the glass. The neoprene mounting was said to approximate ‘simply supported’ conditions but putty was intermediate to ‘simply supported’ and ‘clamped’ edge restraints. Transmission of vibrational energy via the frame or edge
125 250 500 1000 2000 4000 20 30 40 50 60 Neoprene Putty T ran sm ission Lo ss, d B Frequency, Hz
Figure 15. Measured transmission loss for single 6.4 mm glass mounted in either neoprene or putty [35].
transmission was also thought to contribute significantly to the measured transmission loss of real windows. The results in Figures 15 and 16 were from field measurements and may include a combination of all of these possible mechanisms.
More controlled model studies [36] have confirmed that the effects of damping are most pronounced in the region of the coincidence dip and that Cremer’s theory predicts the behaviour of single panes of glass quite well. They also found clear effects of pane size such that smaller panes appeared to have larger damping and hence greater transmission loss values in the coincidence dip frequency region. They also quote damping values for putty mounting of glass of about 0.05. In a second model study [37] of double glass, theoretical predictions were not successful in predicting the transmission loss of the windows with two layers of glass separated by an air space. They attributed this to the fact that the theory did not include the energy transmitted vibrationally via the window frame.
Recent work in Japan [38] measured damping as a function of frequency for a wide range of thicknesses of glass and included some examples of laminated glass. Damping varied with frequency and increased with glass thickness. Laminated glass has higher damping than the same thickness of unlaminated glass.
Rehfeld [39] investigated the cause of differences in window transmission loss results from different laboratories. Numerical model techniques were used to determine expected effects of edge conditions due to different mounting techniques. Variations in stiffness of the boundary conditions could shift the frequencies of vibrational modes of the glass and change the matching of these modes to the modes of the reverberant test chambers. 1 2 5 2 5 0 5 0 0 1 0 0 0 2 0 0 0 4 0 0 0 1 0 2 0 3 0 4 0 N e o p re n e P u tty Tr a n smission L o ss , dB F re q u e n c y , H z
Figure 16. Measured transmission loss for double 6.4 mm glass mounted in either neoprene or putty [35]. The neoprene case had a 135 mm cavity and the putty case had a 175 mm cavity.
(e) Open windows and window seals
Although it is often desirable to open windows for ventilation purposes, this will
inevitably reduce the sound transmission loss of the window. Several studies have made systematic measurements of the transmission loss of open windows in an attempt to find a compromise that provides both ventilation and sound attenuation.
Ford and Kerry [40] carried out extensive laboratory measurements of the sound
transmission loss of both double and single windows with varied openings. As expected the transmission loss decreased as the window opening increased. They also calculated the expected overall noise reduction for an aircraft noise spectrum. An example of these results is shown in Figure 17. This plot shows the A-weighted noise reduction of aircraft noise for window openings from 0 to 200 mm for both single and double windows. Three double window cases are shown in this figure corresponding to 25, 50 and 200 mm air spaces between the two glass panes.
Even a quite small opening reduces the noise reduction by 10 dB or more. However, an open double window can have 10 dB more noise reduction than an open single window. For openings of approximately 25 mm, an open double window can perform as well as a closed single window.
In a second study [41] the effects of open windows were measured in the field with aircraft noise and road traffic noise as the source. Similar trends as illustrated in Figure 16 were again found. The complete façade transmission loss values measured in the field were 1 to 3 dBA greater than found in laboratory tests of the same constructions.
0 50 100 150 200 0 10 20 30 40 50 Single Double, 200 m m space Double, 50 m m space Double, 25 m m space N o is e R e d u c tio n, dB A W indow Opening, mm
Figure 17. Noise reduction of aircraft noise for single and double windows as a function of the size of the window opening [40]
A measurement study in Australia [42], using road traffic noise as the sound source, found similar trends with opening size, but also concluded that the wall construction also influenced the combined transmission loss of walls containing the open windows. They also demonstrated that double windows with staggered openings had much greater transmission loss than double windows with non-staggered openings. Their results suggested that noise reductions of approximately 20 dBA are possible for double windows with staggered openings and absorbent reveals. In comparing laboratory and field measurements, they found higher transmission loss values in the laboratory results in contradiction to the findings of Kerry and Ford [41].
Openable windows may still have reduced sound transmission loss even when closed because of imperfect seals. It is difficult to characterize the typical effects of leaks due to imperfect seals because there can be so many different types of seals and seal failures. With increasing concern for the air-tightness of buildings for thermal efficiency, there is some hope that modern Canadian windows will have improved seals and hence better sound attenuating properties.
Figure 18 gives some examples of the magnitude of effects that are possible due to imperfect window seals. This figure compares measured transmission loss for sealed windows with locked and unlocked wood and aluminum frame double-hung windows. The effects of leaks due to imperfect seals are greatest at higher frequencies and in some cases can be quite large. This larger effect at higher frequencies corresponds with theoretical expectations for small leaks as discussed in section 2(d).
125 250 500 1000 2000 4000 10 20 30 40 50 Sealed Wood, locked Wood, unlocked Aluminum, locked Aluminum, unlocked Tr ans mi s s io n L oss , dB Frequency, Hz
Figure 18. Comparison of measured sound transmission loss for sealed and unsealed windows of 11 mm (7/16”) glass [20].
(f) Interior absorption
Several studies have reported improvements in the sound transmission loss of double windows when absorption is added in the space between the two panes of glass
[24,37,41]. Although the absorbing properties of the added material are important to the resulting improvement in transmission loss, there seem to have been no systematic studies to determine the optimum material to add to the window reveals.
Kerry and Ford [41] tried two materials with typical absorption coefficients of 0.3 and 0.6. They reported that the higher absorption material lead to approximately 2 dBA greater sound insulation for open windows.
Model studies [37] found absorbent reveals increased transmission loss at most
frequencies but had the greatest effect in the coincidence dip region. The improvements were greatest for double windows with initially lower transmission loss. For two layers of 4 mm glass separated by a 50 mm air space adding absorption had an average effect of a 4 dB improvement in transmission loss.
Helmholtz resonators can provide absorption over a very narrow frequency band. A recent study [43] added this type of absorber to improve the transmission loss of a double window to low frequency noise with strong tonal components in the region of the mass-air-mass resonance of the window. Calculated and measured results showed large increases in insertion loss when the resonantors were tuned to the same frequency as the mass-air-mass resonance frequency. However, small increases in transmitted sound occurred at adjacent frequencies.
(g) Active control
Active control of sound has been successfully exploited in acoustically simple sound fields. For example, systems are commercially available that provide low frequency sound attenuation in ducts where the sound field is essentially one-dimensional. The signal from a microphone at one point in the duct is amplified and radiated back into the duct at another point so that it is out of phase with the sound in the duct. The resulting cancellation can substantially reduce levels of low frequency sound in ducts. Similar approaches have been successful in other acoustically simple situations such as outdoors but in most indoor spaces it is much more difficult to obtain significant attenuations using active control techniques.
There have been recent preliminary attempts to use active control to improve the low frequency sound transmission loss of windows. Sensor microphones and special
loudspeakers to radiate the canceling sound were located in the cavity between two layers of glass. After optimising the location of the microphones and loudspeakers, reductions of between 5 and 10 dB were obtained in the frequency range up to 160 Hz in one study [44]. A second study also found low frequency improvements and claimed that traffic noise would be further reduced 4 dB by the active control mechanism [45]. There is some hope that these techniques could counter the unwanted effects of the mass-air-mass resonance that tends to reduce sound transmission loss at lower frequencies.
(h)Other problems
The basic principles of sound transmission through windows are quite well understood. The effects of the mass of the glass and the air space between double panes have been
well documented as described in the previous sections. However, there are a number of other factors that are known to influence the sound transmission loss of the windows but which are difficult to quantify without careful measurements of each particular window. These other factors would include seals and edge conditions. The only way to be sure of the effectiveness of window seals is to perform a sound transmission loss test on the window with the seals. This result may not be representative of the window after it has been used for some time. Use of the window may degrade the seals but the effect is not easily predictable.
The manner in which the glass is mounted in the frame is known to influence the resulting transmission loss. More resilient materials can provide more damping to the vibrations of the glass and hence lead to increased transmission loss. Again it is difficult to precisely estimate the effect of a particular material without carrying out sound
transmission loss tests.
The material used to mount the glass in the frame will also influence the amount of energy that is transmitted vibrationally through the window frame. This path effectively bypasses the window and hence can reduce its effectiveness. The relative importance of transmission via the window frame has not been clearly established and must depend on the details of the particular design. One would expect that windows that are divided into smaller panes would have more edge connections and hence greater transmission of energy via the window frame. Thus these effects might be expected to be related to the perimeter to area ratio of the panes of glass.
These problems need further investigation so that we can more accurately estimate the expected sound transmission loss of particular windows.
5. Doors
Like openable windows, the sound transmission loss of doors depends on both the construction of the door and on the seals around the perimeter of the door. Door panels frequently have two surface layers separated by a cavity and so may behave like other double panel constructions. Plots of transmission loss versus frequency may include mass-air-mass resonance dips due to the mass of the surface layers and the depth of the cavity as well as coincidence dips due to the vibrational properties of the surface layers. The internal structure connecting the two surface layers could also affect the sound attenuating properties of the door. However, without effective perimeter seals, a door is unlikely to have substantial transmission loss.
Figures 19 and 20 show the results of systematic tests of the effectiveness of various seals with wood and steel single doors. The results in Figure 19 show measured sound
transmission loss values for a single solid core wood door. The lowest curve is for a door without seals. The two middle curves show the same door with either closed cell foam weather stripping seals or magnetic seals (as found on refrigerator doors). The upper curve corresponds to the door completely sealed shut with heavy tape and hence represents the limiting transmission loss of the door panel with no leaks. The unsealed door had an STC of only 22 but the completely sealed door had an STC of 31.
Figure 20 shows similar results for a hollow core steel door. In this case adding seals has an even greater effect, increasing the STC from 17 for the unsealed door to 35 for the completely sealed door. In both cases, the largest effects of the seals are at higher
frequencies as would be expected from the known effects of small cracks on transmission loss (see section 2(d)).
63 125 250 500 1000 2000 4000 0 10 20 30 40 50 60 No seals Foam seals Magnetic seals Taped Tran sm iss ion Los s, d B Frequency, Hz
Figure 19. Measured transmission loss of a single solid core wood door with varied seals [49].
Other published results give similar results and show that the transmission loss of doors depends on the mass of the door panel and on the perimeter seals [49, 50, 20]. One very recent study [51] examined the combined effects of improved seals and improved internal design of a door on the resulting sound transmission loss. Structural connections between the two surface layers and an excess of absorbing material in the door cavity were found to reduce the transmission loss of the door.
The results in Figures 19 and 20 give representative transmission loss values of typical single doors. The exact transmission loss of particular doors can only be determined by direct measurement. However, it is reasonable to assume that with some wear the sound insulating properties of the door seals will be diminished and that single doors cannot be counted on to reliably provide high transmission loss.
Substantial improvements in sound transmission loss can be achieved by using double doors separated by a small air space [49]. Figure 21 below gives one example of double doors both with and without magnetic seals. For this double door example the addition of the perimeter seals increases the STC rating from 34 to 49. Thus even without seals this double door construction has higher transmission loss than the single doors with seals in Figures 19 and 20. Other results show that in general increasing the air space between the two doors leads to improved sound transmission loss. Further improvements can be achieved by adding sound absorbing material in the space between the two doors. This would typically imply the addition of a sound absorbing surface to at least one of the doors.
In some cases it may not be acceptable to have two doors close together. An alternative approach is to have two doors separated by a small vestibule. Since this corresponds to a
63 125 250 500 1000 2000 4000 0 10 20 30 40 50 60 No seals Foam seals Magnetic seals Taped Tra n s m is sion Lo ss , dB Frequency, Hz
much larger air space between the two doors improved acoustical performance is expected. 63 125 250 500 1000 2000 4000 10 20 30 40 50 60 70 No seals Magnetic seals T ransm ission Loss, dB Frequency, Hz
Figure 21. Measured transmission loss of double door with and without magnetic seals [49].
6. Roofs
Although there are many measurements of the overall noise reductions of exterior noise by buildings, there is unfortunately very little data indicative of the sound transmission loss of roof structures. It is difficult to identify the separate effects of the roof and ceiling structure and as a result little information is available that is representative of typical North American roof structures. One Canadian study [22] gave the A-weighted noise reduction of aircraft noise by three types of roof-ceiling structures. A flat built-up roof had a noise level reduction of 44 dBA, a peaked roof with a ventilated attic 51 dBA and a peaked roof with a non-ventilated attic had a 54 dBA aircraft noise reduction.
A British study [52] attempted to improve a roof-ceiling construction that initially
consisted of a tile roof with a lath and plaster ceiling. Adding 75 mm of glass fibre sound absorbing material increased the reduction of aircraft noise by 4 dBA. However, this improvement was only possible after the transmission loss of other elements including windows and chimneys were considerably improved.
Another British study [53] again found added absorption in the attic space to increase the overall noise reduction. By installing absorbing material covered with plasterboard panels in the attic space, the noise reduction of aircraft noise increased from 40 to 45 dBA. They reported flanking sound transmission paths in the regions near the eaves and had to install additional layers of insulation and plasterboard to the interior of the room to block this path. However, neither of these types of constructions would be commonly found in Canada.
Transmission loss results for various types of thermal insulation on corrugated steel roof decking have been reported [54]. This type of roof exhibited quite low sound
125 250 500 1000 2000 4000 8000 0 10 20 30 40 50 60 70 Plasterboard Plasterboard + 74 mm absorption T ran s m is s ion L o s s , dB Frequency, Hz
Figure 22. Measured transmission loss of a 9 mm plasterboard ceiling construction with and without 74 mm of high density mineral fibre insulation [55].
transmission loss without added thermal insulation. While steel decking is more
commonly used for industrial buildings, these results may be indicative of the acoustical properties of the steel roofs that are now used on houses in some areas of Canada. An Australian study separately examined the effects of ceiling and roof structures on sound transmission loss. In the first part of the study [55], sound transmission through 9 mm plasterboard ceilings was measured with various added insulation material. Figure 22 gives one example of results from this study comparing the measured transmission loss values with and without the addition of a high density mineral fibre material (6.2 kg/m3). The absorbing material greatly improved the transmission loss of this ceiling and almost eliminated the coincidence dip at 4000 Hz.
The second part of this Australian study [56] measured the transmission loss of typical Australian roof structures. The roof constructions included corrugated metal and asbestos panels as well as concrete tiles. All had significant air leaks and were not representative of typical Canadian constructions. Attempts to seal the air gaps produced improved transmission loss values.
In the third part of the study [57], combined roof and ceiling structures were measured. These were combinations of the plasterboard ceilings from the first study and the roof structures from the second study. While they do not represent common Canadian constructions, they give some indication of the effects of important parameters. Figure 23 shows the effect of adding a 74 mm layer of high density mineral fibre in the attic space. The roof consisted of 6 mm thick corrugated asbestos panels. The addition of the heavy absorbing material had a large improvement on the transmission loss at medium and higher frequencies and essentially eliminated the coincidence dip of the plasterboard
125 250 500 1000 2000 4000 8000 0 10 20 30 40 50 60 70 Ceiling/roof Ceiling/roof + 74 mm absorption Tr ansm ission Loss, dB Frequency, Hz
Figure 23. Measured transmission loss of roof-ceiling consisting of a 9 mm plasterboard ceiling and corrugated asbestos roof with and without 74 mm of high density mineral fibre insulation [57].
ceiling at 4000 Hz. Further calculations indicated that these two cases would lead to 27 and 31 dBA reductions to aircraft noise.
The general trend of these results was that the more insulation added in the attic space, the better the transmission loss of the roof-ceiling structure. Although these
constructions were not typical of Canadian roofs, they may exhibit similar trends to well ventilated modern Canadian roof constructions. That is, the many air leaks in the Australian roofs may have the same acoustical effect as the venting of attic spaces in modern Canadian roofs.
Because these tests were carried out under controlled laboratory conditions, the authors were able break the structural connection between the roof and the ceiling structure. They discovered that structure born paths significantly reduced the overall transmission loss of the roof-ceiling construction for frequencies between 630 and 5000 Hz. Thus one cannot separately design roofs and ceilings; it is the combined structure that is important.
7. Vents and Holes
In addition to doors and windows, buildings usually have many other openings in their external façade. These include: kitchen and bathroom fan exhausts, fresh air intakes, attic vents and chimneys. One can attempt to estimate the effect of such openings by
assuming them to behave as large openings with a transmission loss of 0 dB (see sections 2(c) and 2(d)).
However, the situation is usually more complicated than this and there are usually other elements that will influence the passage of sound through these openings. For example ventilation intakes and outlets are usually connected to duct systems that direct the air flow to or from the appropriate part of the building. Such duct systems will further attenuate sound passing through them. By lining the ducts with sound absorbing material or by inserting dissipative mufflers in the duct system, considerably increased sound attenuation can be achieved. Such treatments are usually not very effective at lower frequencies and so their ability to reduce aircraft noise may be in question. (The aircraft noise spectra in Figure 7 indicate substantial amounts of low frequency energy in aircraft noise).
Almost all ventilation openings are covered with some type of grill or louver. Some are designed to further attenuate sound but even simple metal louvers may further attenuate sound passing through them.
The amount of aircraft noise entering via chimneys and flues will be influenced by the length of the chimney or flue and the lining material. It is possible that a long chimney with considerable accumulated soot, may be quite effective at reducing intruding noise. However, chimney openings are usually ideally located for aircraft noise to enter the chimney.
With so many variables, it is difficult to describe the general trends for these various types of openings. There are no published systematic studies of the effects of the various parameters on the sound attenuation of aircraft noise. Only a few case studies give an indication of the magnitude of the problem.
A British study [52] found it necessary to completely seal a fireplace chimney opening to achieve a high level of aircraft noise attenuation.
A particular type of fresh air intake [58] was said to provide 8 to 10 dBA reductions of aircraft noise. Because the opening represented only 0.01% of the exterior wall area, it was estimated to provide adequate attenuation. In the same report, window air
conditioners were said to be unacceptable when exposed to high levels of aircraft noise. Through-the-wall units could be made acceptable by adding covers that were put in place when the unit was not operating. It was argued that when the unit was operating, the air conditioner noise would mask any intruding aircraft noise. The cover increased the overall noise reduction by 10 dBA.
Unit ventilators can be a problem when they include fresh air intakes [58]. By adding an acoustical louver, the overall noise reduction was increased by 5 dBA. Frequently air conditioning is added when buildings receive extra sound insulation so that windows can be kept closed. It is important that fresh air intakes be fitted with sound attenuating devices to avoid compromising the acoustical design.
The current trend is for attic spaces to be well ventilated, to avoid moisture problems. This will reduce their acoustical effectiveness as barriers to aircraft noise. Older
Canadian results [22] suggested that the addition of attic vents reduced the overall noise reduction by 3 dBA. However, no details of the type or size of vents was given. One study [59] describes the addition of acoustical louvers to an attic space, but did not specify their effect.
The design of acoustical louvers has been studied [60]. The sound attenuation varies with the direction of arrival of the sound and the attenuation was minimal at lower frequencies. This is similar to the properties of acoustically lined ducts and dissipative mufflers in ducts. It may therefore be difficult to adequately attenuate the low frequency components of aircraft noise when a building contains ventilation openings.


![Figure 6. Measured transmission loss of 4.5 mm and 10.2 mm diameter apertures of different lengths and comparison with the Wilson-Soroka equation (dash dot line) [from reference 48].](https://thumb-eu.123doks.com/thumbv2/123doknet/14212481.482199/12.918.155.757.117.649/measured-transmission-diameter-apertures-different-comparison-equation-reference.webp)
![Figure 7. Comparison of aircraft noise spectra from the CMHC guide [11], measurements at schools near Pearson airport [12] and measurements by Barnhardt [13].](https://thumb-eu.123doks.com/thumbv2/123doknet/14212481.482199/15.918.175.769.129.585/figure-comparison-aircraft-spectra-measurements-pearson-measurements-barnhardt.webp)
![Figure 8. Comparison of source spectra from the CMHC Guide [11]. The OITC standard [16] and the average of measurements near Pearson Airport in 1991 [12].](https://thumb-eu.123doks.com/thumbv2/123doknet/14212481.482199/16.918.176.750.562.999/figure-comparison-spectra-standard-average-measurements-pearson-airport.webp)