Applying Information Technologies to Architectural User Programming
by Charles M. Dalsass S.B., Civil Engineering (1995) University of Connecticut Submitted to theDepartment of Civil and Environmental Engineering in Partial Fulfillment of the Requirements for the Degree of
MASTER OF SCIENCE IN CIVIL AND ENVIRONMENTAL ENGINEERING at the
MASSACHUSETTS INSTITUTE OF TECHNOLOGY May, 1997
© 1997 Massachusetts Institute of Technology. All Rights Reserved.
Signature of the Author... ... ... ... .... ... Department of Civil and Environmental Engineering
May 9, 1997
Certified by... ... ...
d1Jerome J. Connor Professor of Civil and Environmental Engineering Thesis Supervisor
V
Accepted by... ... .Joseph M. Sussman Chairman, Departmental Committee on Graduate Studies
JUN 2 4 1997
Charles M. Dalsass
Submitted to the Department of Civil and Environmental Engineering on May 9, 1997 in Partial Fulfillment of the Requirements for the Degree of Master of Science in Civil and Environmental Engineering
Abstract
This thesis presents analysis, propositions, and solutions for improving the quality and enhancing the performance of an existing business process, User Program-ming. User Programming is an architectural pre-design methodology used by Henn Architects (Munich, Germany). Information technologies will be strategically applied to different areas of this complicated and subtle process. The effort involves the creation of prototype software applications, using groupware and WWW technologies. The thesis represents phase one of Design Technology's work on the "CardWall" project for Henn Architects.
The study starts with a detailed investigation of User Programming, with consid-eration of schedule, documentation, roles and process. A description of the areas where improvements can be made follows. This information is the result of interviews with Henn programmers, and work from the Design Technology group. Next, this paper will investigate software concepts that follow from the targeted areas for improvement. These suggestions and concepts are clarified with the creation of two prototype software systems. A chapter on architecture outlines the major facets of the HennApplet informa-tion model. Finally, a technical secinforma-tion provides detailed explanainforma-tion for design decisions and technical specifications concerning these prototypes.
Thesis Supervisor: Jerome J. Connor
Acknowledgements
I would like to thank Bill Porter and Paul Keel for providing encouragement, enlighten-ment and support throughout this project. Although I may have complained about techni-cal areas of this work throughout the year, I am sure you both know that I have been extremely happy working in Design Technology. I've asked alot of people about their labs and their research work at MIT, and I honestly don't know of anyone else here who has such an interesting and enriching project as this. On account of my involvement with this project, MIT has been a blast for me.
This paper is dedicated to my terrific family: Eggs, Johnson, Munny, Noni, Di, Dan and Pop. Love!
Contents
List of Figures...
...
6
1 Program ming ...
8..
1.1 William Pena's Programming from Problem Seeking
1.2 Henn Architekten Ingenieure 1.2.1 Business Philosophy 1.2.2 Project Schedule 1.2.3 BrownSheet 1.2.4 Documentation
1.2.5 Business Organizational Diagrams (Netgraph) 1.2.6 Posters
2 Scope...
...
25
2.1 Brief History
2.2 Suggestions for Change
2.2.1 Grouping Strategies 2.2.2 Creating a Database 2.2.3 Creating Marketing Tools 2.2.4 Knowledge Base of Information 2.2.5 Quick Scanning of Cards
2.2.6 Representation of Flows within CardWall 2.2.7 Creating Charts
2.2.8 Creating the BrownSheet 2.2.9 Creating Documentation 2.2.10 Creating Graphical Displays 2.2.11 Other Features
2.3 Analysis
3 Design Concepts... ... 36
3.1 Combining the CardWall and BrownSheet 3.2 CardWall as a Distributed Medium 3.3 Link Types
3.4 Saving Cards of the CardWall 3.5 Arrangements
3.6 Netgraph
3.7 Card and Link Attributes 3.8 BrownSheet Module
Contents
4 Architecture...47
4.1 Distributed Medium 4.2 Event Model
4.3 Schemes for Saving the Information in the CardWall and BrownSheet
4.4 Object Model 4-5 Database Design 4-6 Use of the HennApplet
5 Technical ... 60 5.1 Component and Event Models
5.1.1 Beta 1.0 Version
5.1.2 Beta 1.1 Version
5.1.2.1 Issues with the LTK for Beta 1.1 5.1.3 Additions and Changes Made to the LTK 5.2 Interaction Model
5.3 Two Schemes for Saving Cards
5.3.1 A Basic Java Server and File-Format
5.3.2 Saving to a Notes Database
5.3.3 Additional Notes on Saving Cards
5.4 Security model
5.5 Storing Links in the Database
5.6 Grid Class
5.7 Implementing a Remote pool of Objects to Store Data 5.8 Current Problems with the HennApplet
6 Conclusion... 79
List of Figures
1-1: Separation of design from pre-design... ...
1-2: Program m ing m atrix. ... ... 10
1-3: Cards from a discussion on visualization in architecture Drawn by C hristine K ohlert... ... ... 12
1-4: Project schedule... ... 13
1-5: Typical Programming schedule ... 14
1-6: Spreadsheet of needs used to created the BrownSheet...19
1-7: The B row nSheet... ... 20
1-8: Netgraph organized by position, from a small health clinic... 23
2-1: Areas within the programming schedule slated for improvements...35
3-1: Connection between CardWall and the BrownSheet and design...36
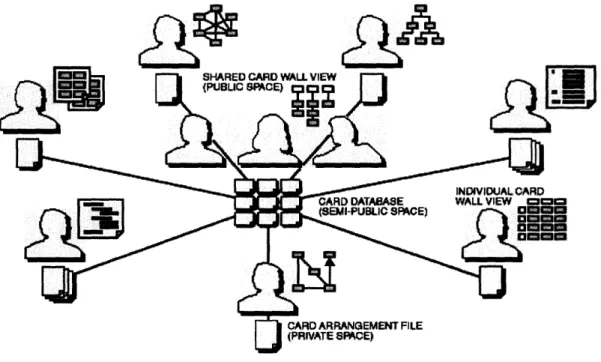
3-2: Within the CardWall module, each user has a preference file to determine how cards are arranged and displayed. Cards are downloaded from a centralized database...38
3-3: Cards on the CardWall contains 5 different types of links ... 39
3-4: Saving the CardWall information is done by reducing the priority of cards and links... ... 40
3-5: Lightweight version of the Netgraph animates data with three different types of representations... ... 43
3-6: Attributes associated with cards. This data will be used to design the database of cards ... ... 44
3-7: Two of the proposed BrownSheet arrangements: by department, by type of space... ... 46
4-1: State diagram for the HennApplet. This provides periodic updates to the database... ... 48
List of Figures
4-2: 2 ways that data may be saved from the HennApplet...49 4-3: Both the CardWall and the BrownSheet exhibit similar behaviors,
these are abstracted from the AbstractCanvas class... 50 4-4: Fields within the cards' database can be edited via the web...52 4-5: Beta 1.0 version of the HennApplet. This applet was presented to
Henn in December 1996 as an initial prototype. This screen-shot shows
un-arranged cards with connections between them... ... 56 4-6: Beta 1.0 version of the HennApplet. This screen-shot shows the
CardWall after pressing the CardWall arrangement button...57 4-7: Beta 1.0 version of the HennApplet. This screen-shot shows the
CardWall after selecting a top card and then pressing the hierarchy arrangement button. The algorithm leaves the unconnected cards to the
right of the hierarchy... ... 58 4-7: Beta 1.1 (latest) version of the HennApplet. This screen-shot shows
the different modules that connect to the cards database and image library. The editable dialog box and menu are both visible.The brown
Chapter 1 - Programming
User programming is a general term describing the acquisition of information that is required for a design at the initialization stages of a project. Often applied to architecture, programming is a methodology that is used to clarify and simplify the way that design is approached. Programming does not attempt to replace design with an algorithm. Rather, it provides a sequence and guidelines as well as a philosophy for information retrieval and client relations, which result in well thought out design decisions. The first part of this chapter will focus on specific variant of programming originally proposed by Will-iam Pena in Problem Seeking, An Architectural Programming Primer. The second part of this chapter will describe in detail how Henn Architekten Ingenieure practices program-ming.
1.1 William Pena's Programming from Problem Seeking
Like other forms of programming, the methodology detailed in Problem Seeking brings to the project the mandate that no design decisions are made before the problem is found and clearly stated. It provides mechanisms to avoid attempts at solving problems without making methodical endeavors to find out what those problems really are. The methods proposed in Problem Seeking intend to circumvent the common architectural error of attempting to find the problem and to solve it at the same time. To avoid this mistake, guidelines are proposed for the creation of a clearly defined design problem on a project. The result of programming (and pre-design in general) is a clear statement of what the problem is.
Problem Seeking splits the architectural endeavor into two parts. The first is
program-ming and the second is design. "If programprogram-ming is problem seeking, then design is problem solving" (Pena 1977). In the first stage, the programming, the goal is to arrive at the design problem statement. Having realized the problem statement, the designers may use that problem to create a design solution that solves the problem. This programming method distinctly separates out the two sections, and de-couples the programming (pre-design) from the design. What connects the two stages is the problem statement. Pro-gramming forces architects to make clear problem statements - a step which is univer-sally supported, but rarely practiced in architectural projects. Problem Seeking also demands that the client be recognized as the main source of information for design decisions. To support this, programming supports intensive information retrieval from the client. This is done by a series of group meetings where members of the client organiza-tion are interviewed about certain aspects of the organizaorganiza-tion. They are encouraged to anonymously submit suggestions, complaints and facts about the present condition of their workspace.
The information that will dictate decisions about the design is in widespread and dispar-ate forms within the client organization. Although it is very clear that the information about the design of a new building belongs to and is held by the client, the onerous task of retrieving and making sense of that information is the real obstacle in client relations. The programming process suggested in Problem Seeking outlines specific steps for
Chapter 1- Programming
gathering and organizing this information. This is accomplished by retrieving the ideas found from the group sessions and categorizing them into a matrix. The categorization
allows the designers to begin the next step of creating design suggestions for new or improved facilities.
"Programming is an organized process based on standard procedures which
can be used on large and small projects, simple and complex building types and with single or multiple clients. It is particularly useful with large, complex and unfamiliar projects for large client groups"(Pena, 1977).
Problem Seeking splits programming into five clear steps. These are:
1. Establish Goals - clear, concise statements about the long term, strategic goals of the client.
2. Collect and Analyze Facts -find out facts that will govern the design, these are things that exist now.
3. Uncover and test Concepts - does the client have ideas about how to achieve these goals?
4. Determine Needs - what level of quality, room space, and quantity of production are required?
PROGRAMMING PROBLEM
STAGE STATEMENT DESIGN STAGE
Figure 1-1: Separation of design from pre-design (Adapted from Pena, 1977).
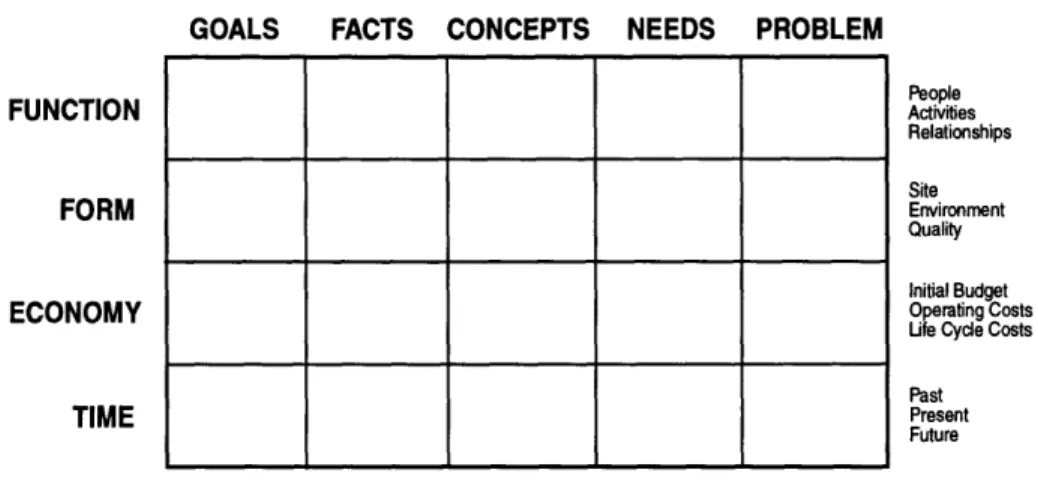
5. State the Problem - what is the general aim of the project, where should it be going? Steps one through three are the steps that are used to find out information from the client. The fourth step - determine needs, imposes and yields constraints on the problem by trading off specific needs with the budget. The needs are derived from the information found within the first three steps. The final step produces the main artifact of the pro-gramming process, the problem statement. Although classifying the information does not have to be done in any specific order, reaching the problem should be the last step. For each of the five steps above, Problem Seeking suggests that the following four sub-classifications are made. The goals, facts, concepts and needs are categorized by Func-tion, Form, Economy and Time. Function is essentially what the building is going to be used for, and what needs the building must provide. Function focuses on what types of work are to be done within and by the building. Form, relates to the physical shape of the
building and how it fits into the physical and cultural surroundings. Economy is the quantity and distribution of money associated with the project. Time deals with the state of the building/site in the past, present and future.
This step-by-step classification procedure creates a matrix of information for the synthe-sis of the project into a cohesive and well thought out design problem. Performing this classification allows programmers to remember all the necessary components of each one of the steps. Within facts, goals, concepts, needs and the problem statement, the further classes can be used as a checklist for information that may have been forgotten or left out. This method also serves the purpose of organizing information into clear, concise and relevant pieces of information.
GOALS FACTS CONCEPTS NEEDS PROBLEM
FUNCTION FORM ECONOMY TIME People Activities Relationships Site Environment Quality Initial Budget Operating Costs Uife Cycle Costs Past Present Future
Figure 1-2: Programming matrix. (Adapted from Pena, 1977).
Problem Seeking also provides a philosophy for client/architect relations. The premise is
that the client knows the goals, facts, concepts and needs better than anyone else does. Allowing the client to make decisions is another premise behind client/architect relations. For this reason, the user must take an intimate part in the programming process. The client must be coached to make decisions about what his needs are and what problem needs to be solved (this also reduces input from the architect). Problem Seeking suggests that the programming effort require two teams, one to represent the viewpoint of the architect and the other to represent the client's needs.
Problem Seeking also suggests making project cost estimates at an early time in the
programming process. This is used as part of the data classification and gathering occur-ring in the first three steps of the process. This is done using a "BrownSheet", which is a large board outlining the types of space and cost requirements. The brown sheet contains visual representations of the types of rooms that are required for function and their
Chapter 1- Programming
subsequent sizes. It is used to visually trade-off space requirements with cost.
Programming gets clients to make suggestions to help organize the disparate information regarding the project and to make preliminary estimates of area requirements. To do this, the client's people come together in a group where all participants may participate. As the client's members make these suggestions, their ideas are graphically represented using paper cards that are pasted upon a large board, (in this paper) called the CardWall. The cards usually contain a few words, characterizing the idea that the card represents. Each card should only represent one clear idea. As a group, the programmers and the client's people make decisions about the goals, facts, concepts, needs and the design problem. When the design problem is decided upon by the programmers, it is passed to the design-ers who will come up with a detailed design to solve the problem.
1.2 Henn Architekten Ingenieure
Henn architects in Munich Germany has taken many of the concepts of the programming process and used them in their everyday practice. In addition to following suggestions from the Pena book on format, style and procedure, the Henn group has made changes and additions to the user programming methodology. They have expanded the use of Pena's concepts as well. Where the programming process was originally proposed as a
system to communicate with the client, organize data and make initial estimates of costs, it has become a marketing tool, an archiving tool to keep the history of the project, and a product for the client. Henn's clients such as VW of Wolfsberg and Skoda manufacturing of Poland consider the programming "CardWalls" to be valuable deliverables from Henn. The documentation produced from the cards and BrownSheets of the programming process creates a log of the entire design process in tangible form. Finally, the Henn group has codified the process and created sophisticated methods for using programming to help their clients achieve their goals.
Programming provides solutions for Henn Architects in the following areas: 1. As a way to design buildings
2. As a public relations and marketing tool 3. As a knowledge base
4. As a means of communication with the client (transfer of information)
5. As a facilities management tool 6. As an information system
1.2.1 Business Philosophy
The business model of the Henn Architects is that acting as the architect (a complete stranger), they have has no ability to make decisions regarding what the client needs at the onset of the project. Instead, the focus is to promote a high level of collaboration with the client. Henn Architects demand this type of collaboration because much of the decision making power is "passed back" to the client when Henn Architects obtains a contract. Rather than having most of the design decisions made by the architect, it is in both the architect and the client's best interest to have the client make decisions based on
what they need. This philosophy is carried out using the user programming sessions that involve many members in the organization. At all stages of the design, the client is asked to participate in the decisions affecting the design. When the design has been completed, the user is given copies of the documentation summarizing the decisions they have made.
The information that the client has about their needs, exists in various and disparate forms within the company. User programming and the Henn philosophy focus on
collect-AU
W
isv
ww
#i~3~7M~ ~
Artl
/PWM7IPM
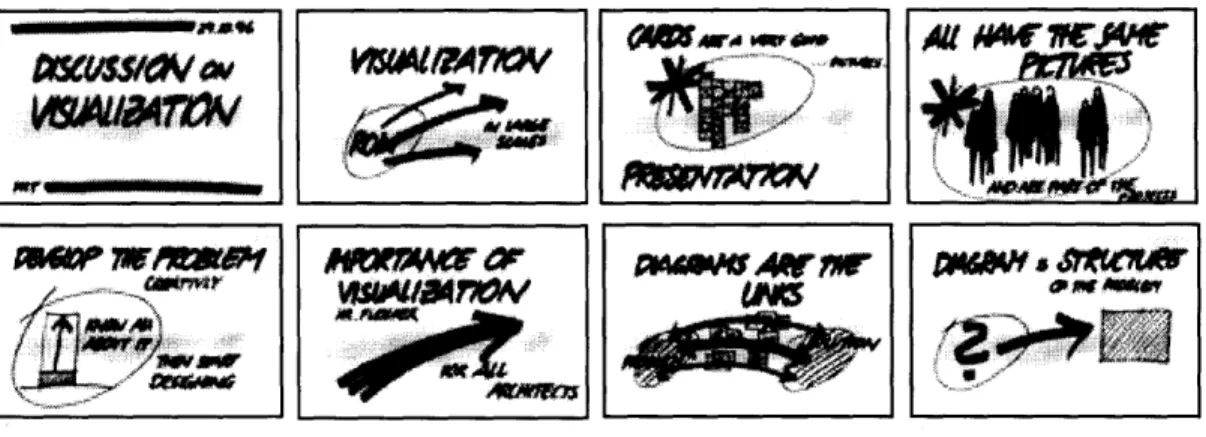
Figure 1-3: Cards from a discussion on visualization in architecture. Drawn by Christine Kohlert.
ing that information from within the ranks and applying it to the design. It does this with a highly egalitarian system, by accepting suggestions during programming from members of the organization at all levels with equal acceptance. The ideas that come from employ-ees are not mapped to a specific author, and their look is consistent throughout. In the programming all ideas are given equal scrutiny through anonymity.
Having the client make decisions about the design changes the role and types of activities of the architecture firm. Henn Architects have moved away from the traditional roles of the designer. The Henn philosophy makes the architect's role more like a management consultant in the initial stages of the design. In later stages of the design, Henn assumes the traditional role of the designer. However, the way projects are handled with program-ming reduces Henn Architects' autonomy to make decisions. Accepting client's decisions throughout the project means that there is less room for the architect's input. This does not mean that Henn approaches the project without any pre-conceived ideas about how the design will flow. Notions of group involvement, communication, flattening of organi-zational structures, and shared equity, and making little allowance for private space, influence Henn Architects' designs. These philosophies are presuppositions that are carried into the programming practice and greatly influence final designs.
Chapter 1- Programming
initial analysis of the user's design problem, the methodology of programming and its follow-up design process suggest that the user may not need a new building at all. Perhaps the architect realizes that the real problem with the design is that the manage-ment needs to be reorganized, or that there needs to be a different assembly process within a factory. Henn Architects offers User Programming as a service to clients who need to figure out if they need a building at all or are suffering internal problems that stem from a different source.
Much of the value of programming and the Henn Business philosophy arrive less from the process itself, than from the other intangibles that it provides. User programming gives the client a sense of being involved in the project and having the power to make decisions about the final design. It provides representation for the client, who might otherwise have no say about the final product. It gives members of the organization the ability to participate, regardless of their position in the organization, and it provides a
solution based on the clients needs rather that the architect's inspiration. The methodol-ogy inspires team-spirit. It forces the client to clearly list the goals, needs and problem of the project. Finally, programming prevents the architect from making design decisions before all information is collected from the client.
1.2.2 Project Schedule PROJECT INITIALIZATION (Vorgensprache) initiate 3-10 preliminary contract,choose meetings project leader
prepare schedule, study site conditions, plans, industry, find themes
PROGRAMMING WORKSHOP
0 preparation of 0
kick-off meeting BrownSheet final presentation
preparation of
mini CardWall discussstatement of
problem with designer, create documentation DESIGN presentation of final design problem, corrections
[ includes client participation
does not include
client participation
1-4: Project schedule
Day Monday Tuesday Wednesday Thursday Friday
Date 18/10 18/10 18/10 18/10 18/10
9:00- Strateg and
9:45 Goal Definition Office Space
Finance and Site Conditions
10:00 Control
10:45 Space and Area______
11:00- Requirements
11:45 EDV Outdoor Parking
13:00 13:00
14:45 Office Space
Personal Service Construction
14:00 Marketing Tecnique Final
14:45 Presentation
5:00- Storage and
15:45 Kick-off Meeting Office Space Logistics Repair and
Public Maintenance
16:00- i Relations
6:45
Figure 1-5: Typical Programming schedule (translated from Henn, 1992).
Having initiated a contract for the programming part of the project, then Henn team begins the Vorgesprache or research part of programming. This involves a series of informal meetings with different, individual members of the organization. The number of meetings depends upon the size of the project and the level of efficacy the owner wishes to carry out the pre-design. If the project concerns an existing workplace, the Henn team holds these meetings in the workplace of each of the workers to observe the person in their domain. Careful attention must be paid to the processes within the organization and the types of changes that need to be made there. For example, in a project involving a research center, the team would be introduced to the concept of a clean-room, shown how the employees use the room and be described the future goals of the new clean-room (better air quality lity limits etc). As these meetings are carried out the programmers create abstract categorizations of ideas or themes. The themes are the categories of information that are most important to the future design.
A project leader is chosen from the company to work closely with the Henn team. The
project leader is typically someone within the client organization who has an interest in
the new architectural work and who has an overall knowledge of the people and
Chapter 1- Programming
client organization to the Henn programmers. The project leader accompanies the Henn programmers throughout the organization, introducing them to the employees who work there and making them familiar with needs that they may have in the future. These
meetings also allow the Henn programmers to study the manner and environment that the members of the organization work in, and to ask them about the features of the place that they like or dislike.
After going through the client organization and becoming familiar with its members and departments, the team prepares an initial analysis of the major themes of the project. These themes represent a classification of the types of information that needs to be gained from the client. The typical project involves a grouping of major concepts that will affect the design. In these listings, there is always a section for the goals and needs. The goals are what the team currently thinks the long-term goals of the organization are at this time (this may change over time). The needs are the specific square meters of area in the building, machinery, equipment and resources that will be required to fulfill those goals. Typically, there are 7 categories that that will be used as themes for the project: Goals: What are the long-term goals of the organization? What are its reasons for expansion/improvement/building? Does it wish to improve production, employee relations or become a better university?
Needs: The needs are the result of the following design classifications. These are the actual spaces required and their associated costs. This also includes any other quantifi-able resources that are needed.
Communication: This is an analysis of the flow of communication within the
organiza-tion. The Netgraph is used in this analysis to see which members of the organization meet and speak together to share expertise. The communication may also represent a sharing of values or company identity as well.
Workplaces for the People: This facet of information represents the places in which the
people will work. Although some of the information obtained in this section may contain information about the area required, eventually that knowledge will be transferred to the Needs section. This theme organizes all information about the way people work within their offices, labs, shops or classrooms. An example of this is the fact that people work-ing in a chemistry lab need to have access to eye-showers.
Special Service Functions: This area of information represents knowledge about social
areas and those spaces not directly related to the organization's purpose. Examples of this are cafeterias, cafes, medical facilities, entrance rooms or day-care.
Site Conditions: This body of knowledge is what makes up the site conditions.
Informa-tion in this secInforma-tion may be traffic condiInforma-tions, area, topography, soil condiInforma-tions, people, parking needs, environmental, landscape architecture, pollution.
Infrastructure: The infrastructure pertains to auxiliary utilities and functions that support operation of the building and its inhabitants. These include, telephone, computer networks, electrical, heating, sewage system, fire escape routes and security.
Functions: In this stage, we need to know what specific items are needed for functions
within the organization. This area of information is particularly important for production. In regards to assembly production, this may be a listing of all the machines that are needed along the assembly line. This section may also include offices, facilities, storage, logistics and restrooms. Typically these functions are in regard to production for a factory.
Processes: Information regarding processes concerns the connections between functions. Information in this section might show the flow of goods between different stages of a product on a production line, as it passes between machines. This is not simply the functions of the previous paragraph with connections among them, but rather the abstrac-tion, separaabstrac-tion, reorganizaabstrac-tion, selecabstrac-tion, and division of these functions. Processes are important to Henn Architects because of their philosophy of "form follows flow", meaning that the building should be designed around the processes involved within it. After making classifications of the information needed from the client for a successful design, the Henn team prepares a schedule for the user programming interviews. The sessions are divided up according to the previous categories or themes of knowledge. Not all employees are chosen to participate in the programming sessions. The project leader and the Henn team choose employees from the company based upon overall knowledge and experience within a certain knowledge theme. Except for the first group interview, there is no requirement of rank or position to be chosen for the programming interviews, but rather broad demonstrated knowledge in the areas. For the first group meeting, top management and strategic members of the organization are asked to participate. This is done because the first meeting is used to clarify the goals of the organization at the beginning of the programming. It is assumed that those in the highest positions of the company are in the best position to have clear goals of the long-term strategy for the organization. It is important that the goals are clearly stated at the beginning so that the rest of the participants in later sessions will see them and be able to make judgements about how to accomplish them. Invitees may be asked to join more than one session. Sometimes the people chosen for a specific area of knowledge are not able to answer the questions that come up in the process. In these cases, new people may be asked to join the effort. This may mean adding additional programming sessions to the schedule. Other times, the knowledge about a specific area will not be available from within the organiza-tion. In this case, specialists will be brought in from outside of the organization to
participate in the sessions.
If the goals change or are found to be unclear or unrealistic during the programming, members of the initial meeting will be asked to reconvene.
Chapter 1- Programming
A week before the programming begins, letters are sent out to the participants inviting them to the workshop. The schedule is reordered based on their availability.
Programming meetings are typically held over a one-week period. The week starts with a 45-minute Monday "kick-off' meeting that introduces the client to the programming process. From Tuesday to Thursday, the group interview/meetings are held. These usually take 2 hours, except for the first, which takes one hour (the top management have less time to meet). On Friday, the final workshop presentation is a 45-minute presentation of the ideas that were found during the group interviews.
The Henn team prepares cards for the kick-off meeting with the goals and facts already known from the preliminary research and obtained from the project leader. These are presented to the members of the organization during the meeting.
The kick-off meeting is held in a large meeting room. Cards from the initial research outlining the organization's goals and facts are presented. The Henn employees also explain the schedule that will be going on later in the week, how programming works, and what the main topics will be. Henn employees also make the clients feel comfortable with speaking during the session and ask invitees to prepare for the meetings by getting them to bring ideas about their knowledge theme.
In the group interview sessions, which are held in the same meeting room as the kick-off meeting, programming cards are conceptualized and created by an architect, as users give suggestions about the goals, facts, concepts and needs of the project. Within each knowl-edge area, the interviewees make suggestions about what information might be needed to achieve the previously established goals. These are posted on the large wall among others from previous meetings. A moderator keeps the discussion on track by asking appropriate questions (specific questions have been decided upon before which pertain to the theme of the meeting) and clarifying the objectives for the discussion. The structure is some-what formal, as all members of the group are not allowed to speak up on ideas that they think would help the design. Rather, respondents answer questions from the moderator so that the conversation does not wander from the theme of the workshop session.
Each idea card is drawn in the same way so that the cards have graphical uniformity. However, there is an emphasis on making the cards look different enough so that they are easily recognizable. Typically, the cards are marked with thick magic marker, in bright colors. Bold, clear strokes are used to represent solid, simple ideas. Almost all cards contain two to ten words explaining the content. Cards are left anonymous and there is no other information associated with them once they are placed upon the idea board. The Facts are always orange and the Concepts violet.
As the discussion goes on, cards are used as place markers so that others don't forget limitations that may previously have been brought up. Ideas that were previously brought
up are not forgotten because they can be referred back to from the CardWall. The cards also have the effect of forcing the members of the client organization to provide clear ideas that will be remembered. Underneath the goals, facts, concepts and needs, the cards are also categorized based on "heading cards" which roughly correspond to the major themes, or categories of information, suggested at the beginning of the project. There is typically a heading card for each of the themes of the project, in addition to any others categories that come up. These cards are created during the programming session. Heading cards usually repeat under different super-categories.
At the end of each workshop meeting, the Henn team quickly rearranges the CardWall into the goals, facts, concepts, and needs sections to prepare for the next meeting. If necessary, they will construct charts that focus on a specific scenario brought up in the previous programming session. In the subsequent programming session, members will be asked for expertise supporting or refuting these ideas. Before the final meeting, as many as 10 charts are prepared. These will be presented with the CardWall at that time. The entire CardWall is entirely resorted and corrected for mistakes to prepare for this. Charts are used to demonstrate specific examples. They are created from a combination of cards that were previously created and arrows, diagrams and text. They are usually compiled and pasted on large 1-m. by 1-m. boards. They are used to show relationships between ideas, connections and possible solutions. An example of a chart might be three scenarios for the site location. It would show each of the locations for the site: inner-city, countryside, or a specific location by a river. For each of the alternatives, the pros and cons of each are displayed on the chart. Another common type of chart is a bubble chart of possible connections between rooms in a building. These charts are based upon the Netgraph communication matrix and show heavier lines connecting rooms that sponsor much communication within them. A final type of chart is the pie chart of cost vs. area, cost vs. material, cost vs. quality etc.
During the final meeting, the entire group checks the CardWall and the week's progress is discussed. Comments are made regarding accuracy and categorization of the cards. The
space vs. cost is compared and adjusted if necessary.
After the final presentation, the programmers solidify the design problem by conferring with the designers. A few pages of text are sufficient to represent the problem statement. It is intentionally meant to be succinct. The final problem statement (in addition to all cards) will go into the brochure that will be given to the client for analysis and correc-tions. All other content generated from the programming also goes into the brochure. The client goes over the brochure and makes corrections if necessary. They may also make remarks or have suggestions about the problem statement, since this is what the design solution will be based upon. The programmers may also have a separate meeting for the client to display the final brochure and explain the completed problem statement. In the meeting the client gives the final word for the design work to proceed from the problem statement.
Chapter 1- Programming
1.2.3 BrownSheet
The BrownSheet is used as a visual tool to represent the area and cost requirements based upon the needs of the clients. This comes directly from the needs section of the
CardWall. It is used to iterate and delegate space among different competing groups within the organization. This stage is done concurrently with the "needs" section of the programming methodology. The BrownSheet is repeatedly edited and changed over the period of the week.
Most of the time the Henn team does not actually use a BrownSheet in the final meeting because it is too difficult to make one from cardboard and paper. As a replacement, two carefully marked spreadsheets are always prepared. The first spreadsheet lists the area requirements in general terms, usually categorized by department area or sub-department. The second spreadsheet is more specific than the first one. It further breaks down the departments into individual rooms, and categorizes them. These categories are typically hallways, social rooms, office rooms, exercise rooms, warehouse space, labs and work-places. The spreadsheet divides the overall area into gross area and net area. There are also three columns that further categorize the overall area. These columns are for human service areas (toilets etc.), technical areas (shafts for pipes, wire-housing etc.), traffic areas (hallways, entryways etc.), and outside spaces (atriums, gardens etc). Instead of using the BrownSheet, a combination of charts and the spreadsheets are displayed to the client in the final meeting.
Figure 1-6: Spreadsheet of needs used to created the BrownSheet (translated from Henn, 1991).
The BrownSheet contains square boxes organized into categories of the organization (departments). Groups of similar size and use may be grouped together to show their relations. Each box is drawn in proportion to the amount of area required. A few words describing the use of the room is placed at the bottom of each space or group of spaces. In addition, the areas of the space/s are shown at the bottom of the BrownSheet. The section of the organization that they belong to categorizes the spaces (department). These groups often coincide with the programming sections from which the needs are derived. The total and net areas of these groups are displayed on the BrownSheet. The BrownSheet is used to "haggle" with the client over potential areas and how these
areas should be distributed over the period of the programming. A typical BrownSheet then, necessarily contains numerous additions, remarks, and revisions. Since pasting small, white areas representing spaces for the clients to view it quickly becomes covered with tape, glue and ripped off paper squares.
Total Area: 661.6 m2 Net Area: 496.03 m2
Civil Engineering Department
U,
computer utilities admin. room
10.4 m2 6.43 m2 12 m2
Ell
6 TA's offices
48.6 m2
Mechanical Engineering Department
U ,
computer utilities room 10.4 m2 6.43 m2 mechanical room 62.4 m2 8 TA's offices 69.7m2 Total Area: 313.5 m2Ocean Engineering Department Net Area: 232.0 m2
MU,
4 classroooms
69.1m2
Total Area: 145.8m2
Net Area: 122.3 m2
ocean strucures laD
53.2 m2
Figure 1-7: The BrownSheet.
bathroom storage
8 m2 9.3 m2 admin.
12.6 m2
student Lounge
34.2 m2 Total Area: 202.3Net Area: 141.53
bathroom storage 8 m2 9.3 m2 admin. 12.6 m2 fluids lai 53.2 m2
Chapter 1- Programming
1.2.4 Documentation
One by-product of the Henn Architects' programming process is a large book that is a compilation of the ideas formulated in the programming sessions. It is divided by tabs with the categories which make up the programming matrix (ziele:goals, fakten:facts, konzepte:concepts, bedarf:needs, aufgabenstellung: problem-statement,
anhang:appendix). A large part of this documentation is the cards that come from the CardWall, copied in color, seven or eight to a page. The employees use color-laser-copying machines to do this. There is no additional text provided with the cards (except for the text on the cards themselves). The content of the remaining sections of the documentation is as follows:
Preliminary Materials:
Cover Page - Project Title, content description, date, Henn Logo. Intro Page -Project title, description of documentation contents. Names page -markers for each of the main programming categories.
Einleitung (Introduction) -Intro to the project, scope and how the project was initiated, who owners are, use of the building, where the funding is from. What is programming? -Contains a description of programming.
Information Page -Has dates about the start of the project, details about the beginning of the project, List of Henn Architects' employees, A list of all the client participants.
ziele:goals
Contains brief descriptions of the function, form, cost and time required in the goals part of the CardWall.
fakten:facts
This contains the cards from the facts section of the CardWall. The programmers organize the cards by the categories of facts that were found during the program-ming sessions. These categories are not the same categories as the themes that correlate with the workshop sessions. For example, the documentation for the Technical University of Munich arrived at the following categories to sort cards: the identity of the school, the activities which occurred there, the nature of the students, current teaching style etc. Next, there are cards listed in the categories of the individual divisions of the organization. No cards are duplicated in two categories. Cards that are introduced and that pertain to general information about the project are presented. Next, cards, seven per page are displayed under the categories of the grouping that the programming sessions were done. In addition to the cards, organizational charts are drawn showing which connections must be made between different departments. These are drawn as bubble dia-grams with connections between the departments drawn in different thickness lines. The heaviest lines have the highest priority. Bubble diagrams are also presented here showing rooms within the department, and the connections between them.
The initial page contains a table of contents describing the concept chapter. Similar to the facts sections, categories are shown describing the categories that have been chosen to organize the ideas. These vary from abstract (i.e. communi-cation) to very practical (an idea about having a social room, suggestions about the structure of the building).
bedarf:needs
Initial Page contains a description of the needs section, followed by a table of contents. There are two main parts to this section, the first is a direct transposi-tion into table form, the needs of individuals as they are expressed upon the brown-sheet. This document does not contain all the rooms that are projected for the project. The second part contains a large and very detailed proposal for the areas which are to be included in the final design. These are organized by type of room (utility, office, social etc).
aufgabenstellung:problem-statement
This section contains a few pages that contain the description of the design statement. For each of the sections of function, form, cost and time, there is a short description of the problem statement.
anhang:appendix
Contains laser copies of all the brown-sheets. Includes a description of the site, including maps, aerial photos, access, vegetation, schedule of the programming sessions.
1.2.5 Business Organizational Diagrams (Netgraph)
The Henn team also uses a technique called the Netgraph to analyze the communication within the organization. (Allen, in press) It uses the information it gathers from the Netgraph surveys and analysis to derive information about how to connect and organize spaces within the organization. The Netgraph allows a designer to analyze the type of communication going on within an organization. The software itself simply organizes the information retrieved from the surveys into matrices representing the communication between different categories of the organization.
The Netgraph is created from extensive surveys that are given to the members of the client organization. These are handed out to the employees who fill them out. Members of the organization are asked who, over a period of the day they conversed with, either by telephone, email or face-to-face. They are also asked who they would like to converse with within the organization given better availability. These surveys also provide age, department, sex, salary and other personal information about the respondents.
Participants are asked to complete the surveys a number of times. The data is then analyzed for invalid information based on statistical variation from the norm. Invalid survey data is removed from the data set. The more surveys that are done, the closer the information is to yielding accurate results. The files are consolidated into two single files. The resulting files are submitted as text files and run through a software program that
Chapter 1- Programming
creates a colored, two-dimensional matrix representing the connections between the members. The hallmark of this system is that the data can be organized into different categories for comparison. For example, the data could be viewed to show a representa-tion of who communicated in an organizarepresenta-tion by department. Another way to analyze the data would be to see if age had to do with the communication, or if the distance between the departments was interfering with their ability to communicate.
This information is tested during the programming where the architects ask the partici-pants to describe the type and extent of communication within certain divisions of the company. It is then compared with the Netgraphs for validity.
receptionist (1)
up-medical assistants (2) mid-level clinitians (2)
doctors (6)
follow-up medical assistants (2)
phone room triage (5)
management (3)
Figure 1-8: Netgraph organized by position, from a small health clinic (Adapted from Kisiel, 1997).
The Netgraphs also play a large part in explaining the communication part of the pro-gramming. They are analyzed frequently and used to create cards clarifying the commu-nication within the organization. They are also tested against the CardWall, because programmers ask specific questions to verify the Netgraph data.
::::
::::-
:::::
::::::::::::::
:::::::::
:::::::::::::::::::
:::::::::
..1 ..
~...
.
...
. . ... . .111-1
.. ... .-°.•.° ... % .. o -. °-. .•.° °.... .. .° ., .... . .... .. . °•°..... . . . .. :. ; - -. .*.- ... * * *.*: : . °. ° . . ....... . ...... . .. .. . ..°. .*.*.*..X
...
X::.:-:-:-:
X:.::::
:
1.2.6 Posters
Posters, distinct from Charts are rarely being used because they are difficult to create. They are simply mini-versions of the CardWall. Posters are given to the client to hang on the wall for display or to document the process. The use of posters is to get the company to identify itself with the programming process and the decisions they made during the project.
Chapter 2- Scope
Chapter 2 - Scope
This chapter follows from the definition and description of the programming practiced by Henn Architekten Ingenieure in the previous chapter. The purpose of this chapter is to describe and analyze suggestions to improve the programming process with electronic media. These suggestions come from both Design Technology and Henn Architects. The chapter starts with a brief historical introduction to the project, and goes into the sugges-tions for improving the CardWall. Finally, an analysis is made about how and where to
apply these technologies to programming. 2.1 Brief History
During the spring of 1996, the Henn Architecture group made contact with members of Design Technology at MIT with an interest in improving and automating the Program-ming methodology through information technologies. The Henn group envisioned improvements over the traditional methods and technologies that are currently being used. This project has culminated in the development of prototype software and applica-tions development of systems described in this paper.
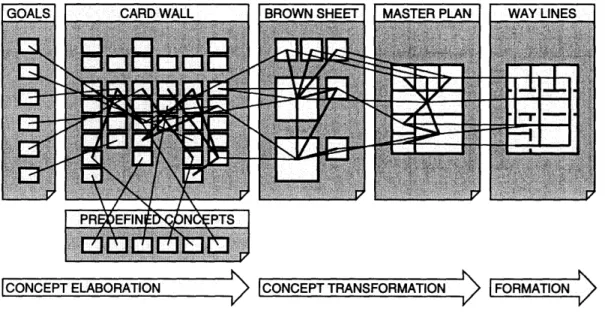
In the fall of 1996 Paul Keel, Bill Porter and I began work on the project by looking far into the future of the CardWall and the programming process. Rather than simply auto-mating and computerizing the system, the goal was to create a system that would provide additional knowledge to the programming methodology. The CardWall would become more than an idea board of contributor's suggestions, but rather, an intelligent way to classify and organize information. Much like a knowledge-base system, the CardWall would contain intelligent information that could be connected to ideas. In addition, the ideas themselves could be connected together and reorganized to suit particular needs. The group also envisioned the BrownSheet being closely connected to the CardWall, so that the flow of the ideas that exist on the CardWall could easily be connected to the BrownSheet. Furthermore, the BrownSheet could be extended to the preliminary design stage and the MasterPlan stage.
In December of 1996, the Design Technology group presented a series of concepts and a prototype that represented these ideas. Based on this, the Henn group supported the financial proposition for the project to commence. In initial meetings they provided input addressing the important aspects of the project.
2.2 Suggestions for Change
The following paragraphs list the objectives of the Henn group and the Design Technol-ogy group for the progression of the project.
2.2.1 Grouping Strategies
Since the matrix structure used during programming is one way of organizing the data found within the CardWall, Henn Architects found it important to focus on other ways to group and classify data. For example, the CardWall could contain different layers that could be used to sort cards. Cards could be placed different on different layers to
empha-size categorization within certain groups. Another suggestion from the programmers is that each card contains a time stamp, and that the cards could be grouped by that cat-egory. Similarly this can be done by connecting the ideas (cards), placing different priorities on them, marking them with different colors, or organizing them according to the header card they are associated with.
In addition to analyzing different possible grouping strategies for software prototypes, other commercial software will be analyzed. This includes "brain-storming" software, graphing software, and whiteboard software for group collaboration. The Henn group concluded that the current offerings on the market be scrutinized, in case off-the-shelf software could be used. In addition, different programming methodologies are to be studied within the field of architecture. This would yield a benchmarking comparison with systems of a similar nature.
2.2.2 Creating a Database
To contain all the data contained by the many cards created during Programming (>300 cards for most projects), the Henn group needs to store the data in a consistent, accessible and secure way. Henn Architects also needs to alleviate the logistical problems associated with having to move the large board of cards off site at the beginning of the design stage. They need to prevent the order (hence the location in the matrix) of the cards being forgotten when they are taken off of the wall. Finally, they would like to store much more information for each card than is currently stored. For this, Design Technology suggests
storing cards within a commercial database. This would allow the card to be much more than an ordinary graphical representation of an idea with a picture and some text, but possibly a container or link to a rich supply of information.
The Henn programmers would like an archive of cards from other projects that would be searchable based upon different criteria. For example, the cards could be sorted accord-ing to the date that they were created or by the theme of the programmaccord-ing session in which they were created. Cards could be sorted according to the project that they were created in. It would not be necessary to sort by the person who created them, since it is
important to retain anonymity during programming.
Most commercial databases provide a graphical interface to enter and update data. This could be used to create cards and input card data. It could be used to access the data from
a remote site and to archive older projects, storing a large amount of useful information for future projects and historical purposes. For these reasons, the database was consid-ered one of the first things to work on in this project.
2.2.3 Creating Marketing Tools
A large part of the value of the Henn Programming process lies in its intangibles. In order for the Henn group to obtain clients, they must be able to successfully market and pro-mote their products and design philosophies. For this reason, promotional materials are extremely important to Henn Architects. In the past, the group has created well-designed
Chapter 2- Scope
and appealing pamphlets and materials outlining programming and its virtues. The pamphlets are distributed to Henn Architects' potential clients to introduce them to programming. They would like to expand these capabilities through information technol-ogy. For example, Dr. Henn suggests that for an exhibit in a museum of a previous project (Audi-VW) the programming cards be displayed via a computer terminal for
others to see how the museum was built. This would lend credence to Programming as well as the design of the building itself.
Another use of promotional materials is in meetings for potential clients. An archive of old CardWalls might be brought up on the computer to demonstrate the basic program-ming concepts from previous jobs. The ability to show animation and movement would also be appealing for displaying demos to clients.
The Henn group has focused on the WWW as a medium to for distributing promotional materials. The reason for this is the "free" and public nature of the WWW, where large amounts of information can be distributed to large groups of people. In addition, the promotional nature of the WWW itself, being a symbol of high technology and the future is an image Henn Architects is happy to embrace.
2.2.4 Knowledge Base of Information
One of the most powerful concepts of the CardWall is its ability to contain and organize information in a graphical way. Extending this concept of a graphical data system has led the Henn group to suggest the development of a knowledge base of information that can be connected to other sources of information. In this scheme, information added to the system can be monitored for connections to other information that has previously been added to the system. When a new piece of data is entered into the system, a flag will show up signifying some connection to other information that may be related.
For example, suppose a member of a group interview session on Monday noted that there is only a 3-foot clearance for pipe within a certain building duct. This information would be stored in the database. On the following Tuesday, if another member of the team in a different department suggested that the pipes be made large than their current 2' diam-eter, a flag would raise telling the programmer at the time the idea was suggested that this issue had been raised before.
Intelligent "case-based" or learning systems are the subject of sophisticated artificial intelligence research. Although this project does not intend to cover this field in depth, the Henn group has suggested this area of research in the long-term strategy of the project.
A more readily applicable feature is the creation of direct links between cards and
engineering drawings such as floor plans and the HVAC layout. This feature will be closely connected to the task of creating the database to hold the information contained within the CardWall.
2.2.5 Quick Scanning of Cards
Some of the most practical issues can delay the most sophisticated idea. In order for the
programming process to be successful in a computerized form, there must be a way for the cards to be scanned in quickly and without effort. The Henn group puts a strong
emphasis on the quality of the cards it uses during programming, and has formed an identity for itself with the bold, colorful and uniform look of the cards it produces. The identity of these cards is very much synonymous with the identity of the company and the work that they produce. The artistry involved with the creation of the cards is highly developed and is clearly not reproducible with modem software tools.
Another limitation to using software to draw the cards is trying to display the cards as they are being drawn. During the group interviews, the cards are very rapidly drawn and displayed upon a large poster board as a reminder of the ideas that have been suggested during the session. It would severely slow down programming if the employees had to create and save files. The employees would also have to have some way of placing them on a very large monitor that would have enough resolution to see the details of each one. The Henn group and Design Technology recognized from the beginning of the project that the "look and feel" of the cards and the CardWall holds high value for the company and that modem computerized drawing tools are inadequate for the extemporaneous type of drawing done during programming. A brief analysis of the available software and hardware available revealed that without better tools for drawing free-hand pictures on a computer, the alternative is to find an easy way to digitize the cards that exist.
The suggestion for scanning cards implies making design decisions in the "problem seeking" stage. Ironically this defies the methodologies of Henn and Problem Seeking. The Design Technology group considered scanning to be a less important facet at the early stage of the project.
2.2.6 Representation of Flows within CardWall
Another aspect of the project is finding a way to represent flows of concepts and ideas in a visual way. Inherent in much of the way that programming is done are relationships among the cards on the CardWall. These relationships may be precedence, communica-tion, physical movement, entrances and exits of buildings etc. If the relationships among the data that comes from the client during the group interviews are effectively linked and displayed in intelligent ways, there is much value gained to the display.
One way that relationships among data can be displayed is the use of precedence relation-ships among activities that are known to be related. These small networks could be displayed as PERT charts within the CardWall. For example, a group of people describ-ing facts concerndescrib-ing the way they work over the period of a day could be linked together in this manner to express the order in which they work. Different types of flows or connections may also represent where the different people worked together to create a common goal. The CardWall contains a much higher value if two ideas may be linked in
Chapter 2- Scope
this way.
The Netgraph, which was mentioned before, is another way to represent flows in a graphical, flexible way. The Netgraph shows the flow of communication among people within an organization. These results could be formulated as an integrated part of the CardWall. Since the Netgraph exists outside of the rest of the Programming that Henn does, it is one objective of the company to combine the information contained within the Netgraph with the ideas within the CardWall and the BrownSheet.
For example, a simple version of the Netgraph could be part of the CardWall interface, showing connections within the Netgraph in other representational ways. The current version of the Netgraph shows connection between department by a matrix of dots. Another way to represent the data might be to automatically draw a bubble diagram based upon the Netgraph that would loosely demonstrate connections between the departments. It could show the connections between them as very thick lines to demon-strate that there is a high level of communication between them.
2.2.7 Creating Charts
Charts are used to demonstrate ideas to clients after the group interviews have been performed. The charts are typically ImXlm and are displayed on large boards similar to the CardWall. An electronic CardWall may help to create these charts by using digital cards from the CardWall as parts of the charts.
2.2.8 Creating the BrownSheet
There are a large amount of improvements that can be made to the existing BrownSheet. The Henn group would like to see the BrownSheet have extended capabilities, somewhat like a spreadsheet which could be used to compute areas automatically and sum up the areas with their projected unit costs to reach preliminary cost estimates. In addition, the ability to quickly make changes and store the information easily would be of great benefit. One the most obvious potential improvements is the elimination of the cutting and pasting of the white pieces of paper to resize the spaces.
Currently, the Henn programmers use spreadsheets to calculate the costs of the spaces which they extract from the needs section of the Netgraph. As a tool for clients, it would be helpful to see a graphical demonstration of the trade-off of area vs. cost for different types of spaces (office vs. labs vs. social). This would take the form of a pie or bar chart at the top of the BrownSheet.
2.2.9 Creating Documentation
Much of the documentation that is given to the client is created via a laborious process of pasting the cards from the project into a large book. As mentioned in the description of the documentation from the first chapter, a large part of the part of the programming book that is given to the client is simply all of the cards from the programming sessions pasted into the book, seven to a page, in laser-copied color formats. These are organized by
categories of ideas that the programmers decide are relevant to the design. This clearly consumes an extremely large amount of time for the employees of the company.
Another problem with the documentation is its static form. The text cannot be searched or rearranged easily. If the employees wish to insert a card at the beginning of the docu-ment, it is not easy to remove them without replacing the entire document. It is also valuable to arrange the cards into different sorting strategies. For example, to arrange the cards by the date that they were created in addition to session that they were created in. Finally, an electronic CardWall might be a form of documentation itself. In this form, it could continue its useful life. The clients could expand it by adding to the knowledge-base capability of the CardWall. As the project progresses, project managers could link the cards to shop drawings and specifications. Even after the project, the results of the goals could be linked to the goals of the CardWall.
2.2.10 Creating Graphical Displays
Graphical Displays are an extension and addition to the application of the CardWall and BrownSheet as promotional material. The creation of graphical displays involves the use of interactivity, animation, and user interfaces to achieve a medium for presentations and displays. Particularly in the case of museum exhibits and information sessions, this type of interface is appealing.
This aspect of the project can also serve as an interface to load, save and edit different projects, or to switch between the BrownSheet and the CardWall. This is connected to the knowledge base and the database aspects of the project as well.
2.2.11 Other Features
In later interviews, programmers (Kohlert; Ziriakus, 1997) were asked to outline the areas where information technologies would help them the most. The programmers would like to see hierarchies of information available to them based upon the level of detail of the cards. For example they could link a card stating the goal of "we need more light in the offices" with another card "add more lights" and finally a card labeled "need 100 Watts per desk". This could appear in a hierarchical form, where different levels of information could be displayed outlining different details of information.
Another suggestion was made for different linkages to represent different connections between cards. In this manner, each card could have a series of comments associated with it. The comments would contain keywords that could be searched and categorized. Based on the keywords, cards could automatically be linked together to form groups of connec-tions among them. This would be similar to the system the programmers currently use, of placing small yellow markers on the cards to indicate a higher level of importance. Using this method, they would not have to explain hundreds of cards to clients, but could explain only the important ones.