Publisher’s version / Version de l'éditeur:
Vous avez des questions? Nous pouvons vous aider. Pour communiquer directement avec un auteur, consultez la première page de la revue dans laquelle son article a été publié afin de trouver ses coordonnées. Si vous n’arrivez pas à les repérer, communiquez avec nous à PublicationsArchive-ArchivesPublications@nrc-cnrc.gc.ca.
Questions? Contact the NRC Publications Archive team at
PublicationsArchive-ArchivesPublications@nrc-cnrc.gc.ca. If you wish to email the authors directly, please see the first page of the publication for their contact information.
https://publications-cnrc.canada.ca/fra/droits
L’accès à ce site Web et l’utilisation de son contenu sont assujettis aux conditions présentées dans le site LISEZ CES CONDITIONS ATTENTIVEMENT AVANT D’UTILISER CE SITE WEB.
Glass Performance Days 07 Proceedings, pp. 1-13, 2007-06-15
READ THESE TERMS AND CONDITIONS CAREFULLY BEFORE USING THIS WEBSITE.
https://nrc-publications.canada.ca/eng/copyright
NRC Publications Archive Record / Notice des Archives des publications du CNRC :
https://nrc-publications.canada.ca/eng/view/object/?id=05d6ae9a-6987-4e7b-b193-ad59e68546e6 https://publications-cnrc.canada.ca/fra/voir/objet/?id=05d6ae9a-6987-4e7b-b193-ad59e68546e6
NRC Publications Archive
Archives des publications du CNRC
This publication could be one of several versions: author’s original, accepted manuscript or the publisher’s version. / La version de cette publication peut être l’une des suivantes : la version prépublication de l’auteur, la version acceptée du manuscrit ou la version de l’éditeur.
Access and use of this website and the material on it are subject to the Terms and Conditions set forth at
Selection of optimum low-e coated glass type for residential glazing in
heating dominated climates
http://irc.nrc-cnrc.gc.ca
S e l e c t i o n o f o p t i m u m l o w - e c o a t e d g l a s s t y p e
f o r r e s i d e n t i a l g l a z i n g i n h e a t i n g d o m i n a t e d
c l i m a t e s
N R C C - 5 0 2 5 3
B a r r y , C . J . ; E l m a h d y , A . H .
A version of this document is published in / Une version de ce document se trouve dans: Glass Performance Days 07 Proceedings, Tampere, Finland, June 15-18, 2007, pp. 1-13
The material in this document is covered by the provisions of the Copyright Act, by Canadian laws, policies, regulations and international agreements. Such provisions serve to identify the information source and, in specific instances, to prohibit reproduction of materials without written permission. For more information visit http://laws.justice.gc.ca/en/showtdm/cs/C-42
Les renseignements dans ce document sont protégés par la Loi sur le droit d'auteur, par les lois, les politiques et les règlements du Canada et des accords internationaux. Ces dispositions permettent d'identifier la source de l'information et, dans certains cas, d'interdire la copie de documents sans permission écrite. Pour obtenir de plus amples renseignements : http://lois.justice.gc.ca/fr/showtdm/cs/C-42
Selection of Optimum Low-E Coated Glass Type for Residential Glazing in Heating Dominated Climates.
Christopher J. Barry, Director of Technical Services, Pilkington NA Inc. Member of the NSG Group, Ohio, USA
Hakim Elmahdy, Ph. D., MBA, P. Eng., Principal Research Officer, Institute for Research in Construction, National Research Council of Canada, Ottawa, Ontario, Canada
Keywords:
1- Low-emissivity, 2- Passive-Solar, 3- Energy, 4- Residential-Glazing Abstract
A scientific study employed research grade facilities to control and monitor the summer and winter energy usage of two identical houses, with simulated occupancy, using two, commonly used and different high performance low emissivity coated glass types in a heating dominated region of Canada.
All low emissivity coatings improve window glazing thermal properties by reducing the flow of far infrared (IR) radiation from the heated space in winter. Glass is opaque to far IR. A low emissivitycoating is effective in winter byreflecting far IR when on #2 surface. (#1 is the exterior of 4 surfaces in double glazing). When on #3 surface a low emissivity coating works by reduced emission (of far IR radiation), thus lowering the U-Factor. But coating performance differences in the near IR (solar) range are often overlooked. Different low emissivity coatings can: transmit, reflect or absorb solar IR energy and thus cause significant differences in total residential energy consumption.
The importance of selecting an appropriate low-e coating was demonstrated by this detailed study, which compared a ‘Reference House’ with a low U-Factor, high SHGC (Solar Heat Gain Coefficient) glazing to a ‘Test House’, which had glass with a slightly lower U-Factor and a much lower Solar Heat Gain Coefficient.
The total annual heating energy savings in the Reference House considerably outweighed the increase in the air conditioning load when compared to the Test house, giving an overall net energy savings for the high SHGC glazing.
The case study also demonstrated agreements between the field measurements and corresponding computer simulation results.
Introduction:
Advanced glazing systems usually include a spectrally selective glass composition, with or without a low emissivity coating, (more common in commercial buildings) or a spectrally selective, low emissivity coating on clear glass to provide some means of controlling heat gains and losses though windows. A low emissivity coating on glass is most effective during cold periods, when the room’s infrared radiation is retained in the enclosed space. There exist, however, solar characteristics of the coating that control how much solar heat is transmitted through the glazing during the daytime and enters into the indoor environment. Proper selection of the coated glass will provide different benefits during heating and cooling seasons. Glass manufacturers have made available several types of coated glass with a wide selection of spectrally selective properties. In most cases, the thermal performance characteristics of these glazings and their impact on the heating and cooling loads in buildings, are based on computer simulations with limited field experiments to verify or validate their impact on whole-house heating and cooling.
While adding low emissivity (Low-E) coatings invariably improves the thermal control of unwanted conductive heat losses and heat gains through a window, it is often not realized that different clear, Low-E coatings can transmit or reject large amounts of invisible near infrared solar energy.
The objectives of this project are to quantify, both experimentally, and analytically by means of computer simulation, the impact on energy consumption in residential houses when two different types of coated glazing are used.
The test was designed to compare the differences in net annual energy consumption when using High Solar Gain Low-E glass versus Low Solar Gain Low-E glass with a slightly lower emittance.
Test facility
Two identical houses at Canadian Center for Housing Technology, (CCHT), built on the National Research Council of Canada’s complex in Ottawa) were used (see Figure 1). They have been in use since 1998 to isolate and measure the effectiveness of a variety of energy related items (e.g., furnaces, heat pumps, washers, driers, heat recovery systems, etc.). For more information about the CCHT facility, refer to http://www.ccht-cctr.gc.ca
Figure 1 The research houses on the National Research Council of Canada campus The two houses represent typical, current 2 story, single family residences. They were built to Canadian R-2000 insulation levels, and with good air-tightness [1]. They were built to be as identical as possible and had simulated occupancy using computer controlled incandescent bulbs in various locations and automatic operation of showers and appliances to reproduce the energy input and usage of a family of 4 persons.
The houses have the following details (see Table 1 below).
Feature Details
Construction Standard R-2000
Livable Area 210 m2 (2260 ft2), 2 stories
Insulation Attic: RSI 8.6, Walls: RSI 3.5, Rim joists: RSI 3.5
Basement Poured concrete, full basement
Floor: Concrete slab, no insulation
Walls: RSI 3.5 in a framed wall. No vapor barrier.
Garage Two-car, recessed into the floor plan; isolated control
room in the garage
Exposed floor over the garage RSI 4.4 with heated/cooled plenum air space between insulation and sub-floor.
Windows Area: 35.0 m2 (377 ft2) total, 16.2 m2 (174 ft2) South
Reference House: Double glazed, high solar heat gain low-e coating on surface #3.
Insulated spacer, argon filled, with argon concentration measured at 92% average after 8 years.
Test House: Double glazed, low solar heat gain low-e coating on surface #2 and argon filled.
Air Barrier System Exterior, taped fiberboard sheathing with laminated
weather resistant barrier. Taped penetrations, including windows.
Air-tightness 1.5 air changes per hour (ach) @ 50 Pa (1.0 lb/ft2).
Combined with the mechanical ventilation there was an average of 0.20 ach during the test program.
Furnishing Unfurnished Table 1 House characteristics
House preparation
The windows were adapted to a dry glazing system with foam tape seals to facilitate glass changes. Then, for one week, the benchmarking process monitored the energy consumption to ensure it was equal in both houses with identical glazing.
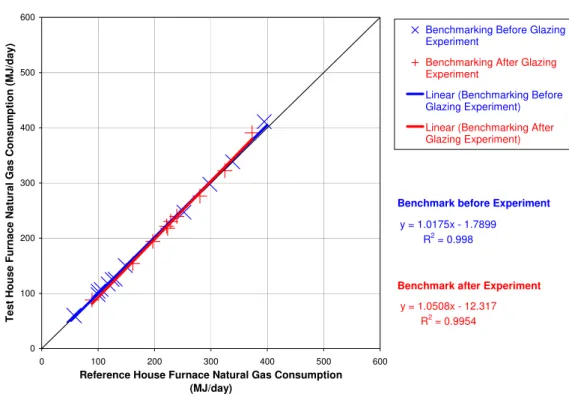
Figure 2 below illustrates the results of the winter benchmarking of the two houses, both before and after the winter test period. It illustrates the energy consumption equality of the two houses.
Furnace Natural Gas Consumption
y = 1.0175x - 1.7899 R2 = 0.998 0 100 200 300 400 500 600 0 100 200 300 400 500 600
Reference House Furnace Natural Gas Consumption (MJ/day) Te st Hou se Fur nace Na tur a l Gas Consu m p ti on (MJ/ day )
Benchmarking Before Glazing Experiment
Benchmarking After Glazing Experiment
Linear (Benchmarking Before Glazing Experiment) Linear (Benchmarking After Glazing Experiment)
Benchmark after Experiment
Benchmark before Experiment
y = 1.0508x - 12.317 R2 = 0.9954
Figure 2 - Winter Benchmarking Furnace Gas Consumption Curve before and after the experiment.
Following the completion of the winter benchmarking the Test house was fitted with Low SHGC, lower emittance, Low-E glass, (the Reference house had High SHGC, Low-E glass).
Table 2 below provides the thermal characteristics of the two types of windows in the two houses.
High solar heat gain glazing Low solar heat gain glazing Center of Glass U-factor
(W/(m2.K)) 1.65 1.36
Center of Glass Solar Heat
Gain Coefficient (SHGC) 0.72 0.41
Center of Glass Visible
Transmission 0.72 0.75
Weighted average
window values
U-Factor 1.76 1.62
SHGC 0.52 0.33
Table 2 Thermal characteristics of windows in the two houses
Field measurements with pyranometers confirmed the calculated glass SHGC values as listed in Table 2 above. Argon gas content measurements were made for all windows to confirm the Argon concentration inside the IG (Insulating Glass) cavity. A non-contact Low-E detector was used to ensure the correct location of the Low-E coatings on all windows.
Test procedure:
The thermostat settings were at 25.6 °C summer and 22 °C Winter, in accordance with ASHRAE Standard for Residential Buildings, 90.2-2004 [2]
Full details of the Operating Conditions of the two houses are in the Table 3 below.
System Reference House Test House
1a Furnace
High efficiency condensing gas furnace; continuous circulation, 94% steady state efficiency (measured)
High efficiency condensing gas furnace; continuous circulation, 94% steady state efficiency (measured)
1b Air Conditioner 2 ton, 13 SEER system 2 ton, 13 SEER system
2 Thermostat Setpoint 22°C (72 °F) winter
25.6°C (78 °F) summer 22°C (72 °F) winter 25.6°C (78 °F) summer 3a Heat Recovery Ventilator (HRV) - Winter
On low speed continuous (65 cfm) 84% apparent sensible
effectiveness (nominal)
On low speed continuous (65 cfm) 84% apparent sensible effectiveness (nominal) 3b Heat Recovery Ventilator (HRV) - Summer
On low speed continuous (62 cfm) 80% apparent sensible
effectiveness (nominal)
On low speed continuous (62 cfm) 80% apparent sensible
effectiveness (nominal)
4 Interior Doors All interior doors open All interior doors open
5 Window Exterior
Shades
No shades on the west-facing diamond shaped window, or the south-facing bedroom window containing the pyranometer All other interior blinds down with slats in the horizontal position
No shades on the west-facing diamond shaped window, or the south-facing bedroom window containing the pyranometer All other interior blinds were down with slats in the horizontal position
6 Windows Closed Closed
7 Simulated Occupancy Standard Schedule. Four person. Standard Schedule. Four person.
8 Humidifier Off Off
9 Hot Water Heater Standard Gas, 67% efficiency (measured) Standard Gas, 67% efficiency (measured) 10 Thermostat
Programmable thermostat, Standard central location on first floor
Programmable thermostat, Standard central location on first floor
Table 3 Operating Conditions for the test periods
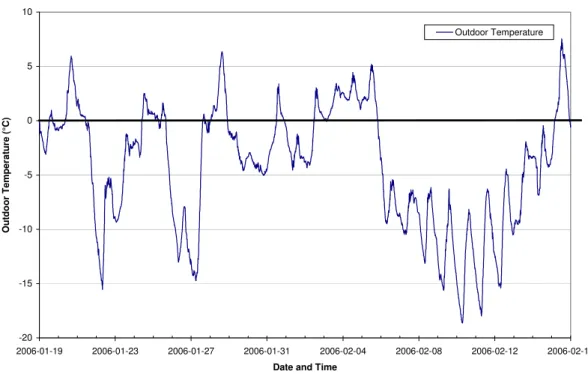
The winter month of January in Ottawa, Ontario, had temperatures that varied from -18.6 °C to 7.5 °C, and South face daily incident solar radiation up to 1100 W/m2.
During the summer month of July in Ottawa, Ontario, the outdoor temperature varied from 12 °C to 33 °C, and the South face daily incident solar radiation was up to 610 W/m2.
Figures 3, 4, 5 and 6 provide the daily outdoor temperatures and the daily Solar Radiation at the test site during the winter and summer test periods.
Outdoor Temperature during Winter Window Glazing Experiment
-20 -15 -10 -5 0 5 10 2006-01-19 2006-01-23 2006-01-27 2006-01-31 2006-02-04 2006-02-08 2006-02-12 2006-02-16 Date and Time
Ou td oo r Temp er at u re ( °C) Outdoor Temperature
Solar Radiation during Winter Window Glazing Experiment 0 200 400 600 800 1000 1200 2006-01-19 2006-01-23 2006-01-27 2006-01-31 2006-02-04 2006-02-08 2006-02-12 2006-02-16 Date and Time
Solar Ra d iatio n i n ciden t o n a ve rt ic al so ut h -f a c in g su rf ac e, W /m 2 Vertical Solar
Figure 4 - Solar Radiation Incident on a Vertical South-facing surface, during Winter test period
Outdoor Temperature during Summer Window Glazing Experiment
0 5 10 15 20 25 30 35 40 2006-07-07 2006-07-11 2006-07-15 2006-07-19 2006-07-23 2006-07-27 2006-07-31
Date and Time
O u td o o r T emp erat u re ( °C) Outdoor Temperature Excluded from Data set
Solar Radiation during Summer Window Glazing Experiment 0 100 200 300 400 500 600 700 2006-07-07 2006-07-11 2006-07-15 2006-07-19 2006-07-23 2006-07-27 2006-07-31 Date and Time
S ol a r R a di a ti on i nc ide nt on a v e rti c a l s o uth-fa c in g s ur fa c e , W /m 2 Vertical Solar
Excluded from Data Set
Figure 6 - Solar Radiation Incident on a Vertical South-facing surface, during Summer test period
Results:
Winter Test Results
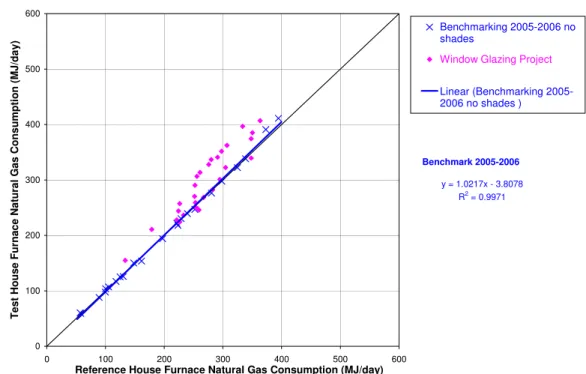
With no windows or doors opened at any time the average daily energy consumed to keep both houses at the same temperature was 277 W greater (or 7.8 %) for the Test house with Low SHGC windows.
Figure 7 below shows the difference in natural gas consumption between the two houses (where the low solar heat gain glazing is installed in the test house and the high solar heat gain glazing is installed in the reference house.
Furnace Natural Gas Consumption y = 1.0217x - 3.8078 R2 = 0.9971 0 100 200 300 400 500 600 0 100 200 300 400 500 600
Reference House Furnace Natural Gas Consumption (MJ/day)
Test House Fur
nac e Natura l Gas Cons umpti on (MJ /da y) Benchmarking 2005-2006 no shades
Window Glazing Project
Linear (Benchmarking 2005-2006 no shades )
Benchmark 2005-2006
Figure 7 Comparison of the natural gas consumption of the reference and test houses. The winter testing and monitoring continued for one month, where natural gas and electricity consumptions were recorded for both houses. Then the Test House was re-glazed with the original High SHGC windows. The Benchmarking was repeated to ensure that there no major changes occurred in the house performance as a result of the glazing changes; see Fig 2 (Section. House Preparation).
Summer Test Results
With no windows or doors opened at any time, the annual energy consumed to keep both houses at the same temperature was 654 kWh greater (27%) for the Reference House with high SHGC windows.
Figure 8 below shows the difference in electrical consumption between the two houses (where the low solar heat gain glazing is installed in the test house and the high solar heat gain glazing is installed in the reference house).
A/C & Furnace Electrical Consumption y = 1.0813x - 0.6626 R2 = 0.9805 0 5 10 15 20 25 30 35 40 0 5 10 15 20 25 30 35 40
Reference House A/C & Furnace Daily Electrical Consumption (kWh) T est Ho u se A /C & F u rn ace D aily Elect ri cal Co n su m p tio n (kW h ) Benchmark 2006 26°C Window Glazing Project Linear (Benchmark 2006 26°C)
Benchmark 2006
Figure 8 Comparison of the cooling energy consumption of the reference and test houses during summer period.
Comparison between experimental and analytical methods:
Programs: RESFEN [3], HOT2000 [4] and ESPr [5] were used (with the recorded actual weather data) to simulate the operation of the two houses during winter and summer test periods. Based on the comparative results of the three simulation programs it was evident that the results produced by ESPr were the closest to the actual performance results (the predicted winter value was 2.5% lower than actual measured consumption).
-20 -10 0 10 20 30 40 50 60 70 2 006 -01-1 9 2 006 -01-2 0 2 006 -01-2 1 2 006 -01-2 2 2 006 -01-2 3 2 006 -01-2 4 2 006 -01-2 5 2 006 -01-2 6 2 006 -01-2 7 2 006 -01-2 8 2 006 -01-2 9 2 006 -01-3 0 2 006 -01-3 1 2 006 -02-0 1 2 006 -02-0 2 2 006 -02-0 3 2 006 -02-0 4 2 006 -02-0 5 2 006 -02-0 6 2 006 -02-0 7 2 006 -02-0 8 2 006 -02-0 9 2 006 -02-1 0 2 006 -02-1 1 2 006 -02-1 2 2 006 -02-1 3 2 006 -02-1 4 2 006 -02-1 5 C ha ng e i n D a il y E ne rgy C o ns um pt ion to LS W in d ow s ( M J /d a y ) Actual Measured Predicted Estimate
Figure 9 Comparison of actual measured energy consumption with simulation results for winter testing period.
A similar comparison between actual and predicted summer cooling energy was within 8%, with the predicted value being lower.
The city by city results of annual energy costs with different glazing types are shown in the tables below using current (December 2006) energy costs for 17 different locations. The ESPr program was used to predict month by month annual energy consumption using actual average weather data for a number of North American cities. The program simulated natural summer night time cooling by opening 8% of the windows during the night when the outside temperature fell below 24 °C, as opposed to the summer test when all the windows were closed all the time.
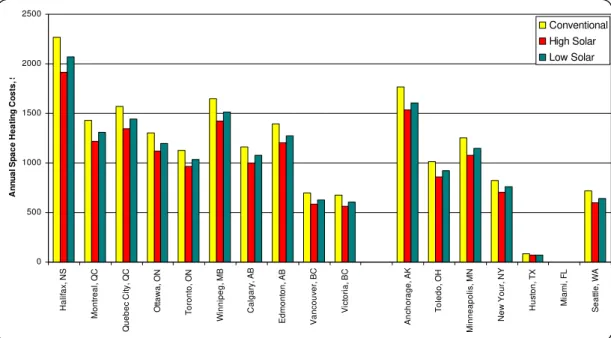
Figure 10 shows the heating energy costs for several locations across North America,
computed with the ESPr program for 3 different glazing types. Note: ‘Conventional’ type refers to: clear, double glazing, no Low-E coating, and no gas fill.
Figure 11 shows the computed cooling energy costs for the same three different glazing types in several locations in North America.
0 500 1000 1500 2000 2500 H a lif ax , NS M ont real , Q C Q ueb ec C ity , Q C Otta w a , ON T o ront o, O N W inni peg , M B C al gar y , A B E dm ont on, A B V a nc ouv er , B C Vi ct o ri a , BC A n ch or ag e, A K To le d o , OH M inne apo lis , M N Ne w Y o u r, NY Hu st on, T X Mi a m i, F L S e a ttl e , W A A n n u al S p ace H ea ti n g C o st s , $ Conventional High Solar Low Solar
Figure 10 Bar graph showing Heating costs computed for N.A. locations (US locations in US$. Canadian locations in Can$).
Annual Cooling Energy Costs -100 200 300 400 500 600 700 Ha lif a x , NS Mo n tr e a l, Q C Q u eb ec C ity , Q C O tta w a , O N Tor o nto , O N Wi nn ip eg , M B Ca lg a ry , A B Ed m o n to n , AB V a nc ou v e r, B C Vi c to ri a , B C A nc ho rag e, A K To le do , O H M inn ea po lis , M N Ne w Y o u r, NY Hu s to n , T X Mi a m i, F L S e a ttl e , W A A nnu a l C ool ing E ner gy C os ts, $ Conventional High Solar Low Solar
Fig 11 Bar graph showing cooling costs computed for N.A. locations (US locations in US$. Canadian locations in Can$).
Figure 12 below shows the city by city results of the cost difference in total annual energy savings with the high SHGC glazing compared to low SHGC glazing, using current (December 2006) energy costs, for 17 different locations in NA.
-200 -150 -100 -50 -50 100 150 200 H al if ax , N S M ont real , QC Que bec C it y , QC O tta wa, O N Tor ont o, ON W inni peg, M B C a lgar y, A B Edm o n ton, AB Va nco u ver , BC V ic tor ia, BC A n ch or age, A K T o ledo , OH M inneap ol is , M N Ne w Y o rk , N Y H us to n, T X Mi a m i, FL Se att le , W A A n n u a l H e at in g Savi n g s ( $ ) fo r H igh So la r Gai n Annua l Co oli ng Sa v ings ($ ) for Low So la r Ga in
Savings from High Solar Gain Windows
Mia m i, F L X Hu s ton, T
Savings from Low Solar Gain Windows
Figure 12 Total annual energy cost savings between high SHGC and low SHGC glazing in different NA locations (US locations in US$. Canadian locations in Can$).
The 2 maps below (Fig. 13 and Fig. 14) show approximate climatic zones in North America. These are from the North American Energy Star programs, which combine energy loads for heating and cooling.
Figure 13 Canadian Energy Star Zones
Figure 14 U.S.A. Energy Star Zones
The study indicates that overall energy savings will be realized with high SHGC, Low-E residential glazing in Canada and in the northern half of the blue, Northern Climate Zone, in U.S.A.
Conclusions
The NRC test houses demonstrated the accuracy of the residential energy use programs and allowed a sensitive measurement of the reduced overall energy consumption between two
high performance window types where one had higher SHGC even though it had a slightly higher emissivity and U-Factor.
The objectives of this project were to quantify, both experimentally, and analytically by means of computer simulation, the impact on energy consumption in residential houses when two different types of Low-E coated glazing were used.
The summer and winter experimental test programs showed a significant impact on total heating and cooling energy consumption between the use of high and low solar gain, high performance Low-E glass types.
The experimental test results showed that using actual measured weather data and detailed computer modeling can give accurate energy consumption estimates.
Combining the test and simulation results showed that savings of up to $150 in annual energy costs for a two-storey residence could be achieved in Halifax, NS, Canada. Lesser savings are realized across Canada and the northern half of the US Energy Star, Northern Climate Zone, in the U.S.A.
Summary
The use of High SHGC, Low-E residential glazing will save more annual energy than Low SHGC, Low-E, glass in areas where the heating load is greater than the cooling load: i.e. from a line approximately from Portland Oregon to New York City and anywhere Northwards.
Acknowledgements
IRC : Mike Swinton, Marianne Manning, Frank Szadkowski, Anil Parekh, NRCan; and Pilkington (NA) Inc. Member of the NSG Group
References
[1]
R-2000 Standard. Canadian Voluntary Standard for Energy Efficient Housing.
Natural Resources Canada. 2005 . (Refer
http://oee.nrcan.gc.ca/residential/personal/new-homes/r-2000/standard/standard.cfm?attr=4
[2] ASHRAE Standard 90.2-2004 “Energy-Efficient Design of Low-Rise Residential Buildings”. American Society of Heating, Refrigerating and Air-Conditioning Engineers, Inc. Atlanta, GA, USA.
[3]
RESFEN5 – Calculating the Heating and Cooling Energy Use of Windows in
Residential Buildings, Windows and Daylighting Group, Environmental Energy
Technologies Department, Lawrence Berkeley National Laboratory, Berkeley, CA
94720 USA. 2005. Available for free download at
http://windows.lbl.gov/software/resfen/resfen.html.
[4]
HOT2000
TM– Low-Rise Residential Energy Analysis and Design Software.
Developed and distributed by Sustainable Buildings and Communities Group, Natural
Resources Canada, Ottawa. 2006. Available for free download at
http://www.sbc.nrcan.gc.ca/software_and_tools/hot2000_e.asp
[5]


![[PDF] Apprendre ALM cours en pdf | Formation Informatique](data:image/gif;base64,R0lGODlhAQABAIAAAP///wAAACH5BAEAAAAALAAAAAABAAEAAAICRAEAOw==)