Wavelet transforms coefficients and autocorrelation of
gear system for early damage detection
Mouloud Ayad, Mohamed Rezki,
Kamel Saoudi, Mourad Benziane
LPM3E Laboratory, Faculty of sciences and applied sciences,
University of Bouira, Algeria [email protected]
Abderrazak Arabi
LIS Laboratory, University of Sétif1, Algeria
Faculty of sciences and applied sciences, University of Bouira, Algeria.
Djamel Chikouche
LIS Laboratory, University of Sétif1, Algeria
Faculty of applied technology, University of M’sila, Algeria
Abstract— In the last few years, numerous new methods have
been proposed to overcome the complexity of the signals generated by complex machines and those generated by faults. Monitoring and fault diagnosis methods based on signal processing have proved effective in fault identification.
The present paper introduces the theory of wavelet transforms coefficients (WTC) processes and autocorrelation as powerful tools for the diagnosis of rotating machines. This method is applied to for the analysis of vibration signals produced from a gear system under test in order to early detect the presence of faults. An early indication of the presence of a gear defect is obtained at the 10th day of experimentation.
Keywords
—
Wavelet transform coefficients, Early Fault detection, vibration signals.I. INTRODUCTION
Various fault detection methods have been proposed and developed. Methods may be categorized into 4 groups with respect to the domain we have observed. First, spectral analysis and its various application methods are utilized widely: directional spectrum, moving window method, spectral kurtosis, and energy spectrum by amplitude demodulation, and so on. Second, cepstral analysis, which includes power cepstrum, minimum variance cepstrum etc, is used for the detection of fault periods in the quefrency domain. Third, it has been observed by envelope analysis (e.g. high frequency resonance technique, complex envelope etc.). Finally, time-frequency analysis, which is known as an efficient way to detect transient signals, has been devised. In particular, wavelet analysis has recently been widely applied to fault detection because of good resolution on some scales and also in time [1].
Signal processing is an approach widely used for monitoring and fault diagnostics, whose aim is to find a simple and effective signature of the defect. Therefore, a proper signal processing method is needed.
The most popular signal processing methods for bearing vibration analysis is envelope analysis, by which the vibration signal is first operated through a band-pass filter to obtain a high signal-to-noise ratio signal, and then Hilbert transform is used to obtain the envelope. If periodic impulses appear in the envelope, which correspond to bearing characteristic
frequency, then it can be inferred that the bearing is under fault condition [2-3].
The important information and the dominant features contained in the signals can be extracted in order to detect faults in gear systems. Since the vibration signals delivered from gears contain non-stationary components due to gear faults, we must find robust signal processing methods to analyse the non stationary vibration signal [4].
To deal with non-stationary signals, several time frequency and time scale technique analysis were developed such as the short-time Fourier transform (STFT), Wigner-Ville distribution (WVD) or wavelet transform (WT) [5,6].
Due to the poor working conditions, early gear failure information has largely been submerged in the interference of noisy signals. The frequency and time signals from different failures such as wear and tooth broken are quite similar, which makes it difficult to diagnose them directly in time domain or frequency domain. In the time domain analysis, for example, a gearbox fault is detected by monitoring the variation of some statistical indices such as a root mean square value, crest factor or kurtosis [7].
At present, several types of advanced signal processing techniques have been proposed in this field [8-17]. Among these techniques the wavelet transform has been introduced. Wavelet transform is another popular signal processing method for bearing fault diagnosis, due to its flexile time– frequency resolution and excellent capability of detecting transients. The transient characteristics of wavelets can be employed to carry out accurate and effective analysis of signals with complex frequency time structure [18]. Wavelets transform is capable of processing stationary and non-stationary signals in both time and frequency domains. This important approach is increasingly used in condition monitoring.
However, due to large interference detection signal, it’s still difficult to search for singularity of wavelet transform; therefore the autocorrelation analysis is used in the precise positioning to failure.
This paper introduces a simple method based on the autocorrelation function of wavelet coefficients. This method
is applied in order to diagnosis bearing fault to achieve high consistency and detect fault in early stage.
The remaining of this paper is organized as follows: First, the theoretical background of the method used in section 2. The proposed method is applied in order to early detect the fault of real gear systems in Section 3. Finally, in section 5, we give a general conclusion.
II. THEORETICAL BACKGROUND
A. Wavelet transform Coefficients
The wavelet transform represents the signal as a sum of wavelets at different locations (position) and scales (duration). The wavelet coefficients work as weights of the wavelets to represent the signal at these locations and scales.
The wavelet transform is accomplished using the translated and scaled versions of a mother wavelet
ψ
(x
)
defined by:( )
1/2(
)
,b
t
a
t
a
b
a
=
−ψ
−
ψ
(1)
Where (a) and (b) are scaling (dilation) and translation parameters, respectively.
The mother wavelet
ψ
(t) by dilated (parameter b) and translated (parameter a) is designed to balance between the time domain and frequency domain resolution. We can see clearly very low frequency components at large b, which makes the width of the mother wavelet expansive, and very high frequency components at small b, which makes the width of the mother wavelet concentrating [18-20].The wavelet transform of signal x(t) is defined as:
∫
+∞ ∞ − −−
=
dt
a
b
t
t
x
a
b
a
C
(
,
)
1/2(
)
*(
)
ψ
(2)Where
C
( b
a
,
)
denote the wavelet coefficients of signal x(t).(*) is a symbol of a complex conjugate function.
There are different types of mother wavelet functions for different purposes, such as the Haar, Daubechies, Gaussian, Meyer, Mexician Hat, Morlet, Coiflet, Symlet, Biorthogonal and so on. The oldest and most basic of the wavelet systems is the Haar wavelet that is a group of square waves with magnitude of ±1 in the interval [0,1]. This kind of wavelet is conceptually simple and fast, and is particularly suitable for the analysis of signals with sudden transitions. Therefore, The Haar wavelet was adopted.
The Haar wavelet’s mother function ψ , shown in Fig.1, is defined for ∈ [0,1] as follows:
ψ = 1
ψ t = 1, 0 ≤ t ≤ 0,5
−1, 0,5 < ≤ 1 (3)
And ψ t =ψ 2 t − k for i > 1 and we write
= 2 + k for j ≥ 0 and 0 ≤ ≤ 2 . We can easily see that the ψ and ψ are compactly supported; they give a local description, at different scales j, of the considered function [21].
B. Autocorrelation coefficients
In signal processing, the processes whose statistical characteristics vary periodically with time are called cyclostationary processes. Nonstationary signals are considered cyclostationary when some of their statistics are periodic [22]:
f! x, t = f! x, t + T (4)
Where $% &, denotes some appropriate, time varying,
statistic of the signal.
The vibration signals of rotating machinery consist of random and periodic components. Their autocorrelation function exhibits a time-varying, periodic and cyclostationary character. The autocorrelation function is suggested to enhance the periodicity of the fault signature [23].
The autocorrelation presents a better understanding of the evolution of a process through time using the probability of the relationship between data values separated by a specific number of time steps (lags) [23-27].
For a signal & , the autocorrelation function '% is
generally defined as the continuous cross-correlation integral of & with itself, at lag (.
The cross-correlation function of signal & and ) is defined as:
'%* = ∑./0 & , ) , + - (5)
Equation (5) expresses that the sum of ∑./0 & , multiply ) , + - , which is ) , for - sampling points left. If x n = y n , equation (5) defining the cross-correlation function becomes the autocorrelation function.
R! t = E[x t , x t − τ ] (6)
Where (τ) is a time lag.
E[ , ] denotes the mathematical expectation operator. For processes that are also ergodic, the expectation can be replaced by the limit of a time average. The autocorrelation of an ergodic process is defined as:
R! t = lim8→.: x t . x t + τ dt8 (7)
The autocorrelation function reaches its peak at the origin, where it takes a real value, i.e. at any lag (:
|R! τ | ≤ |R! 0 | (8)
III.RESULTS AND DISCUSSIONS
The vibration signals of the gear reductor under study have been provided from CETIM (Centre d’Etudes Techniques des Industries Mécaniques, 52 av. Felix Louat, 60300 Senlis,
France) [28-31]. They are delivered from a reductor operating 24 hours over 24 hours. The dimensions of gear wheels together with the operating conditions (speed, couple) are adjusted so that we obtain a spalling on all the width of a tooth. During experimentation, the system has been stopped every day to observe the state of the wheel teeth.
The gear system consists of two wheels with respectively 20 and 21 teeth. This system operates under fixed conditions 24h/24h.
The rotational frequencies of the two wheels are in the range of 16.67 Hz and the frequency of meshing is in the range of 330 Hz. The Records are made every day for 13 days. The vibration signal from the test has 60160 samples with a sampling frequency of 20 KHz. One of the teeth of a gear wheel was damaged during the experiment.
The expertise report is given in table 1: Day Observations
1 1st day of acquisition, no anomaly
2 No anomaly 3 // // 4 // // 5 // // 6 Crack of tooth 1/2 7 No evolution
8 crack Tooth 1/2 no evolution, tooth 15/16 start of 9 Evolution of crack tooth 15/16
10 // // 11 // //
12 Crack in all width of the tooth 15/16 Table 1: The expertise report [32].
Given the large number of data (60160 samples), it is difficult to treat them all. So, we must choose a reduced number of data without losing information about the system. For this, we must at least cover a period. We have the rotational frequency 16.67Hz and the sampling frequency fsap=20KHz. To calculate the number of samples covering the period, we divide the rotation period T on the sampling period. So the number of obtained samples will be 1200 samples. We choose a number of 1500 samples.
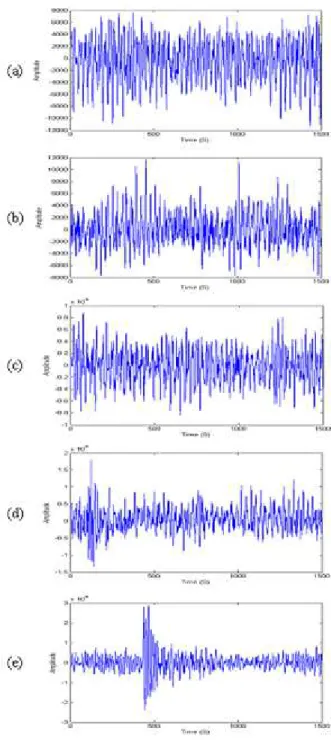
The temporal representations of the signal emitted by the system for each day are given in Fig .2.
Fig. 2. Vibrations recorded during: (a) 8th day, (b) 9th day, (c) 10th day, (d) 11th
day and (e) 12th day. Displaying over 2 periods of rotation relative to the
pinion.
We note that the temporal representation of signals observed each day presents oscillations caused by teeth meshing and a modulation of long duration corresponding to the period of the two wheels (pinion of 20 teeth and wheel of 21 teeth). The vibration signal keeps this shape until the 12th day during which the fault is supposed to appear. We observe a very high increase of signal amplitude around modulations relative to oscillations between these last ones. These observations allow the diagnosis of a fault in the 12th and 13th days.
(a)
(b)
(c)
(d)
(e)
Fig.3. wavelet transforms coefficients (WTC) ofVibratory signalrecorded during: (a) 8th day, (b) 9th day, (c) 10th day, (d) 11th day and (e) 12th day.
Displaying over 2 periods of rotation relative to the pinion.
From Figure 3, we observe that the WTC of the vibratory signal, are similar and have the same order of magnitude until the 9th
day (approximately ≈ 4.5 × 10A ). These small
variations are due to several phenomena and causes mentioned in the expertise report (Table 1).
At the 10th day, an increase of the WTC is observed (approximately≈ 6 × 10A). This increase is the early sign of
the presence of a fault in the gear system. This defect is due to the evolution of the peeling in the 15/16 tooth (the expertise report).
Fig.4. Autocorrelation Vibrations recorded during: (a) 8th day, (b) 9th day, (c)
10th day, (d) 11th day and (e) 12th day.
A: peak of wheel with 21 teeth. B: peak of wheel with 20 teeth.
At the 12th day and with the crack over the entire width of tooth 15/16, the autocorrelation function becomes very large (approximately≈ 7 × 10D).So the WTC applied to the signal
vibratory can detect the presence of a fault at an early day, i.e. the 10th day (2 days before the full appearance of the fault).
Finally, we can say that the WTC of the vibratory signal presents a very effective tool in the early diagnosis of gear reducer’s faults in rotating machinery.
We observe, according to figure 4, from the 2nd to the 9th day the presence of a relatively weak change in amplitude of
peaks of the wheel with 21 teeth and of the pinion with 20 teeth. This change is due to many phenomena such as the level and quality of the lubricant.
At the 10th day, the peaks amplitude of the 21 teeth is increased and this is an early indication of presence of the defect.
At the 12th and 13th day, we observe the appearance of a fault on the pinion in an obvious manner by an increase of the peak characterizing it and by its localization.
IV.CONCLUSION
The wavelet transforms coefficients (WTC) processes and autocorrelation has been shown effective in the fault detection in early stage.
Rotating machines play an important role in many industrial applications. Gear is one of the most important and frequently encountered components in rotating machinery and the significant challenge remains with the monitoring of these gears under fluctuating operating conditions.
The aim of this work is the detection of the fault presence in early stage. The application of wavelet transforms coefficients (WTC) processes and the autocorrelation of to vibratory signals shows effectiveness of this tools. The peak amplitude of the 21 wheel teeth increases in the 10th day. This allows the early detection of gear failure before the 12th day (the day of manifestation of a defect) and the fault localization on the wheel with 21 teeth; but we can’t observe this early detection in the temporal representation of the vibration signals. The results of a real signal test demonstrate that the proposed method is effective.
REFERENCES
[1] C.S. Park, Y. C. Choi, Y. H. Kim, “Early fault detection in automotive ball bearings using the minimum variance cepstrum”, Mech. Sys. and Sig. Proc., 38, pp. 534–548, 2013
[2] L. Zhang, R. X. Gao, K. B. Lee, "Spindle health diagnosis based on analytic wavelet enveloping," IEEE Transac. on Instrum. and Measur., vol. 55, no. 5, pp. 1850-8, 2006.
[3] Wei He, Z. N. Jiang, K. Feng, “Bearing fault detection based on optimal wavelet filter and sparse code shrinkage”, Measurement, Vol. 42, pp. 1092–1102, 2009.
[4] Y. Larsen, A. Hanssen, “Wavelet-polyspectra: analysis of non-stationary and non-Gaussian/non-linear signals”, Proceedings of IEEE Workshop on Statis. Sig. and Arr. Proc., pp. 14–16, 2000. [5] W. J. Staszewski and G. R. Tomlinson, “Local tooth fault
detection in gearbox using a moving window procedure,” Mech. Sys. and Sig. Proc., Vol. 11, no. 3, pp. 331-350, 1997.
[6] Z. K. Peng, F.L. Chu, “Application of the wavelet transform in machine condition monitoring and fault diagnostics: a review with bibliography”, Mech. Sys. and Sig. Proc, Vol. 18, no. 2, pp.199-221, 2004
[7] D.P. Jena, S.N. Panigrahi, R. Kumar, “Gear fault identification and localization using analytic wavelet transform of vibration signal”, Measurement, Vol. 46, pp. 1115–1124, 2013.
[8] G.F. Bin, J.J. Gao, X.J. Li, B.S. Dhillon, “Early fault diagnosis of rotating machinery based on wavelet packets-Empirical mode decomposition feature extraction and neural network”, Mech. Sys. and Sig. Proc, Vol. 27, pp 696–711, 2012.
[9] L. B. Jack, A.K. Nandi, “Fault detection using support vector machines and artificial neural network augmented by genetic algorithms”, Mech. Sys. and Sig. Proc, Vol. 16, pp. 373- 390, 2002.
[10] F. Cong, J. Chen, G. Dong, “Spectral kurtosis based on AR model for fault diagnosis and condition monitoring of rolling bearing”, Mech. Sci. and Tech., Vol. 26, N°2, pp. 301-306, 2012.
[11] Y. Lei, J. lin, Z. He, Y. Zi, “Application of an improved kurtogram method for fault diagnosis of rolling element bearings”, Mech. Sys. and Sig. Proc, Vol. 25, pp. 1738–1749, 2011.
[12] X. Xianga, Z. Ruipinga, L. zhixiong, “Virtual Simulation Analysis and Experimental Study on Gear Fault Diagnosis Based on Wavelet Neural Network”, IEEE Intern. Conf. on Mach. Vis. and Hum-mach. Inter., pp.55-58, 2010.
[13] Hui Li, “Complex Morlet Wavelet Amplitude and Phase Map Based Bearing Fault Diagnosis”, IEEE Proceedings of the 8th
World Congress on Intelligent Control and Automation, Jinan, China, pp. 6923-6926, 1010
[14] M. Shang-Jun, L. Geng, X. Yongqiang, “Gear fault diagnosis based on svm”, IEEE Proc. of Intern. Conf. on Wav. Analy. and Patt. Recog., Qingdao, pp. 140-143, 2010.
[15] J. Yu, L. Zhixiong, G. Yuancheng, “Research on AR Modeling Method with SOFM Based Classifier Applied to Gear Multi-Faults Diagnosis”, IEEE proc. of the 2nd Intern. Asia Conf. on Inform. in
Cont., Automa. and Robo., pp. 488-491, 2010.
[16] X. Wang, C. Liu, F. Bi, X. Bi, K. Shao, “Fault diagnosis of diesel engine based on adaptive wavelet packets and EEMD-fractal dimension”, Mech. Sys. and Sig. Proc, Vol. 41, pp. 581–597, 2013. [17] S. J. Ma, G. Liu, Y. Xu, “Gear fault diagnosis based on Svm”,
IEEE Proceedings of the International Conference on Wavelet Analysis and Pattern Recognition, Qingdao, pp. 140- 143, 2010. [18] I. Daubechies, “The wavelet Transform, Time-frequency
Localisation and Analysis”, IEEE, transa. on inform. theory. Vol. 36, pp. 961-1004, 1990.
[19] M. Ayad, D. Chikouche, N. Boukezzoula, M. Rezki, “Early damage detection of gear systems through wavelet analysis of vibration signals ”, Intern. Jour. of Mech. Engin. and Tech.(IJMET), Vol. 3, Iss. 1, January- April, pp. 277-287, 2012. [20] M. Rezki, I. Griche, M. Ayad, " Comparative Study of Heart Rate
Variability by Wavelets", Intern. Jour. of Scien. Resea. & Engin. Tech. (IJSET), Vol.3, iss 3, pp 73-78, 2015.
[21] H. R. Karimi, B. Lohmann, “A Computational Method to Robust Vibration Control of Vehicle Engine-Body System using Haar Wavelets”, IEEE Proceeding of the International Conference on Control Applications, Munich, Germany, pp. 169-174, 2006. [22] E. Estupinan, P. White, C. S. Martin, A, “Cyclostationary Analysis
Applied to Detection and Diagnosis of Faults in Helicopter Gearboxes”, Springer-Verlag Berlin Heidelberg, CIARP, LNCS 4756, pp. 61–70, 2007.
[23] J. Rafiee, P.W.Tse, “Use of autocorrelation of wavelet coefficients for fault diagnosis”, Mech. Sys. and Sig. Proc, Vol. 23, pp. 1554– 1572, 2009.
[24] W. Su, F. Wang, H. Zhu, Z. Zhang, Z. Guo, “Rolling element bearing faults diagnosis based on optimal Morlet wavelet filter and autocorrelation enhancement”, Mech. Sys. and Sig. Proc, Vol. 24, pp.1458–1472, 2010.
[25] K. F. Al-Raheem, A. Roy, K. P. Ramachandran, D. K. Harrison, S. Grainger, “Rolling element bearing faults diagnosis based on autocorrelation of optimized : wavelet de-noising technique”, Intern. Jour. of Adva. Manuf. Tech., Vol . 40, pp. 393-402, 2009. [26] P.K. Kankar, S. C. Sharma, S.P. Harsha, “Fault diagnosis of
rolling element bearing using cyclic autocorrelation and wavelet transform”, Neurocomputing, Vol. 110, pp. 9–17, 2013.
[27] Ayad M, Chikouche Dj, Boukezzoula N, Rezki M. Gear Fault Diagnosis Across Autocorrelation of Optimal Wavelet Transforms. Special issue - Intern. Conf. on Cont. Eng. & Infor. Tech. (CEIT’14) Proceedings; Vol. 6, pp. 17-21, 2014.
[28] A. Parey, M. El Badaoui, F. Guillet, N. Tandon, “Dynamic modelling of spur gear pair and application of empirical mode decomposition-based statistical analysis for early detection of
localized tooth defect”, Jour. of Sou. and Vibr., Vol. 294, pp. 547– 561, 2006.
[29] Ayad M, Chikouche Dj, Boukezzoula N, Rezki M, "Search of a robust defect signature in gear systems across adaptive Morlet wavelet of vibration signals". IET Sig. Proc.; Vol. 8 (9), pp. 918 – 926, 2014.
[30] N. Haloui, D. Chikouche, M. Benidir, “Application of spectral parameters analysis methods for the detection of gear faults in rotating machines”, IEEE Canadian Conf. on elect. & comp. engin., pp. 190–194, 2002.
[31] Chikouche Dj, Felkaoui A, Haloui N. Diagnostic precoce d’un reducteur a engrenage par analyse des signaux vibratoires a l’aide du cepstre synchrone. Proc. Intern. Conf. On Indus. Engin. and Manuf. (ICIEM’10), May, 9-10, Batna, Algeria, pp. 219-224, 2010