arXiv:0812.3100v1 [nucl-ex] 16 Dec 2008
First results on angular distributions of thermal dileptons in nuclear collisions
R. Arnaldi,1 K. Banicz,2, 3 J. Castor,4 B. Chaurand,5 C. Cical`o,6 A. Colla,1P. Cortese,1 S. Damjanovic,2, 3
A. David,2, 7 A. de Falco,6A. Devaux,4L. Ducroux,8 H. En’yo,9 J. Fargeix,4 A. Ferretti,1 M. Floris,6A. F¨orster,2
P. Force,4 N. Guettet,2, 4 A. Guichard,8H. Gulkanian,10 J. M. Heuser,9 M. Keil,2, 7 L. Kluberg,2, 5 C. Louren¸co,2
J. Lozano,7 F. Manso,4 P. Martins,2, 7 A. Masoni,6 A. Neves,7 H. Ohnishi,9 C. Oppedisano,1 P. Parracho,2
P. Pillot,8T. Poghosyan,10G. Puddu,6 E. Radermacher,2P. Ramalhete,2 P. Rosinsky,2 E. Scomparin,1 J. Seixas,7
S. Serci,6 R. Shahoyan,2, 7 P. Sonderegger,7H. J. Specht,3 R. Tieulent,8 G. Usai,6 R. Veenhof,2 and H. K. W¨ohri6, 7
(NA60 Collaboration)
1Universit`a di Torino and INFN, Italy
2CERN, 1211 Geneva 23, Switzerland
3Physikalisches Institut der Universit¨at Heidelberg, Germany
4LPC, Universit´e Blaise Pascal and CNRS-IN2P3, Clermont-Ferrand, France
5LLR, Ecole Polytechnique and CNRS-IN2P3, Palaiseau, France
6Universit`a di Cagliari and INFN, Cagliari, Italy
7Instituto Superior T´ecnico, Lisbon, Portugal
8IPN-Lyon, Universit´e Claude Bernard Lyon-I and CNRS-IN2P3, Lyon, France
9RIKEN, Wako, Saitama, Japan
10YerPhI, Yerevan Physics Institute, Yerevan, Armenia
(Dated: October 29, 2018)
The NA60 experiment at the CERN SPS has studied dimuon production in 158A GeV In-In collisions. The strong excess of pairs above the known sources found in the complete mass region 0.2<M<2.6 GeV has previously been interpreted as thermal radiation. We now present first results on the associated angular distributions. Using the Collins-Soper reference frame, the structure function parameters λ, µ and ν are measured to be zero, and the projected distributions in polar and azimuth angles are found to be uniform. The absence of any polarization is consistent with the interpretation of the excess dimuons as thermal radiation from a randomized system.
Lepton pairs are a particularly attractive observable to study the hot and dense matter created in
high-energy nuclear collisions. Their continuous emission,
undisturbed by final-state interactions, probes the entire space-time evolution of the fireball, including the early phases with the conjectured QCD phase transitions of
chiral symmetry restoration and parton deconfinement.
To the extent that the bulk constituents of the expand-ing matter (hadrons and partons) equilibrate, the direct lepton pairs generated by them are commonly referred to as ’thermal radiation’. Our previous work has indicated ’thermal’ dilepton production to be largely mediated for
M<1 GeV by π+π− annihilation via the strongly
broad-ened vector meson ρ [1], and for M>1 GeV by partonic
processes like q ¯q annihilation [2, 3]. The two dilepton
variables basically explored in this work were mass M
and transverse momentum pT, where the correlations
be-tween the two were decisive in bearing out the nature of the emission sources in the two mass regions [2, 3].
Further information on the production mechanism and the distribution of the annihilating particles,
comple-mentary to that from M and pT, can be obtained from
the study of dilepton angular distributions. This Letter presents the first measurement of full dilepton angular distributions in the field of high-energy nuclear collisions. It is restricted to the mass region M <1 GeV, due to the lack of sufficient statistics for M>1 GeV. The question asked is simple: can one get direct experimental insight
into whether the radiating matter is thermalized? Historically, the interest in angular distributions of continuum lepton pairs was mostly motivated by the study of the Drell-Yan mechanism, following in particular the insight that the ’na¨ıve’ QED interpretation [4] had to be significantly modified due to QCD effects [5, 6, 7, 8]. The differential decay angular distribution in the rest frame of the virtual photon with respect to a suitably chosen set of axes, ignoring the rest mass of the leptons, can quite generally be written as
1 σ dσ dΩ ∝ (1 + λcos 2θ+ µsin2θcosφ + ν 2sin 2θcos2φ) (1)
The angular dependence on polar angle θ and azimuth angle φ dates back to [9], but the specific coefficients λ,
µand ν, the ’structure function’ parameters, follow the
nomenclature in e.g. [8, 10]. They are directly related to
the helicity structure functions Wi defined in [6], and in
particular to the spin density matrix Rγij∗ of the virtual
photon γ∗, the main object of the spin analysis [7, 10, 11].
We have chosen here the Collins-Soper (CS) reference frame [5], where the quantization axis ~z is defined as the bisector between the beam and negative target momenta ~
pbeamand −~ptarget, which define the reaction plane. The
polar angle θ is then the angle between the momentum
of the positive muon ~pµ+ and the ~z axis, which define
the decay plane, while the azimuth angle φ is the angle between the reaction and the decay planes. However, the
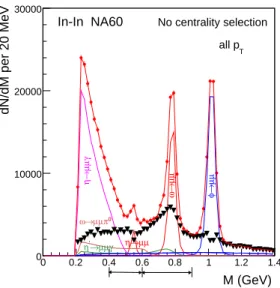
0 0.2 0.4 0.6 0.8 1 1.2 1.4 0 10000 20000 30000 No centrality selection In-In NA60 M (GeV) dN/dM per 20 MeV T all p γµ µ →η µµ → ω µµ →φ 0 π µ µ → ω µ µ → η γ µ µ → ’ η
FIG. 1: Isolation of an excess above the electromagnetic de-cays of neutral mesons (see text). Total data (closed circles), individual cocktail sources (solid lines), difference data (thick triangles), sum of cocktail sources and difference data (line through the closed circles). Open charm still contained. particular choice of the frame is not really relevant here, since the determination of the full set of coefficients λ, µ and ν allows to compute them in any other frame by a simple transformation [8]. This would not apply if only the cosθ distribution would be measured.
In principle, the dilepton angular distributions can be anisotropic, with all structure function parameters
λ, µ, ν 6= 0 [5, 6, 7, 8, 10]. Even for spinless particles
in the initial state like in π+π− annihilation, the
param-eters can still have any value 6= 0, since the spin density matrix of the virtual photon also receives contributions from orbital angular momentum [12]. Very elementary
examples are q ¯q and π+π− annihilation along the beam
direction for pT=0. Here µ=ν=0 and λ=+1 for q ¯q(like
lowest order DY [4]) and λ=−1 for π+π− [12],
corre-sponding to transverse and longitudinal polarization of the virtual photon, respectively. However, a completely random orientation of annihilating partons or pions in 3 dimensions (but not in 2 [11]) would lead to λ, µ, ν = 0 [11, 12, 13], and that is the case of prime interest here. Details of the NA60 apparatus are contained in [3, 14]. The data sample for 158A GeV In-In collisions is the same as used in [1, 2], and the different analysis steps follow the same sequence: assessment of the combinato-rial background from π and K decays by a mixed-event technique, assessment of the fake-matches (associations of muons to non-muon vertex tracks in the Si pixel tele-scope), isolation of the dimuon excess by subtraction of the known meson decay sources and charm from the net opposite-sign sample, and finally correction for accep-tance and pair efficiency. All steps are now done
inde-pendently in each [ dN
dcosθdφ]ij bin. The binning is varied
depending on the goal, thereby assuring that the results
are stable with respect to the bin widths chosen. The assessment of the two background sources and open charm is extensively discussed in the ref. [3]. The centrality-integrated net mass spectrum after back-ground subtraction is shown in Fig. 1 together with the contributions from neutral meson decays: the 2-body de-cays of the η, ω and φ resonances, and the Dalitz dede-cays
of the η, η′ and ω. The data clearly exceed the sum
of the decay sources. The excess dimuons are isolated by subtracting them from the total (except for the ρ), based solely on local criteria [1, 2]. The excess for M<1 GeV is interpreted as the strongly broadened ρ which
is continuously regenerated by π+π− annihilation [1, 2].
Two adjacent mass windows indicated in Fig. 1 are used for the subsequent angular distribution analysis: the ρ-like region 0.6<M<0.9, and the low-mass tail 0.4<M<0.6
GeV. To exclude the region of the low-mT rise seen for all
masses [2], a transverse momentum cut of pT>0.6 GeV
is applied, leaving about 54 000 excess pairs in the two mass windows. The subtracted data for the ω and φ, about 73 000 pairs, are subject to the same further anal-ysis steps as the excess data and are used for comparison. The correction for the acceptance of the NA60 appa-ratus requires, in principle, a 5-dimensional grid in
M-pT-y-cosθ-φ space. To avoid large statistical errors in
low-acceptance bins, the correction is performed in
2-dim. cosθ-φ space, using the measured data for M, pT [2]
and y [15] as an input to the Monte Carlo (MC) simu-lation of the cosθ-φ acceptance matrix. The sensitivity
of the final results to variations of this M-pT-y input has
been checked, and the effects are found to be consider-ably smaller than the statistical errors of the results. The MC simulations were done in an overlay mode with real data to include the effects of pair reconstruction efficien-cies. The product acceptance×efficiency is illustrated in
0 0.5 1 1.5 2 2.5 3 0 0.002 0.004 0.006 | (rad) φ | ∈ × A OutputNewRho 0 0.1 0.2 0.3 0.4 0.5 0.6 0.7 0.8 0.9 1 0 0.002 0.004 0.006 | θ |cos ∈ × A >0.6 GeV T p 0.6<M<0.9 GeV OutputNewRho
FIG. 2: Spectrometer acceptance as a function of the two angular variables |cosθ| and |φ|.
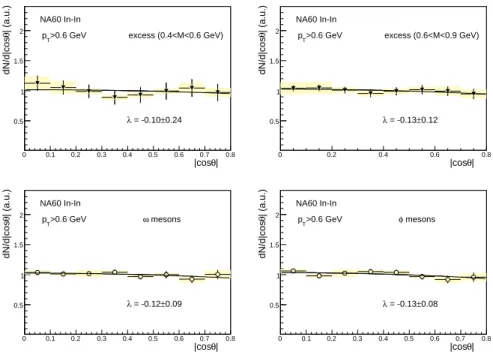
ThetaCS_04M06 Entries 24 Mean 0.3934 RMS 0.2337 0 0.1 0.2 0.3 0.4 0.5 0.6 0.7 0.8 0.5 1 1.5 2 ThetaCS_04M06 Entries 24 Mean 0.3934 RMS 0.2337 ThetaCS_04M06 Entries 24 Mean 0.3934 RMS 0.2337 | θ |cos | (a.u.) θ dN/d|cos 0.24 ± = -0.10 λ NA60 In-In >0.6 GeV T p excess (0.4<M<0.6 GeV) ThetaCS_06M09 Entries 24 Mean 0.3946 RMS 0.2294 0 0.2 0.4 0.6 0.8 0.5 1 1.5 2 ThetaCS_06M09 Entries 24 Mean 0.3946 RMS 0.2294 ThetaCS_06M09 Entries 24 Mean 0.3946 RMS 0.2294 | θ |cos | (a.u.) θ dN/d|cos 0.12 ± = -0.13 λ NA60 In-In >0.6 GeV T p excess (0.6<M<0.9 GeV) ThetaCS_Omega Entries 24 Mean 0.3952 RMS 0.2295 0 0.1 0.2 0.3 0.4 0.5 0.6 0.7 0.8 0.5 1 1.5 2 ThetaCS_Omega Entries 24 Mean 0.3952 RMS 0.2295 ThetaCS_Omega Entries 24 Mean 0.3952 RMS 0.2295 | θ |cos | (a.u.) θ dN/d|cos 0.09 ± = -0.12 λ NA60 In-In >0.6 GeV T p ω mesons ThetaCS_Phi Entries 24 Mean 0.3923 RMS 0.2279 0 0.1 0.2 0.3 0.4 0.5 0.6 0.7 0.8 0.5 1 1.5 2 ThetaCS_Phi Entries 24 Mean 0.3923 RMS 0.2279 ThetaCS_Phi Entries 24 Mean 0.3923 RMS 0.2279 | θ |cos | (a.u.) θ dN/d|cos 0.08 ± = -0.13 λ NA60 In-In >0.6 GeV T p φ mesons
FIG. 3: Polar angle distributions of excess dileptons and of the vector mesons ω and φ.
Fig. 2 for 0.6<M<0.9 GeV and pT>0.6 GeV. The
rapid-ity coverage is 3.2<y<4.2 (+0.3<ycm<+1.3).
The results on the angular distributions have been analysed in three different ways, distinguished by the method and the associated statistical/systematic errors. In the first and most rigorous method (1), the 3 struc-ture function parameters λ, µ and ν are extracted from a simultaneous fit of the 2-dimensional data on the basis of Eq.(1), using a 6×6 matrix in the range −0.6<cosθ<+0.6 (bin width 0.2) and −0.75<cosφ<0.75 (bin width 0.25). The restrictions in range are enforced by regions of very low acceptance in the 2-dimensional acceptance matrix, masked in the projections of Fig. 2. The fit values are summarized in Table I for all 4 cases, the two excess mass windows, the ω and the φ. Within errors, they are all compatible with zero. It is reassur-ing to see that this is also true for µ, as expected for a symmetric collision system at midrapidity on the basis of symmetry considerations [11].
In the second method (2), setting now µ=0, the 2-dimensional acceptance-corrected data are projected onto either the |cosθ| or the |φ| axis, summing over the two signs. The polar angular distribution is obtained by integrating Eq.(1) over the azimuth angle (φ)
dN
dcosθ = A0(1 + λcos
2θ), (2)
while the azimuth angular distribution is obtained by integration over the polar angle (cosθ)
dN dφ = A1(1 + λ 3 + ν 3cos2φ) (3)
The structure function parameters λ and ν can then be determined independently by 1-dimensional fits to the re-spective projections. The data of the polar angular dis-tributions together with the fit lines according to Eq.(2) are shown in Fig. 3 for all four cases, using now 8 bins in |cosθ| (bin width 0.1). The distributions are seen to be uniform, and the fit parameters λ, included in Table I, are again compatible with zero, within errors. To deter-mine the parameter ν, λ (contained in Eq.(3)) is set to
the measured value of λ ± σλ. The fit results for ν on the
basis of Eq.(3), keeping the small number of bins used in method 1, are again zero, within errors (see Table I).
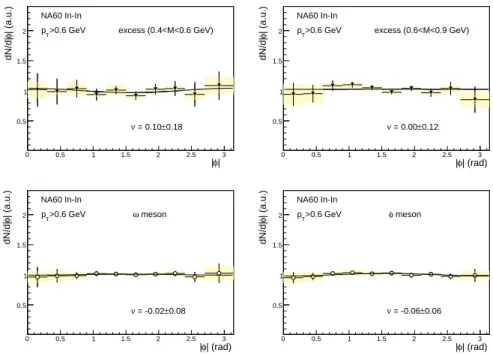
In the third method (3), the inclusive measured dis-tributions in cosθ and φ are analysed. A 1-dimensional acceptance correction is applied in each case, determined by using (as now measured) uniform distributions in φ (for cosθ) and in cosθ (for φ) as an input to the MC sim-ulations. The number of bins in |cosθ| is kept, while that in |φ| is increased to 10 (bin width 0.3). The data for the azimuth angular distributions together with the fit lines according to Eq.(3) are shown in Fig. 4. The dis-tributions are again uniform, as are those for cosθ (not shown, since hardly distinguishable from Fig. 3). The re-sulting fit parameters for λ and ν (taking account again
of λ ± σλ) are included in Table I. As expected, the
er-rors are smaller than for the other two methods, but the values of λ and ν are still close to zero, within errors.
Figs. 3 and 4 also contain the systematic errors at-tached to the individual data points. They mainly arise from two sources. The subtraction of the combinatorial background, with relative uncertainties of 1% [1, 2, 3],
AbsPhiCS_allnch_04mass06_ptgr06 Entries 10 Mean 1.515 RMS 0.882 0 0.5 1 1.5 2 2.5 3 0.5 1 1.5 2 AbsPhiCS_allnch_04mass06_ptgr06 Entries 10 Mean 1.515 RMS 0.882 AbsPhiCS_allnch_04mass06_ptgr06 Entries 10 Mean 1.515 RMS 0.882 | φ | | (a.u.) φ dN/d| excess (0.4<M<0.6 GeV) >0.6 GeV T p NA60 In-In 0.18 ± = 0.10 ν AbsPhiCS_allnch_06mass09_ptgr1 Entries 10 Mean 1.49 RMS 0.8522 0 0.5 1 1.5 2 2.5 3 0.5 1 1.5 2 AbsPhiCS_allnch_06mass09_ptgr1 Entries 10 Mean 1.49 RMS 0.8522 AbsPhiCS_allnch_06mass09_ptgr1 Entries 10 Mean 1.49 RMS 0.8522 | (rad) φ | | (a.u.) φ dN/d| excess (0.6<M<0.9 GeV) >0.6 GeV T p NA60 In-In 0.12 ± = 0.00 ν AbsPhiCS_allnch_omega_ptgr06 Entries 10 Mean 1.516 RMS 0.8698 0 0.5 1 1.5 2 2.5 3 0.5 1 1.5 2 AbsPhiCS_allnch_omega_ptgr06 Entries 10 Mean 1.516 RMS 0.8698 AbsPhiCS_allnch_omega_ptgr06 Entries 10 Mean 1.516 RMS 0.8698 | (rad) φ | | (a.u.) φ dN/d| meson ω >0.6 GeV T p NA60 In-In 0.08 ± = -0.02 ν AbsPhiCS_allnch_phi_ptgr06 Entries 10 Mean 1.51 RMS 0.8649 0 0.5 1 1.5 2 2.5 3 0.5 1 1.5 2 AbsPhiCS_allnch_phi_ptgr06 Entries 10 Mean 1.51 RMS 0.8649 AbsPhiCS_allnch_phi_ptgr06 Entries 10 Mean 1.51 RMS 0.8649 | (rad) φ | | (a.u.) φ dN/d| meson φ >0.6 GeV T p NA60 In-In 0.06 ± = -0.06 ν
FIG. 4: Azimuth angle distributions of excess dileptons and of the vector mesons ω and φ.
leads to errors of 2-3% of the net data for the kinematic selection used here. The subtraction of the meson de-cay sources causes (correlated) errors for the excess and the vector mesons ω and φ. With respect to the excess, they range from 4-6% up to 10-15% in the low-populated
TABLE I: Summary of results for pT>0.6 GeV on the
struc-ture function parameters λ, µ and ν in the CS frame,
ex-tracted from three different methods (see text). The χ2/ndf
of the fits varies between 0.8 and 1.2. For a cut pT>1.0 GeV,
the results are the same, within errors.
excess λ ν µ 0.6<M<0.9 GeV method1 -0.19±0.12 0.03±0.15 0.05±0.03 method2 -0.13±0.12 0.05±0.15 method3 -0.15±0.09 0.00±0.12 excess λ ν µ 0.4<M<0.6 GeV method1 -0.13±0.27 0.12±0.30 -0.04±0.10 method2 -0.10±0.24 0.11±0.30 method3 -0.09±0.16 0.10±0.18 ω meson λ ν µ method1 -0.10±0.10 -0.05±0.11 -0.05±0.02 method2 -0.12±0.09 -0.06±0.10 method3 -0.12±0.06 -0.02±0.08 φ meson λ ν µ method1 -0.07±0.09 -0.10±0.08 0.04±0.02 method2 -0.13±0.08 -0.09±0.08 method3 -0.05±0.06 -0.06±0.06
cosθ-φ matrix bins. This variation is well visible for the overall errors plotted in Figs. 3 and 4. Assuming, very conservatively, these errors to be uncorrelated from point to point, the (statistical) fit errors for λ and ν quoted in Table I would increase by 15-20% if the systematic errors would be added in quadrature. Further confidence into the stability of the results is obtained from their inde-pendence of the methods and the bin widths used.
The global outcome from our analysis of dilepton an-gular distributions is straightforward: the structure func-tion parameters λ, µ and ν are all zero within the statisti-cal and systematic errors, and the projected distributions in polar and azimuth angle are all uniform. This applies not only for the excess dileptons as anticipated if of ther-mal origin, but also for the vector mesons ω and φ. While there may be a rather direct connection between the two findings in nuclear collisions, it is of interest to note that the result of λ=0 has been reported before for ρ and ω
production in p-p [16] and π−-C [17].
We conclude, following the primary motivation of this study, that the absence of any polarization is fully
con-sistent with the interpretation of the observed excess
dimuons as thermal radiation from a randomized system. While this is a necessary condition, it is not sufficient. However, together with other features like the Planck-like shape of the excess mass spectra [3, 18], the exponential
shape of the mT spectra [2, 18] and the global agreement
with theoretical models both as to spectral shapes and absolute yields [3, 18], the thermal interpretation has be-come more plausible than ever before.
We are grateful to O. Nachtmann for useful discussions.
[1] R. Arnaldi et al. (NA60 Collaboration), Phys. Rev. Lett.
96, 162302 (2006).
[2] R. Arnaldi et al. (NA60 Collaboration), Phys. Rev. Lett.
100, 022302 (2008).
[3] R. Arnaldi et al. (NA60 Collaboration), Eur. Phys. J. (2009) in press; arXiv:0810.3204 .
[4] S. D. Drell and T. M. Yan, Phys. Rev. Lett. 25, 316 (1970).
[5] J. C. Collins and D. E. Soper, Phys. Rev. D 16, 2219 (1977).
[6] C. S. Lam and W. K. Tung, Phys. Rev. D 18, 2447 (1978).
[7] J. Badier et al. (NA3 Collaboration), Z. Phys. C 11, 195 (1981).
[8] S. Falciano et al. (NA10 Collaboration), Z. Phys. C 31, 513 (1986) and M. Guanziroli et al. (NA10 Collabora-tion), Z. Phys. C 37, 545 (1988).
[9] K. Gottfried and J. D. Jackson, Nuovo Cim. 33, 309 (1964).
[10] A. Brandenburg, O. Nachtmann and E. Mirkes, Z. Phys. C 60, 697 (1993); D. Boer, A. Brandenburg, O. Nacht-mann and A. UterNacht-mann, Eur. Phys. J. C 40, 55 (2005). [11] O. Nachtmann, private communication (2008).
[12] E. L. Bratkovskaya, O. V. Teryaev, V. D. Toneev, Phys. Lett. B 348, 283 (1995).
[13] P. Hoyer, Phys. Lett. B 187, 162 (1987).
[14] K. Banicz et al., Nucl. Instrum. Meth. A 546, 51 (2005). [15] S. Damjanovic et al., Nucl. Phys. A 783, 327 (2007). [16] V. Blobel et al., Phys. Lett. B 48, 73 (1974).
[17] J. G. Branson et al., Phys. Rev. Lett. 38, 1331 (1977). [18] R. Arnaldi et al. (NA60 Collaboration), Eur. Phys. J.