Supplementary Information for
Copy number variation of TdDof controls solid-stemmed architecture in wheat
Kirby T. Nilsen1,2†, Sean Walkowiak1,3†, Daoquan Xiang4, Peng Gao4, Teagen D. Quilichini4, Ian R. Willick1, Brook Byrns1, Amidou N’Diaye1, Jennifer Ens1, Krystalee Wiebe1, Yuefeng Ruan5, Richard D. Cuthbert5, Melanie Craze6, Emma J. Wallington6, James Simmonds7, Cristobal Uauy7, Raju Datla4, and Curtis J. Pozniak1
Corresponding Author: To whom correspondence should be addressed: Curtis J. Pozniak, [email protected]
This PDF file includes:
Supplementary information text Figures S1 to S7
Tables S1 to S4
Supplementary Dataset 1 to 2 References for SI
Materials and Methods
Exome capture and bulked segregant analysis. Bulked segregant analysis (BSA) was performed on doubled haploid (DH) lines from a mapping population derived from the cross Kofa/W9262-260D3 (1). Stem solidness in this cross is derived from W9262-260D3. DNA was extracted and pooled from 20 solid-stemmed lines (SSt1+ bulk) and 20 hollow-solid-stemmed lines (SSt1- bulk). The DNA was enriched to obtain gene-coding regions using the wheat exome capture array according to the procedures outlined in (2). High-throughput sequencing was performed on the Illumina HiSeq2500 platform with 2 x 100 bp paired-end chemistry. Raw sequence reads were processed with Trimmomatic v0.32 (3), and processed reads were aligned to the genome assembly of the durum wheat cv. Svevo using Novoalign v3.02.05 (Novocraft Technologies Sdn Bhd). Duplicate read mappings and improper read pairs were removed using Picard-Tools. SNP variants were called using the SAMtools v1.2.1 (4) mpileup command. Filters were applied requiring each bulk to be homozygous and to carry a different allele from the other. SNPs spanning the SSt1 interval were converted to KASP-based markers for the fine mapping experiments using Primer3 (5) software.
Fine mapping. We developed an F2 fine-mapping population segregating for stem solidness from the same parents used in the DH population (Kofa/W9262-260D3). Approximately 4,000 individual F2 plants were screened with flanking markers ek08_5169 and gwm247, as defined in a previous study (1). Lines showing recombination events between these markers were selected and screened with a series of KASP markers developed from exome capture BSA using the approach described above. Plants were grown to maturity and rated for stem solidness using a 1 to 5 visual scale (1). Stem solidness is a dominant trait, making it impossible to phenotypically distinguish between a heterozygous and homozygous carrier. Therefore, in some cases, it was necessary to screen F2-derived F3 lines to confirm the allelic state at SSt1 in the F2. The genetic map was visualized using MapChart software (6). The map was compared to the anchored marker positions in the Svevo (7) and Chinese Spring (8) genome assemblies.
Generating the CDC Fortitude mutant population. An ethyl methanesulfonate (EMS) mutant population was created from the solid-stemmed durum wheat cultivar CDC Fortitude (9) to disrupt the expression of SSt1 and induce stem hollowness. Approximately 1.5 kg of seeds was soaked in tubs containing 0.5% (v/v) EMS solution for eight hours under gentle agitation, followed by four hours of continuous rinsing in fresh tap water. The seeds were dried overnight in a fume hood and sown in space-planted field plots near Saskatoon (SK), Canada, the following day. A single spike was harvested from each M1 plant, and the seeds were planted as 2,376 individual M2 head-rows the following field season. Ten M3 spikes were harvested from each row and saved for future use. Plants from each row were cut into cross-sections and rated for stem solidness, and any rows segregating for stem hollowness were noted. This led to the selection of the hollow-stemmed pithless1 mutant.
Generating TdDof overexpression lines in the Kronos and pithless1 backgrounds. Transgenic wheat lines overexpressing the TdDof gene were generated using the hollow-stemmed durum wheat cultivar Kronos and the pithless1 mutant according the the procedures described in (10). The TdDof coding sequence was extracted from the Svevo annotation (7), synthesized, and cloned into the pUC57-Kan vector (Genewiz). The gene was then cloned into binary vector pSc4ActR1R2 under the control of the rice ACTIN promoter (11). The final binary plasmid, pEW398-TdDof, was transformed into Agrobacterium tumefaciensstrain AGL-1 and co-cultivated with immature wheat embryos at 23°C in the dark, according to published protocols (11) for three days. In vitro culture of the plant material was performed as described previously (12), with the exception that regeneration was carried out on medium containing 5mg/l zeatin. DNA isolated from regenerated plantlets was analyzed by qPCR to determine the copy number of the neomycin phosphotransferase II selectable marker gene relative to an internal control (Table S1). T0 transgenic plants carrying the T-DNA bearing TdDofwere grown under controlled environmental conditions at at 22oC day/17oC night, with a 16-hour light/8-hour dark photoperiod at 450 μmol m−2s−1 an intensity of. Seeds were harvested at maturity, and the main stems were rated for solid-stemmed expression using a standard 1-5 scale (13). All lines were advanced to the T1 generation for further copy number validation, gene expression profiling, and microscopy analyses.
Chromium genome sequencing. To examine structural variation around the SSt1 interval, whole-genome sequencing was performed on solid-stemmed lines CDC Fortitude and W9262-260D3 and
hollow-stemmed lines Svevo, Kofa, and pithless1 using the Chromium (10x Genomics) platform. Nuclei were isolated from ~30 seedlings per line as outlined in (14). High molecular-weight (HMW) genomic DNA was extracted from nuclei using a modified CTAB extraction protocol. Genomic DNA was quantified by fluorometry using Qubit 2.0 (Thermo Fisher), and size selection was performed to remove <40-kb fragments using pulsed field electrophoresis on a Blue Pippin instrument (Sage Science) according to the manufacturer’s specifications. Final DNA integrity and size were determined using a TapeStation 2200 (Agilent) and Qubit 2.0 (Thermo Fisher) instrument, respectively.
Library preparation was performed as per the 10x Genome Library protocol (10x Genomics). For each sample, four uniquely barcoded libraries were prepared and multiplexed on the Illumina HiSeqX and HiSeq 2500 platforms. De-multiplexing was performed using the 10x Genomics software Supernova, and alignments to the Svevo reference genome (7) were performed using LongRanger software (10x Genomics). Structural variants were visualized using Loupe software (10x Genomics).
Whole genome and targeted Oxford Nanopore sequencing via CRISPR-Cas9 mediated enrichment of the TdDof region. HMW DNA was isolated from ~80 wheat seedlings of the solid-stemmed cultivar CDC Fortitude using a hybrid protocol that combines a modified version of the nuclei isolation method of (14), followed by the salting out method (10X Genomics) with minor modifications. Briefly, approximately 9 g of fresh leaf tissue was harvested from 2-week-old etiolated seedlings. The tissue was transferred to a chilled blender jar filled with 150 ml of ice-cold NIB buffer and pulse blended for 30s on low speed. The homogenate was filtered through two layers of cheesecloth and two layers of Miracloth into a cold beaker with H+20 buffer (14). The contents were mixed gently and incubated on ice for 45 minutes with occasional gentle mixing. The homogenate was pelleted at 3500g at 4°C for 30 minutes. The supernatant was carefully discarded, and the pellet was washed and re-pelleted three times in ice-cold homogenization buffer (14) (HB) at 4000 rpm at 4°C for 15 minutes. Following the final wash, the pellet was re-suspended in HB, divided into four Falcon tubes, and re-pelleted. The supernatant was discarded, and the pelleted nuclei were subjected to overnight lysis. Purified HMW DNA was precipitated by the addition of sodium chloride and absolute ethanol and retrieved by spooling with a glass rod. The DNA was washed in 70% (v/v) ethanol, air-dried, and re-suspended in elution buffer. HMW DNA was incubated at 4°C for re-hydration and quantified, size selected, and evaluated using Qubit 2.0, Blue Pippin, and TapeStation 2200 instruments as described above.
We performed two complementary library preparation protocols: CRISPR-Cas9 mediated enrichment of the TdDof region and standard whole-genome library preparation. For targeted sequencing of TdDof, we used the CRISPR-Cas9 mediated PCR-free enrichment protocol (Oxford Nanopore Technologies version: ENR_9084_v109_revD_04Dec2018) as a guideline for probe design. The boundary sequences flanking the TdDof region of interest (ROI) were extracted from the Svevo reference genome (7) and used for crRNA design. Candidate crRNA probes were identified within the boundary sequence using CRISPR RGEN Tools (15); these probes consisted of a 20-mer target sequence. The Svevo and RefSeq v1.0 wheat sequence (8) were used as reference sequences to evaluate the candidate probes for off-target sites and other efficiencies (i.e. self-complementarity). Two upstream and two downstream crRNAs were selected for use in targeted sequencing of the ROI. Library preparation followed the Cas-mediated PCR-free enrichment protocol (Oxford Nanopore Technologies version: ENR_9084_v109_revD_04Dec2018) using Streptococcus pyogenes Cas9 (Integrated DNA Technologies) for blunt end double-stranded cutting of the target DNA. To summarize, a fresh Cas9 ribonucleoprotein complex (RNP) was formed using a set of 1 or 2 crRNAs flanking the ROI. A pool of size-selected DNAs was dephosphorylated to protect non-target DNA from adapter ligation. The Cas9 RNP was combined with the dephosphorylated DNA sample, and sequencing adapters were ligated to cleaved and prepared DNA ends using an Oxford Nanopore 1D Ligation Sequencing kit (LSK109), followed by bead purification of long fragments. Approximately 392– 1512 ng of the Cas9-enriched library was used as input across a total of 10 flow cells (Oxford Nanopore version R9.4.1 revD). Libraries for whole-genome Oxford Nanopore sequencing were also prepared using an Oxford Nanopore 1D Ligation Sequencing kit (LSK109) with HMW DNA that was purified and size selected as described above. Sequencing was performed on a GridION instrument using standard parameters and flow cells (R9.4.1 revD).
De-novo Assembly of the TdDof region in CDC Fortitude using Oxford Nanopore and 10x Genomics Chromium read data. Oxford Nanopore read data were pre-processed with Porechop (https://github.com/rmcolq/Porechop) to remove adapters and NanoFilt (16) to remove reads with low
average base quality and reads <500 bp long. After pre-processing, the read length N50 was 5.6 kb. Reads from the targeted CRISPR-Cas9 were assembled using the miniasm assembler (17) to produce a preliminary assembly of the SSt1 target region with an N50 of 23.7 Kb including a 103,345 bp contig containing three copies of the TdDof gene. To extend the assembly past the initial ROI, we supplemented the data with whole-genome Oxford Nanopore read data that aligned to the SSt1 region in the Svevo pseudomolecule assembly (7). Alignment-based filtering was performed via two steps. First, minimap2 (18) was used to identify Oxford Nanopore reads that mapped to the SSt1 region in Svevo. Second, LongRanger alignment software (10x Genomics) was used to align Chromium linked short reads to the Svevo assembly. Reads that mapped to the SSt1 region were extracted, as were reads that did not map to SSt1 but likely originated from the same molecules (shared GemCode tag). These reads were mapped to the pre-processed Oxford Nanopore whole-genome sequencing read data to identify additional long-read data that did not align well to the SSt1 region in Svevo, effectively filling gaps that resulted from sequence dissimilarity between CDC Fortitude and Svevo. The extended long-read data were assembled using Canu (19) and merged with the draft miniasm assembly using ABACUS software to create the final assembly of the TdDof region.
RNA sequencing. A panel of durum wheat cultivars with varying levels of stem solidness was selected for transcriptomic analysis. We selected CDC Fortitude and W9262-260D3, which are solid-stemmed cultivars derived from the German cultivar Biodur. The hollow-stemmed cultivars included Kofa and Langdon (LDN) and the loss-of-function mutant line pithless1, which was selected from the CDC Fortitude mutant population. We also included the solid-stemmed line LDN-GB-3B; this solid-stemmed chromosome substitution line of Langdon carries chromosome 3B from Golden Ball, a hypothesized second source of stem solidness that exists in durum wheat. This experiment was performed in 3 replications per genotype. Three seeds per line were planted in 4 L pots and grown in a growth cabinet under T5 fluorescent lighting. Growth conditions were set to temperature cycles of 22°C during the day and 18°C at night, with a 16-hour photoperiod and light intensity of 600 μmol m−2 s−1. Each pot was considered to be one treatment, and each treatment was grown in three replications. The experiment was arranged in a completely randomized design, and pots were randomly moved to a new position in the growth cabinet every seven days.
The main stems of three plants per treatment were sampled at Zadoks stage 32, when the first two nodes are present on the stem. Approximately 0.5 cm of the stem was sampled, measuring from the bottom of the lowermost node towards the uppermost node. The samples were immediately placed in 1.5 mL micro-centrifuge tubes, flash-frozen in liquid nitrogen, and stored at −80°C prior to RNA extraction. Stem tissue was ground in liquid nitrogen with a sterilized mortar and pestle. Total RNA extraction was performed using a Qiagen RNeasy Plant Mini Kit (Qiagen) as per the manufacturer’s protocol. RNA integrity was evaluated using an Agilent Bioanalyzer RNA 6000, and RNA quantification was performed using a Qubit 2.0 Broad Range assay kit (Thermo Fisher).
Individually barcoded cDNA libraries were prepared using a TruSeq RNA v2 unstranded kit (Illumina) as per the manufacturer’s protocol. Library integrity was assessed on an Agilent Bioanalyzer using a high sensitivity DNA analysis kit. Library quantitation was performed using a Qubit 2.0 High Sensitivity assay kit. Individually barcoded libraries were diluted to 10 ng µl-1, pooled into groups of six, and sequenced across five lanes on the Illumina HiSeq4000 platform with 2 x 150 bp PE chemistry.
RNAseq bioinformatics analysis pipeline. We used standard bioinformatics procedures to process that RNAseq data. Adaptor and quality trimming was performed using Trimmomatic version 0.27 (3) with the parameters ILLUMINACLIP:TruSeq3-PE:2:30:10 LEADING:3 TRAILING:3 SLIDINGWINDOW:4:20 MINLEN:75. Trimmed reads were assessed for adaptor contamination and quality using FastQC and aligned to the Svevo reference sequence (7) using STAR version 2.5 (20) with default parameters, except that the maximum mismatch rate (--outFilterMismatchNmax) was set to 6 (minimum 96% sequence identity) and the maximum intron length (--alignIntronMax) was set to 10,000 bp. Alignment files containing aligned reads were input into StringTie (21) to count reads mapping to genes in the Svevo annotations. A matrix of raw read counts was normalized by DESeq2 (21) to identify differentially expressed genes between hollow and stemmed lines. Pairwise comparisons were made between the three hollow and five solid-stemmed lines (Table 5.1). The significance threshold for declaring a gene to be differentially expressed was defined as an adjusted p < 0.01.
Weighted gene co-expression network analysis. Unsigned RNAseq co-expression network analysis was performed using the WGCNA (22) R package (default parameters). The network was constructed from count estimates for 36,403 genes (filtered to remove genes expressed at low levels, i.e., mean raw count > 15) across all 21 samples, combined with stem solidness data across all samples that were rated at maturity (1 to 5 scale). In total, 37 expression modules were detected. From this global network, a co-expression sub-network was extracted in two steps. First, filters were applied to pairwise (hollow- vs solid stemmed) gene expression data to extract a final list of 12 genes that met the criteria of being differentially expressed (adjusted p < 0.05) across all pairwise comparisons (Table 1). Next additional genes were extracted from the global network if their expression showed high correlation(-0.94 < r > 0.94) with at least one of these 12 genes. The resulting subnetwork consisted of 32 genes representing 7 out of 37 total co-expression modules.
Stem fixation for light and electron microscopy. Fresh hand-cut stem sections of CDC Fortitude, pithless1, Kofa, and T1 transgenic lines of pithless1 were taken approximately 2 cm above the node and submerged in 25 mM piperazine-N-N' bis (2-ethanolsulfonic acid) (PIPES), pH 7.0 containing 2% (v/v) glutaraldehyde in glass scintillation vials. Following overnight incubation at 4°C, the samples were washed with 25 mM PIPES and fixed in 2% OsO4 in 25 mM PIPES at room temperature for 1.5 hours. The fixed samples were washed in 25 mM PIPES and dehydrated in an ascending graded ethanol series (30%, 50%, 70%, 95%, and three 100% exchanges). The subsequent sample preparation steps for scanning electron microscopy (SEM) differed from those used for light microscopy and transmission electron microscopy (TEM), as detailed below.
For SEM, after sample dehydration, the ethanol was substituted with amyl acetate using increasing ratios of amyl acetate to ethanol (spanning 1:3 parts, 1:1, 3:1, then two pure amyl acetate exchanges). All solvent exchanges were separated by 15 minutes. The samples were critical-point dried with solvent-substituted liquid CO2 (Polaron E3000 Series II), mounted on aluminum specimen stubs with conductive carbon glue (Ted Pella, Inc.), and rotary coated with 10 nm of gold (Edwards S150B sputter coater). Imaging was performed with a 3 kV accelerating voltage, 10 uA current, and working distance of 3.8 mm on a Field Emission SEM (Hitachi SU8010).
For sample preparation for light microscopy and TEM, samples in 100% ethanol were transferred to ice cold propylene oxide (dropwise until the propylene oxide: ethanol ratio was approximately 2:1). After 30 minutes, two changes with cold propylene oxide were performed, separated by 30 minutes. To embed the samples, sample changes were done with a series of propylene oxide: Spurr’s resin (23) mixtures, moving from 2:1, 1:1, 1:2 every 30 minutes, then adding 100% Spurr’s overnight. After a final exchange in fresh Spurr’s resin, the samples were positioned in polyethylene embedding capsules (Electron Microscopy Sciences) and heated for 24–48 hours at 60°C. Sectioning was performed on a Reichert Ultracut E microtome. For light microscopy, semi-thin sections were stained with Toluidine Blue (1% in 1% Borate) and imaged under a Leica DMR microscope with an Optronics MacroFire Color camera. For TEM imaging, fine details of ultrastructure were examined with the acceleration voltage of 120 kV on a high contrast/resolution digital transmission electron microscope (Hitachi HT7700).
In situ PCR of TdDof. TdDof transcript localization in paraformaldehyde‐fixed paraffin‐embedded internode cross-sections was performed by in situ PCR. Sample and reagent preparation were carried out based on the combination of protocols described by (24, 25) with some modifications and additional details outlined below. Zadoks stage 32 and stage 34 internode samples from pithless1, Kofa, and CDC Fortitude were fixed in fresh 4% paraformaldehyde in phosphate buffered saline (PBS). After washing and dehydration, the samples were embedded in paraffin and sectioned to 10 μM using a histology microtome. Subsequent treatments including dewaxing, rehydration, Proteinase K treatment, in situ reverse transcription, in situ PCR, and staining were performed on slides in Frame-Seal incubation chambers. Reverse transcription oligonucleotides (DG036, 5-ATTGCCGAAGCTGATTGAG-3) and PCR primers (DG015, 5-CAACCAGCTTCAGCTGCAG-3; DG038, 5-TGACCATGATTGTTGTTGTTTCC-3) were designed to specifically target TdDof to exclude off-target effects from TdDof homologous and homeologous genes. Intron-spanning features were also included in the primer design to eliminate potential genomic DNA contamination. In situ reverse‐transcription of TdDof mRNA was carried out on DNase-treated internode sections using the SuperScript IV VILO system (ThermoFisher). This step was omitted in the
corresponding negative control slides. PCR was carried out using Phusion High-Fidelity DNA Polymerase (Invitrogen) containing 4 μM (final concentration) of Digoxigenin‐11‐dUTP (DIG) (Sigma) as an additional reagent. Colorimetric detection of DIG-labeled PCR products was performed with anti-DIG-AP (Sigma), and the sections were stained with BM-purple (Sigma). Visualization was processed using a Leica DMR equipped with a MicroFire camera (Optronics) under bright field Illumination.
Viability staining. Fresh hand-cut stem cross-sections of CDC Fortitude and pithless1 taken approximately 2 cm above the second node were submerged in PBS prior to staining. Stock solutions of the stains propidium iodide (PI) and fluorescein diacetate (FDA) were prepared at 20 µg mL-1 for PI and 2 µg mL-1 for FDA. Each stem section was stained with PI for 10 minutes, followed by PI and FDA for 10 minutes. After staining, the stem sections were placed on a glass slide in PBS beneath a 1.5 mm coverslip and imaged immediately under a confocal microscope (Zeiss LSM510 with motorized Axiovert 200 microscope) equipped with a 25X water immersion objective lens (Plan-Neofluar 25x/0.8 1mm corr Ph2) and ConfoCor2 v3.2 software. For PI visualization (Channel 3), excitation at 543 nm and BP 585–615 nm filter was used. For FDA visualization (Channel 2), 488 nm excitation and a BP 505–530 nm filter was used. Single XY plane scans are presented. The multi-track imaging software feature enabled both excitation wavelengths to be used in succession with a detector gain of 583 and pinhole of 252 for Channel 2 and a gain of 1250 and pinhole of 233 for Channel 3.
Terminal deoxynucleotidyl transferase (TUNEL) assay. Zadoks 34 stage internode samples from pithless1 and CDC Fortitude were collected and fixed in fresh 4% paraformaldehyde in phosphate buffered saline (PBS), pH 7.5. Following overnight incubation at 4°C, the samples were washed with PBS and dehydrated in an automated ascending grade ethanol series (3 x 70%, 80%, 95% for one hour each, followed by three 100% exchanges for two hours each), followed by xylene exchanges (two exchanges incubated for two hours each) and paraffin wax exchanges at 62°C for 2 hours each. Samples were cross-sectioned to 10-20 μm using a rotary microtome (Leitz 1212). Subsequent treatments including dewaxing, rehydration, and proteinase K treatment were conducted on slides. TUNEL assays were performed using the TACS® 2 TdT Fluorescein Kit (Trevigen, catalog number 4812-30-K) following the provided protocol, with a 30-minute Proteinase K treatment and cadmium cation in the labeling reaction mix. An unlabeled experimental control, in which TdT enzyme was omitted, and a positive control, in which TACS nuclease treatment was used, were performed alongside each assay. Selected sections were mounted with Antifade Mounting Medium with DAPI (VECTASHIELD, H-1200-10) for DAPI staining and sealed with permount and a coverslip. Imaging was performed by confocal laser scanning microscopy with 405 nm excitation and BP 420-450nm for DAPI and 488 nm excitation and BP 505-530nm for fluorescein visualization (Zeiss LSM 880). Single XY planes are presented in Figure 5. Z stack projections for experimental treatments captured 10 XY plane slices with a 2 μm step size, and unlabelled and positive controls covered 7 slices separated by 1 µm steps, as presented in Supplementary Figure S5.
Metabolite analysis. Tissue was sampled from stem tissue of Kofa, CDC Fortitude, and pithless1 plants at Zadoks stage 32, 33, and 34. Three biological replicates per sample were further processed and analyzed by Metabolon, Inc. (www.metabolon.com) for global unbiased metabolite profiling involving a combination of three platforms: HPLC–tandem mass spectrometry optimized for basic species, ultra-HPLC/tandem mass spectrometry optimized for acidic species, and gas chromatography–mass spectrometry. The methods used were described previously (26, 27). For normalization, the samples were scaled to the median value for each compound, and two-way ANOVA was performed among different replicates for analysis of variance. For statistical significance testing, p-values were calculated and sorted to interpret the q-values, which were further used to estimate the false discovery rate of the selected compound list.
Confirmation of copy number variation and gene expression data using ddPCR. Copy number and gene expression of TdDof were validated using the droplet digital PCR (ddPCR) system (Bio-Rad). Probe primers (D1 and D2) were designed specifically to exclude off-targets from their homologous and homoeologous genes. A pair of primers (B1) was designed to target the unique boundary sequence. A single copy marker close to TdDof on chromosome 3B was used as a reference for copy number variation
(CNV) analysis, and the housekeeping gene TaActin was used as a reference for gene expression analysis. All primers contained at least one SNP compared to homoeologs in the other chromosome. Primer sequences for each target and reference genes are provided in Supplementary Table S1.
High-quality DNA was extracted using the CTAB method and diluted to a final concentration of 1–5 ng µL -1 for the reaction. EcoRI and HindIII (NEB) digestions were performed prior to the ddPCR assay. The extracted RNA (using the methods described above) was treated with DNase I (Thermo Fisher Scientific), and reverse transcribed using the SuperScript IV VILO system (Thermo Fisher Scientific) according to the manufacturer's instructions. CNV and transcript abundance were measured using the Bio-Rad QX200 ddPCR System (Bio-Rad). In brief, each 20 μL 1 x ddPCR EvaGreen SuperMix containing DNA/cDNA templates, forward and reverse primers at optimized concentrations was mixed with 70 μL of Droplet Generation oil for EvaGreen (Bio-Rad) in a DG8 Cartridge (Bio-Rad). The cartridge was covered with a DG8 gasket and loaded into the QX200 Droplet Generator (Bio-Rad) to generate PCR droplets. 40 μL of each droplet mixture was transferred to a 96-well PCR plate (Bio-Rad) and sealed using a PX1™ PCR plate Sealer (Bio-Rad). PCR thermal cycling conditions were optimized, and the amplification signals were read using a QX200™ Droplet Reader and analyzed using QuantaSoft software (Bio-Rad).
Marker development for breeding. To develop a high-throughput KASP marker for breeding, we mined our database of Chromium sequence data to call SNPs and design additional markers. This approach has several benefits over exome-based strategies for marker development, as it includes the presence of read data in intergenic regions, higher per-base read coverage, and the ability to more accurately resolve repetitive and complex genomic regions with long range data, which spanned an average of 40 kb when aligned to the Svevo reference sequence (see ‘Chromium whole-genome sequencing’). Alignments were used for variant calling with FreeBayes, and only homozygous variants were retained. The retained SNPs were converted into KASP markers using Primer3 software. Finally, in silico validation of specificity was performed by mapping the primer sequences to the Svevo reference sequence by BLASTn, and only uniquely mapping primer pairs were retained and validated using a diversity panel consisting of hollow and solid-stemmed durum and bread wheat cultivars. This method was successfully used to select a new marker (usw275) (Fig. 1D, Table S1, Fig. S7) that maps within the fine-mapped interval (Svevo chromosome 3B position: 829,114,574) of SSt1 and scores hexaploids and tetraploids correctly.
Supplementary Figures
Figure S1. Diagram showing the organization of the TdDof CNV region in solid-stemmed cultivars. A) Alignment of the hybrid assembly containing three copies of TdDof in CDC Fortitude (Y-axis) to the Svevo reference genome (X-axis). The three TdDof copies are numbered from TdDof1-TdDof3 beginning with the most proximal copy (red stars) Three copies of the TdDof gene (TdDof1-3) are present in the genome of solid-stemmed wheat (CDC Fortitude) compared to the single copy in hollow-stemmed wheat (Kofa). (B) At the CNV breakpoint between each TdDof copy in the solid-stemmed cultivars, a unique 25 bp insertion occurs at the breakpoint between TdDof1-2 and TdDof2-3 (B1). The 5 upstream regions of TdDof (Kofa) and TdDof1 (CDC Fortitude) are identical (red segment). Similarly, the 3 downstream region of TdDof is identical to the downstream region of TdDof3 in CDC Fortitude. (C) ddPCR primers were designed to validate our model at the 5 upstream region (SCR), the boundary sequence insertion (B1), and the internal TdDof gene (D1, D2). These results confirm that CDC Fortitude carries three copies of the TdDof gene compared to a single copy in Kofa and no copies in the pithless1 mutant (primer sets D1, D2). Two copies of the boundary sequence were present in CDC Fortitude compared to no copies in either Kofa of pithless1 (primer set B1). One copy of the upstream region was present in all three lines (primer set SCR). (D) Agarose gel image of the boundary region insertion (B1) sequence marker TdDof_CNV screened in different sources of stem solidness. Amplification of PCR product indicates the presence of multiple TdDof copies, as observed for solid-stemmed wheat lines CDC Fortitude and W9262-260D3 (derived Biodur), Golden Ball, and S-615. The lack of PCR product amplification was observed for hollow-stemmed lines pithless1 and Kofa, consistent with the deletion of this region in pithless1, and the lack of TdDof CNV in Kofa.
Figure S2. Nucleotide and protein sequences of the TdDof gene (TRITD3Bv1G280530), encoding a putative Dof (DNA-binding with one finger) protein. The zf-dof DNA binding domain is indicated in red font.
Figure S3. Stem pith anatomy in CDC Fortitude and mutant pithless1 plants sampled at Zadoks stage 32. The stems exhibited a solid pith in CDC Fortitude and a hollow pith in pithless1 when viewed by scanning electron microscopy (A–D), light microscopy (E–H) and transmission electron microscopy (I–L) in cross-sectional planes (A, C, E–L) and longitudinal planes (B, D). In CDC Fortitude, parenchyma cells in and surrounding the central pith region appeared intact and approximately uniform in size (E, F) with even, continuous cell walls (I) and triangular three-way junctions between cells (J). In contrast, in pithless1, parenchyma cells surrounding the central pith region appeared irregular and angular (G) or broken and collapsed (H), with undulating cell walls (K) and three-way junction buckling (L). Bars = 250 µm (A, C), 50 µm (B, D), 20 µm (E–H), 1 µm (I–L).
Figure S4. Quantifying cell death signals in CDC Fortitude and pithless1 using TUNEL. Stem cross-sections for (A) CDC Fortitude and (B) pithless1 were visualized through a series of stitched confocal laser-scanning microscopy images. Intact cells within the central pith zone (outlined in white) were counted using colored dots to mark every 50 cells, with yellow dots marking the remaining cells. Fluorescent nuclei (indicating cell death signals) are marked by yellow stars.
Fig. S5. TUNEL assay controls. Co-localization of DAPI nuclear counterstain with nuclear label from a TUNEL assay for DNA fragmentation, in representative CDC Fortitude (A-C, G, I, J) and mutant pithless1 (D-F, H, K, L) stem cross-sections, visualized with confocal laser scanning microscopy; A, D, I, K: phase-contrast image; B, E, J, L:TUNEL assay fluorescein signal; C, F: DAPI signal: and G, H: TUNEL assay fluorescein-DAPI merge. DAPI-positive nuclei are marked by white arrowheads. Representative TUNEL assay positive control shown in I and J; and K and L represent unlabeled control stem cross-sections, using TACS nuclease treatment of pithless1 stem cross-section and TdT enzyme omission for CDC Fortitude stem cross-section, respectively. Images in A-H and I-L are Z-stack projections of the same thickness and step interval (as detailed in methods). Bars = 100 µm.
Fig. S6. Metabolite analysis of stem tissue collected from CDC Fortitude (F), pithless1 (P), and Kofa (K) at three different time points. Zadoks stage 32 (Z32), Zadoks stage 33 (Z33), and Zadoks stage 34 (Z34). Three biological replicates per sample were analyzed for global unbiased metabolite profiling involving a combination of three platforms: HPLC–tandem mass spectrometry optimized for basic species, ultra-HPLC/tandem mass spectrometry optimized for acidic species, and gas chromatography–mass spectrometry. The Y axis of each plot represents the scaled intensity across all samples (median value across all samples = 1) for each biomolecule. The horizontal line within the body of the boxplot denotes the median value, whereas the ‘+’ symbol denotes the mean. The upper and lower quartiles are denoted by the upper and lower bounds of each box. The whiskers represent the most extreme upper and lower value in each dataset.
Figure S7: Developing markers for high-throughput selection of stem solidness for use in breeding programs. A) Comparison of the previously reported KASP marker usw204 (13) and newly developed KASP marker usw275. The previously reported marker usw204, although diagnostic for stem solidness, scored durum and bread wheat inversely. The new marker usw275 scores both wheat species correctly and is therefore more suitable for high-throughput marker-assisted selection. B) Allelic phase shift between solid-stemmed durum (CDC Fortitude and W9262-260D3) and bread wheat (CDC Landmark) cultivars affects marker scoring within SSt1. Marker haplotypes around the SSt1 region are shown, where ‘1’ (red) indicates the solid allele and ‘0’ (blue) indicates the hollow allele relative to the scoring in durum wheat, and “.” indicates a lack of amplification. An allelic phase shift was identified within Svevo positions 828.5 and 829.6 Mb consistent with the SSt1 fine mapping interval including the marker usw275, where hexaploids and tetraploids were scored correctly.
Supplementary Tables
Table S1. Primers used in this study
Marker Name Sequence (5 to 3) Experiment
usw305HF AGACATACCATCGCTTCATCGG Fine mapping
usw305FF AGACATACCATCGCTTCATCGA Fine mapping
usw305R ATCCTTTTCTTCCTCACCTTCC Fine mapping
usw306HF TACGCATGCATGTGGTTGTTTAT Fine mapping
usw306FF TACGCATGCATGTGGTTGTTTAG Fine mapping
usw306R CTTTGCATCGATTACTGTTGGT Fine mapping
usw307HF TTTTGGTTTTCCGTGATTAACTAA Fine mapping usw307FF TTTTGGTTTTCCGTGATTAACTAG Fine mapping
usw307R GCAAATAAATTCAGACACCAAGC Fine mapping
usw308HF AGACTATGCTTGGCGATTCGTA Fine mapping
usw308FF AGACTATGCTTGGCGATTCGTG Fine mapping
usw308R AAGGTCAAACCTTGGATTTTCA Fine mapping
ek08_5169F AAGCATGGGATGAGAGGAGATA Fine mapping ek08_5169R GCCATAGAGAATGCTCCTGTTC Fine mapping
gwm247F GCAATCTTTTTTCTGACCACG Fine mapping
gwm247R ATGTGCATGTCGGACGC Fine mapping
usw275HF GAAAACAAAACCTGTCAAAAAT Marker-assisted selection usw275FF GAAAACAAAACCTGTCAAAAAC Marker-assisted selection usw275R GAATTTTCGGAGTTACAGATTGC Marker-assisted selection usw204FF AGACTATGCTTGGCGATTCGTA Marker-assisted selection usw204FF AGACTATGCTTGGCGATTCGTG Marker-assisted selection usw204R AAGGTCAAACCTTGGATTTTCA Marker-assisted selection TdDof_CNV_F AGATGTCTTAGAACGTCGTCTTAGA TdDof insertion sequence TdDof_CNV_R TCTAAGACGACGTTCTAAGACATCT TdDof insertion sequence GamyB1F GATCCGAATAGCTGGCTCAAGTAT Transgenic plant validation GamyB2R GGAGACTGCAGGTAGGGATCAAC Transgenic plant validation GamyB1P JOE-CGTGGCTCCTGCGATGCAGC-TAMRA Transgenic plant validation Npt2B2F CTCCTGCCGAGAAAGTATCCA Transgenic plant validation
Npt2B4R GCCGGATCAAGCGTATGC Transgenic plant validation
Npt2B2P FAM-TGGCTGATGCAATGCGGCG-TAMRA Transgenic plant validation
D1_F GTTCCTGCACGCCATGGAC TdDof CNV region validation
D1_R TCCCCCATCGTCGCCATTA TdDof CNV region validation
D2_F GATGTCCGGGAATCCTCAAT TdDof CNV region validation
D2_R TAGTCCCTCTTGGCCGGCT TdDof CNV region validation
B1_F AGCCTTAGATGTCTTAGAACGTCG TdDof CNV region validation B1_R CACATAGGTGAACTAGGACGTGTG TdDof CNV region validation Reference_F TCGCAACGGCTACCAGAAG TdDof CNV region validation Reference_R GGGCGGGCTCTGCTTTTA TdDof CNV region validation
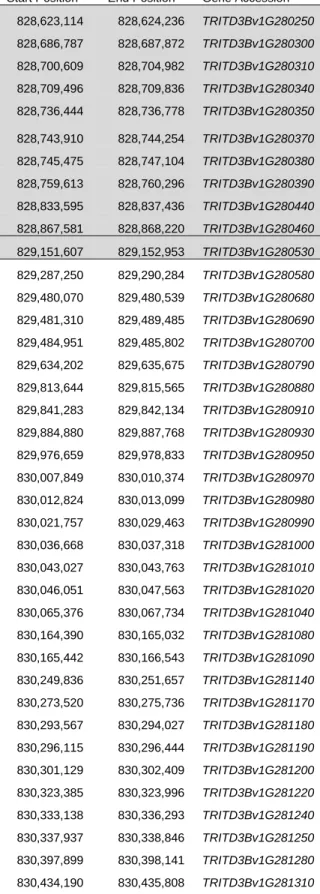
Table S2. High-confidence genes within the SSt1 fine mapping interval on chromosome 3B in the Svevo gene annotations. Fine Mapping Interval on Chromosome 3B in the Svevo Gene Annotations. Genes in the gray shaded box were deleted in pithless1, including TdDof (highlighted in bold text).
Start Position End Position Gene Accession Annotation
828,623,114 828,624,236 TRITD3Bv1G280250 Werner Syndrome-like exonuclease 828,686,787 828,687,872 TRITD3Bv1G280300 Disease resistance protein RPM1 828,700,609 828,704,982 TRITD3Bv1G280310 Vacuolar protein sorting protein 25 828,709,496 828,709,836 TRITD3Bv1G280340 Metallothionein
828,736,444 828,736,778 TRITD3Bv1G280350 Metallothionein 828,743,910 828,744,254 TRITD3Bv1G280370
Plant invertase/pectin methylesterase inhibitor superfamily protein G
828,745,475 828,747,104 TRITD3Bv1G280380 30S ribosomal protein S17 828,759,613 828,760,296 TRITD3Bv1G280390 30S ribosomal protein S19
828,833,595 828,837,436 TRITD3Bv1G280440 SANT domain-containing protein 2 G
828,867,581 828,868,220 TRITD3Bv1G280460 Very-long-chain (3R)-3-hydroxyacyl-CoA dehydratase 829,151,607 829,152,953 TRITD3Bv1G280530 Dof zinc finger protein (TdDof)
829,287,250 829,290,284 TRITD3Bv1G280580 Dof zinc finger protein 829,480,070 829,480,539 TRITD3Bv1G280680 transmembrane protein 829,481,310 829,489,485 TRITD3Bv1G280690 Cytochrome P450
829,484,951 829,485,802 TRITD3Bv1G280700 Ubiquitin-like modifier-activating enzyme 1 G 829,634,202 829,635,675 TRITD3Bv1G280790 Ankyrin repeat family protein
829,813,644 829,815,565 TRITD3Bv1G280880 Cytochrome P450
829,841,283 829,842,134 TRITD3Bv1G280910 Pre-mRNA-splicing factor ISY1-like protein 829,884,880 829,887,768 TRITD3Bv1G280930 Protein CHUP1, chloroplastic G
829,976,659 829,978,833 TRITD3Bv1G280950 Pectin acetylesterase 830,007,849 830,010,374 TRITD3Bv1G280970 Pectin acetylesterase 830,012,824 830,013,099 TRITD3Bv1G280980 Pectin acetylesterase 830,021,757 830,029,463 TRITD3Bv1G280990 Pectin acetylesterase 830,036,668 830,037,318 TRITD3Bv1G281000 Pectin acetylesterase 830,043,027 830,043,763 TRITD3Bv1G281010 Pectin acetylesterase 830,046,051 830,047,563 TRITD3Bv1G281020 91A protein G 830,065,376 830,067,734 TRITD3Bv1G281040 Pectin acetylesterase 830,164,390 830,165,032 TRITD3Bv1G281080 Histone H2A 830,165,442 830,166,543 TRITD3Bv1G281090 RNA-binding protein 830,249,836 830,251,657 TRITD3Bv1G281140 Receptor-like protein kinase 830,273,520 830,275,736 TRITD3Bv1G281170 DNA topoisomerase 3 830,293,567 830,294,027 TRITD3Bv1G281180 Histone H2A
830,296,115 830,296,444 TRITD3Bv1G281190 Outer-membrane lipoprotein LolB G 830,301,129 830,302,409 TRITD3Bv1G281200 alpha/beta-Hydrolases superfamily protein 830,323,385 830,323,996 TRITD3Bv1G281220 Inorganic pyrophosphatase protein 830,333,138 830,336,293 TRITD3Bv1G281240 Kelch repeat-containing F-box family protein 830,337,937 830,338,846 TRITD3Bv1G281250 Soluble inorganic pyrophosphatase 830,397,899 830,398,141 TRITD3Bv1G281280 Ubiquitin family protein
830,439,857 830,440,258 TRITD3Bv1G281330 Caffeic acid O-methyltransferase 830,551,081 830,558,494 TRITD3Bv1G281340 Protein upstream of flc
Table S3. Analysis of stem solidness and nptII copy number in pithless1 and Kronos transformations with the TdDof overexpression construct. The hollow-stemmed mutant line pithless1 and durum wheat cultivar Kronos were transformed using the pEW398-sst1 construct, containing TdDof under the control of the rice ACTIN promoter and the nptII selectable marker gene. Non-transformed controls for each experiment were regenerated from calli without prior co-cultivation with Agrobacterium. Genomic copy number of the nptII are presented for each independent T0 line, along with the average whole stem solidness rating for each line (1 to 5 visual rating scale with 1 = very hollow-stemmed, and 5 = very solid-stemmed).
T0 Plants Transformed with pEW398-sst1 nptII Copy Number Stem Solidness
pithless1_pEW398-sst1_4_Control 0 1.38 pithless1_pEW398-sst1_6_Control 0 1.50 pithless1_pEW398-sst1__4.1 1 5.00 pithless1_pEW398-sst1__4.3 1 5.00 pithless1_pEW398-sst1__4.4 1 5.00 pithless1_pEW398-sst1__4.5 2 or 4 5.00 pithless1_pEW398-sst1__4.6 2 5.00 pithless1_pEW398-sst1__6.1 1 5.00 pithless1_pEW398-sst1__7.1 4+ 5.00 pithless1_pEW398-sst1__7.2 1 1.38 pithless1_pEW398-sst1__6.2 4+ 5.00 pithless1_pEW398-sst1__6.3 2 5.00 pithless1_pEW398-sst1__6.4 4+ 5.00 Kronos_pEW398-sst1_2_Control 0 2.75 Kronos_pEW398-sst1_2_Control 0 2.75 Kronos_pEW398-sst1_3_Control 0 2.50 Kronos_pEW398-sst1_2_Control 0 3.13 Kronos_pEW398-sst1_9_Control 0 3.38 Kronos_pEW398-sst1_2.1 1 5.00 Kronos_pEW398-sst1_2.2 3 4.00 Kronos_pEW398-sst1_2.3 1 5.00 Kronos_pEW398-sst1_2.4 1 5.00 Kronos_pEW398-sst1_2.5 1 5.00 Kronos_pEW398-sst1_2.6 1 4.88 Kronos_pEW398-sst1_2.7 4+ 5.00 Kronos_pEW398-sst1_2.8 2 5.00 Kronos_pEW398-sst1_2.9 3 3.13 Kronos_pEW398-sst1_2.11 4+ 2.75 Kronos_pEW398-sst1_2.12 1 4.75 Kronos_pEW398-sst1_2.14 4 5.00 Kronos_pEW398-sst1_2.15 2 5.00 Kronos_pEW398-sst1_2.16 1 5.00 Kronos_pEW398-sst1_2.17 1 5.00 Kronos_pEW398-sst1_2.18 3 5.00 Kronos_pEW398-sst1_2.19 3 5.00
Kronos_pEW398-sst1_2.20 1 5.00 Kronos_pEW398-sst1_2.21 4 5.00 Kronos_pEW398-sst1_2.23 2 4.13 Kronos_pEW398-sst1_2.24 1 5.00 Kronos_pEW398-sst1_3.1 1 5.00 Kronos_pEW398-sst1_3.3 3 5.00 Kronos_pEW398-sst1_3.5 1 4.75 Kronos_pEW398-sst1_3.6 4+ 5.00 Kronos_pEW398-sst1_3.7 1 4.88 Kronos_pEW398-sst1_3.8 4 3.00 Kronos_pEW398-sst1_3.9 1 5.00 Kronos_pEW398-sst1_3.10 1 or 2 5.00 Kronos_pEW398-sst1_3.11 1 4.88
Table S4. Genotypic scores for diagnostic KASP markers usw204 and usw275 and stem-solidness ratings in a panel of durum and bread wheat cultivars. Average whole stem solidness ratings were assigned for each line (1 to 5 visual rating scale with 1 = very hollow-stemmed, and 5 = very solid-stemmed).
Cultivar Species usw204 usw275 Stem Solidness
pithless1 Durum 1 . 1.2
CDC Fortitude Durum 0 1 4.6
W9262-260D3 Durum 0 1 4.4
LDN-GB-3B Durum 0 1 4.6
AC Abbey Hexaploid Wheat 1 1 1.9
AC Eatonia Hexaploid Wheat 1 1 3.1
Lillian Hexaploid Wheat 1 1 2.1
McKenzie Hexaploid Wheat 1 1 1.5
Glenlea Hexaploid Wheat 1 1 1.6
CDC Rama Hexaploid Wheat 1 1 1.7
Unity Hexaploid Wheat 1 1 1.5
Burnside Hexaploid Wheat 1 1 1.2
Glencross Hexaploid Wheat 1 1 1.3
CDN Bison Hexaploid Wheat 1 1 1.1
CDC Landmark Hexaploid Wheat 1 1 1.8
Kyle Durum 1 0 1.3 AC Avonlea Durum 1 0 1.6 AC Morse Durum 1 0 1.5 Napoleon Durum 1 0 1.4 AC Navigator Durum 1 0 1.9 Strongfield Durum 1 0 1.6 Commander Durum 1 0 2.0 CDC Verona Durum 1 0 1.4 Eurostar Durum 1 0 1.4 Brigade Durum 1 0 1.3 Enterprise Durum 1 0 1.8 Transcend Durum 1 0 1.6 Langdon Durum 1 0 1.3 Svevo Durum 1 0 1.6 Kofa Durum 1 0 1.4
AC Barrie Hexaploid Wheat 0 0 1.0
CDC Bounty Hexaploid Wheat 0 0 1.0
AC Cadillac Hexaploid Wheat 0 0 1.0
AC Elsa Hexaploid Wheat 0 0 1.0
Lovitt Hexaploid Wheat 0 0 1.0
Harvest Hexaploid Wheat 0 0 1.0
CDC Imagine Hexaploid Wheat 0 0 1.0
AC Intrepid Hexaploid Wheat 0 0 1.0
AC Splendor Hexaploid Wheat 0 0 1.1
Journey Hexaploid Wheat 0 0 1.0
AC Superb Hexaploid Wheat 0 0 1.0
CDC Teal Hexaploid Wheat 0 0 1.0
CDC Merlin Hexaploid Wheat 0 0 1.0
5500HR Hexaploid Wheat 0 0 1.1
CDC Osler Hexaploid Wheat 0 0 1.0
5600HR Hexaploid Wheat 0 0 1.0
CDC Go Hexaploid Wheat 0 0 1.0
5601HR Hexaploid Wheat 0 0 1.0
CDC Alsask Hexaploid Wheat 0 0 1.0
Roblin Hexaploid Wheat 0 0 1.0
Katepwa Hexaploid Wheat 0 0 1.1
AC Crystal Hexaploid Wheat 0 0 1.1
Marquis Hexaploid Wheat 0 0 1.0
AC Foremost Hexaploid Wheat 0 0 1.0
Red Fife Hexaploid Wheat 0 0 1.0
AC Taber Hexaploid Wheat 0 0 1.1
5700PR Hexaploid Wheat 0 0 1.0
5701PR Hexaploid Wheat 0 0 1.0
AC Vista Hexaploid Wheat 0 0 1.4
Snowbird Hexaploid Wheat 0 0 1.0
AC Andrew Hexaploid Wheat 0 0 1.0
CDC Walrus Hexaploid Wheat 0 0 1.1
Infinity Hexaploid Wheat 0 0 1.0
Waskada Hexaploid Wheat 0 0 1.0
CDC Abound Hexaploid Wheat 0 0 1.0
5602HR Hexaploid Wheat 0 0 1.0
Alvena Hexaploid Wheat 0 0 1.2
5702PR Hexaploid Wheat 0 0 1.0
Goodeve Hexaploid Wheat 0 0 1.0
Snowstar Hexaploid Wheat 0 0 1.0
Helios Hexaploid Wheat 0 0 1.0
Bhishaj Hexaploid Wheat 0 0 1.0
Kane Hexaploid Wheat 0 0 1.2
Somerset Hexaploid Wheat 0 0 1.0
5603HR Hexaploid Wheat 0 0 1.0
Minnedosa Hexaploid Wheat 0 0 1.0
Shaw Hexaploid Wheat 0 0 1.0
Stettler Hexaploid Wheat 0 0 1.0
Glenn Hexaploid Wheat 0 0 1.0
Muchmore Hexaploid Wheat 0 0 1.0
5604HR CL Hexaploid Wheat 0 0 1.0
CDC Stanley Hexaploid Wheat 0 0 1.0
CDC Kernen Hexaploid Wheat 0 0 1.0
CDC Utmost Hexaploid Wheat 0 0 1.0
CDC Thrive Hexaploid Wheat 0 0 1.0
SY985 Hexaploid Wheat 0 0 1.0
Vesper Hexaploid Wheat 0 0 1.0
NRG010 Hexaploid Wheat 0 0 1.0
Sadash Hexaploid Wheat 0 0 1.0
References