Prosthetic heart valve evaluation by magnetic resonance imaging
q
J. Michael Hasenkam
a, b,*, Steffen Ringgaard
c, Kim Houlind
b, Rene M. Botnar
d, Hans
Stùdkilde-Jùrgensen
c, Peter Boesiger
d, Erik Morre Pedersen
a, b, caDepartment of Cardiothoracic and Vascular Surgery, Skejby Sygehus, Aarhus University Hospital, 8200 Aarhus, N., Denmark bInstitute of Experimental Clinical Research, Aarhus University Hospital, 8200 Aarhus, N., Denmark
cMR Center, Skejby Sygehus, Aarhus University Hospital, 8200 Aarhus, N., Denmark dInstitute of Biomedical Engineering, University and E.T.H., ZuÈrich, Switzerland
Received 20 September 1998; received in revised form 7 June 1999; accepted 7 June 1999
Abstract
Objective: To evaluate the potential of magnetic resonance imaging (MRI) for evaluation of velocity ®elds downstream of prosthetic aortic valves. Furthermore, to provide comparative data from bilea¯et aortic valve prostheses in vitro and in patients. Methods: A pulsatile ¯ow loop was set up in a 7.0 Tesla MRI scanner to study ¯uid velocity data downstream of a 25 mm aortic bilea¯et heart valve prosthesis. Three dimensional surface plots of velocity ®elds were displayed. In six NYHA class I patients blood velocity pro®les were studied downstream of their St. Jude Medical aortic valves using a 1.5 Tesla MRI whole-body scanner. Blood velocity data were displayed as mentioned above. Results: Fluid velocity pro®les obtained from in vitro studies 0.25 valve diameter downstream of the valve exhibited signi®cant details about the cross sectional distribution of ¯uid velocities. This distribution completely re¯ected the valve design. Blood velocity pro®les in humans were considerably smoother and in some cases skewed with the highest velocities toward the anterior-right ascending aortic wall. Conclusion: Display and interpretation of ¯uid and blood velocity data obtained downstream of prosthetic valves is feasible both in vitro and in vivo using the MRI technique. An in vitro model with a straight tube and the test valve oriented orthogonally to the long axis of the test tube does not entail ¯uid velocity pro®les which are compatible to those obtained from humans, probably due to the much more complex human geometry, and variable alignment of the valve with the ascending aorta. With the steadily improving quality of MRI scanners this technique has signi®cant potential for comparative in vitro and in vivo hemodynamic evaluation of heart valves. q 1999 Elsevier Science B.V. All rights reserved.
Keywords: Prosthetic heart valve; Magnetic resonance imaging; Hemodynamics; In vitro; Human
1. Introduction
Replacement of a diseased heart valve with a prosthetic device is a routine procedure with excellent long-term results [1]. The predominant long-term complications which still hamper a complete success for this treatment are thrombo-embolic complications and hemolysis which are ®rst of all considered related to the hemodynamic performance of the valve prosthesis [2,3]. Therefore, an essential part of prosthetic heart valve evaluation is devoted to their hemodynamic performance. Consequently, the pros-thetic heart valve design has been improved over the last 30±40 years to provide steadily better ¯uid and hemody-namic characteristics [4].
Due to the importance of this issue the regulatory autho-rities consider hemodynamic performance of heart valve prostheses as a key area in their essential requirements for approving these devices to be used in humans [5,6]. Tradi-tionally, in vitro and in vivo studies are performed by laser Doppler anemometry and echo Doppler cardiography used in different models and different applications. Therefore, it is often dif®cult to extrapolate data from the in vitro to the in vivo environment.
Magnetic resonance imaging (MRI) is a relatively new tool in this arena [7±9], but the beauty of this modality is its applicability to both in vitro and in vivo assessment of blood velocity ®elds and also for imaging purposes. Numerous studies have shown the reliability of MRI for velocity ®eld and volume ¯ow studies in a variety of settings [9± 16]. Only few studies have reported on evaluation of pros-thetic heart valves using this modality. A clinical concern has been raised as to whether heart valve patients can be subjected to MRI scanning at all both from a patient safety
European Journal of Cardio-thoracic Surgery 16 (1999) 300±305
1010-7940/99/$ - see front matter q 1999 Elsevier Science B.V. All rights reserved. PII: S1010-7940(99)00215-8
www.elsevier.com/locate/ejcts
qPresented at the 12th Annual Meeting of the European Association for
Cardio-thoracic Surgery, Brussels, Belgium, September 20-23, 1998. * Corresponding author. Tel.: 145-89-49-5480; fax 145-89-49-6016. E-mail address: [email protected] (J.M. Hasenkam)
point of view and from a signal-to-noise point of view since the valve induce a signi®cant artifact on the MRI image. We hypothesize that MRI can provide complementary hemody-namic data from prosthetic heart valves both in vitro and in vivo.
The purpose of this study was, therefore, to demonstrate the feasibility of using the MRI technique for heart valve studies by a qualitative comparison of velocity ®eld data obtained downstream of a bilea¯et prosthetic aortic valve in a pulsatile ¯ow model with similar data from patients. 2. Materials and methods
2.1. In vitro
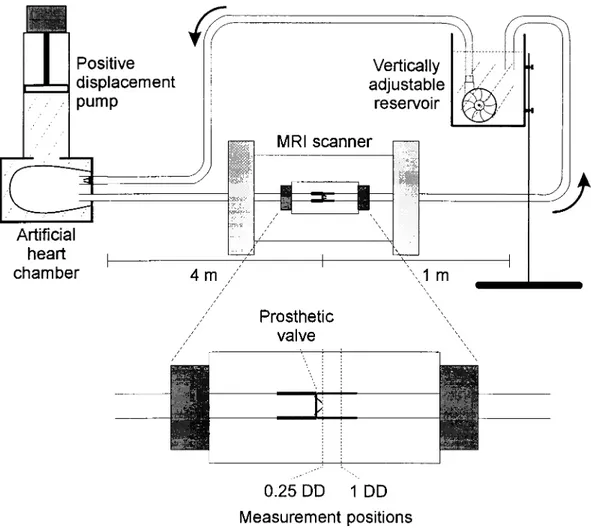
A 25 mm bilea¯et mechanical aortic valve was mounted in a rigid PVC casting comprised in a pulsatile ¯ow loop (Fig. 1). A water-®lled cylindrical chamber was placed around the valve test section positioned in the magnet bore to allow phase offset correction [10].
The test ¯uid was water mixed with
carboxy-methyl-cellulose to provide a dynamic viscosity of 0.051 g/cm per s. MnCl2was added to provide bloodlike MR relaxation
times. It was circulated in the ¯ow loop by a computer-controlled positive displacement pump (VIVITRO Systems, Canada) coupled to an arti®cial polyurethane left ventricular chamber. The test ¯uid was pumped in a pulsatile physio-logic way through the test section comprising the test valve to a height adjustable reservoir which ensured appropriate
out¯ow resistance. The mean ¯ow rate was 4.6 l min21and
pulse frequency was 60 min21giving a peak systolic ¯ow
rate of 250 ml/s.
The axial ¯uid velocity component was measured at two levels: 0.25 (0.25DD) and 1 diameter (1DD) downstream of the valve ring in a plane orthogonal to the main ¯ow axis.
In order to obtain maximum performance (high resolu-tion) of the MRI technique, we used a high ®eld strength magnet in vitro accepting the inherent limitation that the measuring object (the ¯ow model) had to ful®l some space limitations in order to ®t into the magnet.
The MRI instrument was a 7.0 Tesla SISCO scanner (SIS-300/183, Varian, Palo Alto, CA, USA). The bore diameter of the scanner was 10 cm. Technical details are provided
Fig. 1. The pulsatile ¯ow loop used for in vitro velocity ®eld studies in the magnetic resonance (MR) scanner. A 4 m long 25 mm inlet tube was inserted to avoid magnetic interference from the MR scanner on the pulsatile pump. The bilea¯et heart valve was placed in a test section placed in the SISCO 7.0 Tesla MR scanner. The water reservoir tank was adjustable in height to adapt output resistance to physiologic relevant values.
J.M. Hasenkam et al. / European Journal of Cardio-thoracic Surgery 16 (1999) 300±305 302
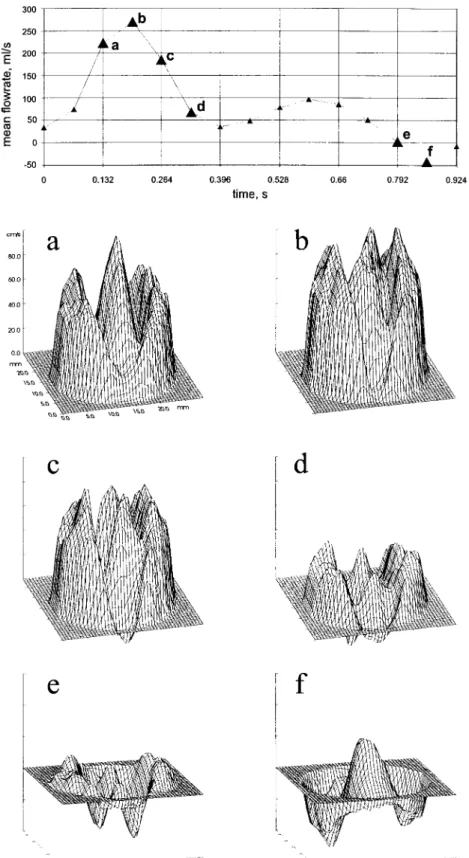
Fig. 2. Fluid velocity pro®les 0.25 mm downstream of a 25 mm aortic bilea¯et valve prosthesis mounted in the pulsatile ¯ow model shown in Fig. 1. The top tracing of the ¯ow curve indicates where in the `cardiac' cycle velocity pro®les have been plotted (a±f). In systole the bilea¯et valve design is clearly re¯ected on the velocity pro®le contour showing velocity jets downstream of the two major ori®ces and the central slit between the two lea¯ets (a±d). In late systole retrograde velocities are apparent in the hinge areas, and in diastole peripheral retrograde velocities are evident. The simultaneous presence of central antegrade velocity indicates a ¯ow vortex downstream of the closed valve.
elsewhere [11]. The temporal resolution was 66 ms, the thickness of the slice (pixel size) was 1 mm. A ®eld of view of 80 £ 80 mm and a 256 £ 256 matrix gave an in-plane spatial resolution of 0:31 £ 0:31 mm. A trigger signal from the computer controlled pump allowed data acquisi-tion from the scanner to be synchronized with the pulsatile ¯ow. The MRI data were analyzed on a DEC-Alpha (Digital Equipment Corp., USA) workstation using a dedicated analysis program based on the PV-Wave (Visual Numerics, Boulder, CO, USA) programming language.
Fluid velocities were visualized as three-dimensional surface plots.
2.2. In vivo
Six patients, three male and three female aged 22±74 (mean 52.6) years, who had a St. Jude Medical aortic valve inserted volunteered in the study. They all gave writ-ten and oral consent and the project was approved by the local ethics committee and conformed with the Helsinki II declaration. Valve sizes were 21±27 mm in tissue annulus diameter and all patients were in NYHA class I. Standardi-zation of valve orientation at implantation was not performed. Electrocardiogram was continuously monitored during the entire procedure.
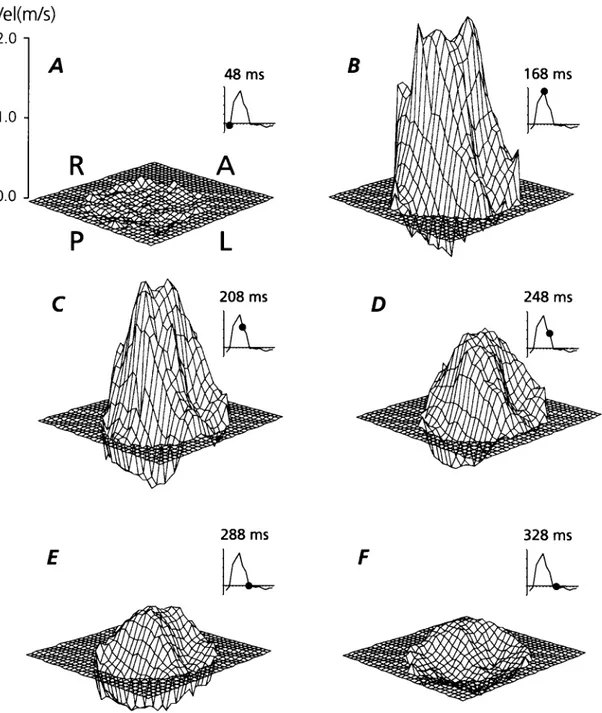
Fig. 3. Blood velocity ®elds downstream of a St. Jude medical valve in the aortic position of a patient. A,P,L,R means relation of blood velocities to the Anterior, Posterior, Left and Right ascending aortic wall. The small velocity tracings indicate time in cardiac cycle where the velocity surface contour plot has been derived from. See Fig. 2 for comparison with in vitro data.
The MRI scanning was performed in a Philips 1.5 Tesla Gyroscan S15/HP whole-body scanner (Philips Medical Systems, Best, Netherlands) with patients lying in supine position. Initially a series of spin echo scouts and coronal cine gradient echo images were made to locate the valve and determine its angulation in relation to the ascending aorta. To minimize signal void due to disturbed ¯ow, blood velo-city measurements were accomplished by the low echotime FAcE (Free Induction Decay Acquired Echo) sequence [12] in an image plane perpendicular to the ascending aorta. The image disturbances originating from the moving heart valve did not allow us to measure closer to the valve than 1 valve diameter (1DD) downstream of the valve ring. For refer-ence, blood velocities were also measured 2 valve diameters downstream (2DD).
The image slice thickness was 10 mm. A ®eld of view of 400 mm was applied on a 128 £ 128 matrix giving an in-plane spatial resolution (pixel size) of 3:1 £ 3:1 mm. An image was generated every 40 ms throughout the heart cycle. The time for completing an investigation was approximately 90 min.
The MRI data were reconstructed on the MRI host computer for imaging purposes. Subsequently data were transferred to a SPARC II workstation (Sun Microsystem Inc., Mountain View, CA, USA), where additional compen-sation for artefacts in the velocity images was performed as previously described [10].
Like for the in vitro data analysis, blood velocity data were displayed as three-dimensional surface plots as seen from a position downstream of the valve.
3. Results
Fluid velocity pro®les 0.25 valve diameters downstream of the bilea¯et heart valve prosthesis in the pulsatile ¯ow model are presented in Fig. 2 at 6 different times during the `cardiac' cycle. In the systolic acceleration phase the valve design features were most clearly re¯ected with three jets corresponding to the two major ori®ces and the gap between the two lea¯ets. At top systole the pro®le was smoother but with the same overall characteristics. In the systolic decel-eration phase reverse ¯ow was seen at the hinge areas and in diastole abundant reverse ¯ow particularly in the periphery was observed. The central antegrade ¯ow area in late diastole occurring simultaneously with reverse ¯ow periph-erally is interpreted as a large vortex rotating on the closed valve.
One diameter downstream of the valve (1DD) the overall velocity pro®le features were the same but with a smoother appearance than at position 0.25DD. In both measuring planes the velocity pro®les were axisymmetric.
The blood velocity pro®les obtained from the patients had the same overall appearance in all cases. The temporal development of the blood velocity pro®le in one of the patients one diameter downstream of the valve is displayed
in Fig. 3. During the acceleration phase, the highest velo-cities were disclosed in the two wall near areas of the vessel downstream of the two lateral valve ori®ces. At top systole and throughout the systolic deceleration phase, the valve features are consistently identi®able although not to the same extent as in vitro. An evident overall skewness of the velocity pro®le could be seen with the highest velocities toward the anterior right vessel wall. The skewness and contour of the velocity pro®les were more enhanced at the 1DD than the 2DD position.
In all patients reverse ¯ow during late systole was seen at the posterior-left vessel wall at both downstream positions. Estimated cardiac output was 4.3±5.8 l min21(mean 5.2 l
min21) during measurements and heart rate was 65±81
min21(mean 73.1 min21).
None of the patients expressed any discomfort during or after the experiment.
4. Discussion
Fluid and blood velocity pro®les display an analogous pattern in vitro and in humans when MRI is applied for this purpose. The data we obtained are also consistent with those from other studies e.g. [4,13,14] where other measuring techniques have been used.
The advantage of MRI for in vitro ¯uid and in vivo hemo-dynamic evaluation of heart valve prostheses is the capacity to study velocity ®elds across the entire aortic area and with the capacity to measure all three velocity components both in vitro [7] and in vivo [15].
Using the small-bore, high magnetic ®eld strength magnet it is possible to measure ¯uid velocities very close to the valve with a high temporal and spatial resolution, although not to the extent that allows turbulence analysis.
The in vitro investigations allow us to interpret velocity ®elds in quite signi®cant detail and thus evaluate the impact of valve design on the ¯ow through the valve.
The present study shows that velocity ®elds downstream of a bilea¯et prosthetic heart valve cannot be extrapolated directly to a predicted outcome in patients. A study valve carefully mounted orthogonally to the long axis of the test tube will inherently provide nice symmetric velocity pro®les compared to the clinical situation where this kind of idealized geometry in the left ventricular out¯ow tract, the aortic root or the ascending aorta is not present. Since the aortic annulus is often not orthogonal to the long axis of the ascending aorta skewed blood velocity pro®les in the curved aorta is to be expected.
Furthermore, the 7.0 Tesla magnet used for in vitro studies obviously allows much more detailed display due to the ten times higher spatial resolution than the 1.5 Tesla whole-body MRI scanner.
Evidently, this study needs to be followed up by similar investigations of other valve types using MRI both in vitro and in vivo. Due to the non-invasive character and safety of
J.M. Hasenkam et al. / European Journal of Cardio-thoracic Surgery 16 (1999) 300±305 304
this procedure such investigations can be accomplished in patients without signi®cant ethical problems.
Newer MRI hard- and software have signi®cantly improved the performance of the MRI techniques in terms of spatial and temporal resolution and shortening of experi-ment time consumption. Newer techniques such as naviga-tors for respiratory control, combined with valve motion following modalities [16] will reduce the artefacts produced by the valve prosthesis, and allow measurements closer to the valve prostheses.
We conclude that MRI has advantages over the traditional hemodynamic measuring equipment due to its versatile applicability and the reliable outcome. Furthermore, in vitro models need to comprise much more geometrical complexity in order to simulate ¯ow conditions in vivo. On the other hand, geometrical simplicity facilitates the interpretation of ¯ow ®elds downstream of prosthetic heart valves without modulation from the environment.
Acknowledgements
This study has been ®nancially supported by The Karen Elise Jensen Foundation, The Asta Florida Boldings Legat, The Danish Heart Foundation (fellowship for Kim Houlind and grant #97-2-1-5-22549) and The Desiree and Niels Yde Foundation.
References
[1] Grunkemeier GL, Starr A, Rahimtoola SH. Prosthetic heart valve performance: long-term follow-up. Curr Prob Cardiol 1992;17:331± 406.
[2] Stein PD, Sabbah HN. Measured turbulence and its effects on throm-bus formation. Circ Res 1974;35:608±614.
[3] Roschke EJ, Harrison EC. Fluid shear stress in prosthetic heart valves. J Biomechanics 1997;10:299±311.
[4] Yoganathan AP, Wick TM, Reul H. The in¯uence of ¯ow character-istics of prosthetic valves on thrombus formation. In: Butchart EG, Bodnar E, editors. Thrombosis, embolism and bleeding, 1. London: ICR, 1992. pp. 123±148.
[5] Nolan SP. The international standard cardiovascular implants±cardiac valve prostheses (ISO 5840: 1989) and the FDA draft replacement heart valve guidance (version 4.0). J Heart Valve Dis 1994;3:347± 349.
[6] CEN/TC 285. Non-active surgical implants. Particular requirements for cardiac and vascular implants. Part 1: Heart valve substitutes. PrEN 12006-1.
[7] Walker PG, Pedersen EM, Oyre S, Flepp L, Ringgaard S, Heinrich RS, Walton SP, Hasenkam JM, Jùrgensen HS, Yoganathan AP. Magnetic resonance velocity imaging: a new method for prosthetic heart valve study. J Heart Valve Dis 1995;4:296±307.
[8] Fontaine AA, Heinrich RS, Walker PG, Pedersen EM, Scheidegger MB, Boesiger P, Walton SP, Yoganathan AP. Comparison of magnetic resonance imaging and laser Doppler anemometry velocity measurements downstream of replacement heart valves: implications for in vivo assessment of prosthetic valve function. J Heart Valve Dis 1996;5:66±73.
[9] Houlind K, Eschen O, Pedersen EM, Jensen T, Hasenkam JM, Paul-sen PK. Magnetic resonance imaging of blood velocity distribution around St. Jude Medical aortic valves in patients. J Heart Valve Dis 1996;5:511±517.
[10] Walker PG, Cranney GB, Scheidegger MB, Waseleski G, Pohost GM, Yoganathan AP. Semiautomated method for noise reduction and background phase error correction in NMR phase velocity data. J Magn Reson Imaging 1993;3:521±530.
[11] Ringgaard S, Botnar RM, Djurhuus C, Stùdkilde-Jùrgensen H, Hasen-kam JM, Boesiger P, Pedersen EM. High resolution assessment of velocity ®elds and shear stresses distal to prosthetic heart valves with high ®eld magnetic resonance. J Heart Valve Dis 1999;in press. [12] Scheidegger MB, Maier SE, Boesiger P. FID-acquired echos (FAcE):
a short echo time imaging method for ¯ow artifact suppression. Magn Reson Imaging 1991;9:517±524.
[13] Hasenkam JM, Giersiepen M, Reul H. Three-dimensional visualiza-tion of velocity ®elds downstream of six mechanical aortic valves in a pulsatile ¯ow model. J Biomechanics 1988;21:647±661.
[14] Paulsen PK, Hasenkam JM, Stùdkilde-Jùrgensen H, Albrechtsen O. Three-dimensional visualization of velocity pro®les in the ascending aorta in humans. A comparative study among aortic valves, St. Jude Medical and Starr-Edwards silastic ball valves. Int J Artif Organs 1988;11:277±292.
[15] Kim WY, Walker PG, Pedersen EM, Poulsen JK, Houlind K, Oyre S, Yoganathan AP. Left ventricular blood ¯ow patterns in normal subjects: a quantitative analysis by three-dimensional magnetic reso-nance velocity mapping. J Am Coll Cardiol 1995;26:224±238. [16] Kozerke S, Hasenkam JM, Nygaard H, Paulsen PK, Scheidegger MB,
Pedersen EM, Boesiger P. Heart motion adapted cine ¯ow measure-ments downstream of the St. Jude medical aortic valve. In: Proc Eur Soc Magn Res Med Biol, 15th Annual Meeting, Geneva, September 1998.
Appendix A. Conference discussion
Dr. L. Cohn (Boston, MA, USA): What do you think is going to be the clinical applicability of this particular test? I was surprised that you could put a metal valve in a magnet. But what do you think the clinical applic-ability of this test will be?
Dr. Hasenkam: It was not our primary goal to make clinical applic-ability of the magnetic resonance imaging, but obviously you can have it as a diagnostic tool in order to verify the function of the valve where you can see re¯ection of the velocity ®elds downstream of the valve. The purpose was mostly to evaluate the pro®les in different types of valves so you can have a basic bank of data describing different types of valves.
Dr. E. Baudet (Bordeaux, France): Could you deduce shear stresses downstream aortic prostheses from velocity pro®les assessed by MRI?
Dr. Hasenkam: MRI does not allow us directly to do shear stress measurements, and especially not turbulence shear stress measurements, of course. But if you take the velocity gradients in the pro®le, you can have indications where in the cross sectional area turbulence is prone to occur. So you can have an indication of shear stresses in that way.
Dr. R. DeSimone (Heidelberg, Germany): You know that MRI has a very slow acquisition rate. Which kind of procedure, or sequences (as they are called) did you use for making the acquisition? This is a very actual subject and perhaps you can explain more details about the sequence used. Dr. Hasenkam: I am certainly not the technical MRI expert of the group, but we used the so called FAcE technique. You might know that this technique has a very short echo time, allowing us to have a fairly short acquisition time of the data. But, sorry to say, I don't know the precise details about the technical applicability.