HAL Id: hal-00464222
https://hal.archives-ouvertes.fr/hal-00464222
Preprint submitted on 16 Mar 2010
HAL is a multi-disciplinary open access
archive for the deposit and dissemination of
sci-entific research documents, whether they are
pub-lished or not. The documents may come from
teaching and research institutions in France or
abroad, or from public or private research centers.
L’archive ouverte pluridisciplinaire HAL, est
destinée au dépôt et à la diffusion de documents
scientifiques de niveau recherche, publiés ou non,
émanant des établissements d’enseignement et de
recherche français ou étrangers, des laboratoires
publics ou privés.
Reducing Costs of Spot Instances via Checkpointing in
the Amazon Elastic Compute Cloud
Sangho Yi, Derrick Kondo, Artur Andrzejak
To cite this version:
Sangho Yi, Derrick Kondo, Artur Andrzejak. Reducing Costs of Spot Instances via Checkpointing in
the Amazon Elastic Compute Cloud. 2010. �hal-00464222�
Reducing Costs of Spot Instances via Checkpointing
in the Amazon Elastic Compute Cloud
Sangho Yi and Derrick Kondo
INRIA Grenoble Rhône-Alpes, France {sangho.yi, derrick.kondo}@inrialpes.fr
Artur Andrzejak
Zuse Institute Berlin (ZIB), Germany andrzejak@zib.de
Abstract—Recently introduced spot instances in the Amazon Elastic Compute Cloud (EC2) offer lower resource costs in exchange for reduced reliability; these instances can be revoked abruptly due to price and demand fluctuations. Mechanisms and tools that deal with the cost-reliability trade-offs under this schema are of great value for users seeking to lessen their costs while maintaining high reliability. We study how one such a mechanism, namely checkpointing, can be used to minimize the cost and volatility of resource provisioning. Based on the real price history of EC2 spot instances, we compare several adaptive checkpointing schemes in terms of monetary costs and improvement of job completion times. Trace-based simulations show that our approach can reduce significantly both price and the task completion times.
I. INTRODUCTION
The vision of computing as a utility has reached new heights with the recent advent of Cloud Computing. Compute and storage resources can be allocated and deallocated almost instantaneously and transparently on an as-need basis.
Pricing of these resources also resembles a utility, and resources prices can differ in at least two ways. First prices can differ by vendor. The growing number of Cloud Computing vendors has created a diverse market with different pricing models for cost-cutting, resource-hungry users.
Second, prices can differ dynamically (as frequently as an hourly basis) based on current demand and supply. In December 2009, Amazon released spot instances, which sell the spare capacity of their data centers. Their dynamic pricing model is based on bids by users. If the users’ bid price is above the current spot instance price, their resource request is allocated. If at any time the current price is above the bid price, the request is terminated. Clearly, there is a trade-off between the cost of the instance and its reliability.
The current middleware run on top of these infrastructures cannot cope or leverage changes in pricing or reliability. Ideally, the middleware would have mechanisms to seek by itself the cheapest source of computing power given the demands of the application and current pricing.
In this paper, we investigate one mechanism, namely check-pointing, that can be used to achieve the goal of minimizing monetary costs while maximizing reliability. Using real price traces of Amazon’s spot instances, we study various dynamic checkpointing strategies that can adapt to the current instance price and show their benefit compared to static, cost-ignorant strategies. Our key result is that the dynamic checkpointing
strategies significantly reduce the monetary cost, while im-proving reliability.
The remainder of this paper is organized as follows. Sec-tion II presents checkpointing strategies on spot instances in the Amazon Elastic Compute Cloud (EC2). Section III eval-uates performance of several checkpointing strategies based on the previous price history of the spot instances. Section IV describes related work. Finally, Section V presents conclusions and possible extensions of this work.
II. SPOTINSTANCES ONAMAZONEC2
In this section we describe the system model used in this paper and introduce the considered checkpointing schemes.
A. System Model
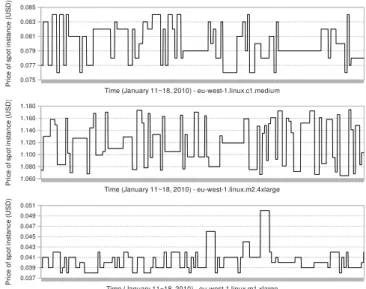
Figure 1. Spot price fluctuations of eu-west-1.linux instance types
Amazon allows users to bid on unused EC2 capacity pro-vided as 42 types of spot instances that differ by computing
/ memory capacity, OS type and geographical location [1]. Their prices called spot prices change dynamically based on supply and demand. Figure 1 shows examples of spot price fluctuations for three eu-west-1.linux instance types during8
days in January 2010. Customers whose bids meet or exceed the current spot price gain access to the requested resources. Figure 2 shows how Amazon EC2 charges per-hour price
Figure 2. Examples of pricing for Amazon EC2’s spot instance
for using a spot instance. The following system model was made according to the characteristics of Amazon EC2’s spot instances.
⋄ Amazon provides a spot instance when a user’s bid is greater than the current price.
⋄ Amazon stops immediately without any notice when a user’s bid is less than or equal to the current price. We call this an out-of-bid event or a failure.
⋄ Amazon does not charge the latest partial hour when Amazon stops an instance.
⋄ Amazon charges the last partial hour when a user termi-nates an instance.
⋄ The price of a partial-hour is considered the same as a
full-hour.
⋄ Amazon charges each hour by the last price.
⋄ Amazon freely provides the spot price history.
⋄ The price of Amazon’s storage service is negligible1.
B. Definitions
Let tr denote the remaining computing time of a task to finish (for a fixed instance type), and T(t) the expected
execution time of a task without taking checkpoints. By tc we denote the time for taking a checkpoint. For a given bid price
ubon an instance type, we are interested in the probability of a failure (i.e. out-of-bid situation). For this purpose we introduce a probability density function f(t, ub) of failure occurrences where t is the time since the last checkpoint. This function can be approximated from the history of price fluctuations. Let
ta be the time needed for analyzing this history in order to approximate f(t, ub) (for a bid ub). Figure 3 shows an example of f(t, ub) for the eu-west-1.linux-c1.medium instance type. It shows that the probability density function is a function of both the time and the user’s bid. With the term rising edge, we refer to the event (and its time) where the spot price for a
1Amazon provides free storage service up to June 30th 2010, and after July
1st, the price will be 0.15 USD for 1 GB-month. This is much lower than
the price of computation [2].
Figure 3. Examples of probability density function of failure (out-of-bid) occurrence, f(t, ub) on eu-west-1.linux-c1.medium instance type
Table I
NOTATIONS AND SYMBOLS USED IN THIS PAPER
Notation Description
tr remaining work of task in time
tc time to take a checkpoint
ta time to analyze price history for obtaining f(t, ub)
r time to restart a task
ub user’s bid on a spot instance type
f(t, ub) probability density function of a failure occurrence
where t is time, and ubis the user’s given bid
e(t, ub) probability density function of a rising edge occurrence
where t is time, and ubis the user’s given bid
ne number of rising edges of spot price that arrived in the
current availability interval
me(ub) mean number of rising edges in an availability interval
according to ub
T(t) expected execution time of a task without checkpointing when executing t time units
Htake(t) expected recovery time of a task with hour-boundary
checkpointing at t time units after taking checkpoint
Hskip(t) expected recovery time of a task without hour-boundary
checkpointing at t time units after taking checkpoint
Etake(t) expected recovery time of a task with rising edge-driven
checkpointing at t time units after taking checkpoint
Eskip(t) expected recovery time of a task without rising
edge-driven checkpointing at t time units after taking checkpoint
given instance type has increased. The e(t, ub) is a probability density function of rising edge occurrences where t is the time since the last checkpoint.
Htake(t) and Hskip(t) are the expected recovery time of a task if we take a checkpoint or skip it at the hour-boundary time. Here t is time since last checkpoint. Etake(t)
and Eskip(t) are the expected recovery time if we take a
checkpoint or skip it at a rising edge. Table I describes notations and symbols used in this paper. From the price history, we can calculate other metrics shown in Table I such as the mean spot price, and the mean number of rising edges in an available duration.
C. Expected recovery time
In this section, we derive analytical formulas for Htake(t), Hskip(t), Etake(t) and Eskip(t) describing the expected re-covery time in various situations. They are used in Section
Figure 4. Effects of skipping and taking a checkpoint on the recovery time
II-D3 for adaptive checkpointing schemes. To this aim, we modify the determination functions and notations from [3], [4]2. This yields the following Theorem 1 on the expected
execution time of a process without checkpointing.
Theorem 1: The expected execution time T(t) of a process
without checkpointing when executing t time units is
T(t) = t+ Pt−1 k=0(k + r − t)f (k, ub) 1 −Pt−1 k=0f(k, ub) . (1)
Proof: The conditional expected execution time is written
as [3]:
T(t) = (
t if k≥t
k+ r + T (t) otherwise.
By the law of total expectation
T(t) = ∞ X k=t tf(k, ub) + t−1 X k=0 (k + r + T (t))f (k, ub). Rearranging with respect to T(t), we obtain
T(t) = P∞ k=0tf(k, ub) +Pt−1k=0(k + r − t)f (k, ub) 1 −Pt−1 k=0f(k, ub) . Since P∞ k=0tf(k, ub) = t, we have T(t) = t+ Pt−1 k=0(k + r − t)f (k, ub) 1 −Pt−1 k=0f(k, ub) .
In Eq. (1) f(k, ub) significantly affects the T (t). For example, without failuresPt−1
k=0f(k, ub) goes to 0, and thus T (t) = t. Otherwise, T(t) is larger becausePt−1
k=0f(k, ub) > 0. Based on Eq. (1) we can calculate the expected recovery time for both cases of skipping and taking a checkpoint, which is illustrated in Fig. 4.
Theorem 2: The expected recovery time when skipping
an hour-boundary checkpoint at t time units after taking checkpoint, Hskip(t) is given by
2We modified Theorem 1 in [3] because we use discrete time series and
the measured probability density function of failure occurrence based on the real traces. For more information, please see Fig. 1 and Theorem 1 in [3].
Hskip(t) = tr−1
X
k=0
(k + r + T (t))f (k, ub). (2)
Proof: When a failure occurs within tr time units, the task should be re-executed from the last checkpoint, and thus,
Hskip(t) =
(
k+ r + T (t) if k < t 0 otherwise. By integrating above, we obtain Eq. (2).
Theorem 3: The expected recovery time when taking an
hour-boundary checkpoint at t time units after taking check-point, Htake(t) is given by
Htake(t) = tr−1 X k=0 (k + r)f (k, ub) + tc−1 X k=0 T(t)f (k, ub) + T (tc). (3)
Proof: When a failure occurs within tctime units, the task should be re-executed from the last checkpoint, and when a failure occurs in tc ≤k < tr the task can be recovered from the new checkpoint. In addition, Htake(t) has overhead T (tc) of taking a checkpoint, and thus,
Htake(t) = T (tc) + k+ r + T (t) if k < tc k+ r else if tc≤k < tr 0 otherwise. By the law of total expectation
Htake(t) = tc−1 X k=0 (k + r + T (t))f (k, ub) + tr−1 X k=tc (k + r)f (k, ub) + T (tc). Simplifying above with k+ r, we obtain Eq. (3).
To derive formulas for Etake(t) and Eskip(t) we use the mean rising edge me(ub), the number of arrived rising edges in the current duration ne, and the probability density function of rising edge occurrence e(k, ub). We obtain Eskip(t) and
Etake(t) by substituting n
ee(k,ub)
me(ub) for f(k, ub) in Eq. (2) and
Eq. (3), respectively.
Eskip(t): The expected recovery time when skipping a rising edge-driven checkpoint is given by
Eskip(t) = tr−1 X k=0 (k + r + T (t))nee(k, ub) me(ub) (4)
Etake(t): The expected recovery time when taking a rising edge-driven checkpoint is given by
Figure 5. Hour-boundary checkpointing
Figure 6. Rising edge-driven checkpointing
Etake(t) = tr−1 X k=0 (k + r)nee(k, ub) me(ub) + tc−1 X k=0 T(t)nee(k, ub) me(ub) + T (tc) (5)
In Eq. (4) and Eq. (5), the combined density factor nee(k,ub)
me(ub)
denotes how the current point of time is close to (or far from) the expected failure occurrence from the current time. For example, when a system has a significantly large number of rising edges for each availability duration, and a few rising edges have arrived, then the density factor Ptc−1
k=0
nee(k,ub)
me(ub)
goes to 0. In this case, Eskip(t) goes to 0, while Etake(t) =
T(tc). On the other hand, when the neapproaches to me(ub), the factor goes to e(k, ub). In this case, Eskip(t) may be greater than Etake(t).
D. Checkpointing Schemes
In the following we describe the proposed checkpointing schemes in the considered scenario.
1) Hour-boundary Checkpointing: Figure 5 illustrates the
hour-boundary checkpointing method. Here checkpoints are taken periodically at hour boundaries. It is the most intuitive one for the spot instances, because an hour is the lowest gran-ularity of spot instance pricing. It also provides a guarantee of paying for the actual progress of computation.
A variation of this policy is the fine-grained checkpointing which evaluates whether to take a checkpoint periodically every10 or 30 minutes. See [3] for details.
2) Rising edge-driven Checkpointing: Figure 6 presents the
rising edge-driven checkpointing which is novel compared to previous checkpoint methods. In the world of the spot instances, rising (and falling) edges occur according to the number of available resources, the bids from users, and the number of bidders. A rising edge is likely to indicate that the system has less available resources, more bidding users, or higher bids from users, and so an out-of-bid event (for a constant bid) is more likely. However, taking checkpoints at
Table II
DESCRIPTION OF CHECKPOINTING POLICIES
Name Description
OPT the optimal base (takes checkpoints just prior to failures) NONE without checkpointing
H hour-boundary checkpointing E rising edge-driven checkpointing AH adaptive hour-boundary checkpointing
(decides every hour-boundary whether to take or skip) AE adaptive rising edge-driven checkpointing
(decides every rising-edge whether to take or skip) H+E hour-boundary and rising edge-driven checkpointing H+AE hour-boundary and adaptive rising edge-driven checkpointing AH+E adaptive hour-boundary and rising edge-driven checkpointing AH+AE adaptive hour-boundary and adaptive rising edge-driven
checkpointing
AF(10) adaptive fine-grained checkpointing [3]
(decides every 10 minutes whether to take or skip) AF(30) adaptive fine-grained checkpointing [3]
(decides every 30 minutes whether to take or skip)
all rising edges does not guarantee checkpointing at hourly boundaries, and in some cases, rising edges may not occur during an availability period. Consequently, the rising edge-driven checkpointing might fail to reduce the execution time if a sudden increase of the spot price occurs.
3) Checkpointing with Adaptive Decision: Figure 4
com-pares effects of taking or skipping a checkpoint at the current time. This decision significantly affects the recovery time if a failure occurs, and thus the execution time of the running task. By using the formulas derived in Section II-C we can compare whether it is more useful to take or to skip a checkpoint. In more detail, our policy takes a checkpoint at an hour boundary if Hskip(t) > Htake(t) and skips it otherwise. Analogously, by comparing Etake(t) against Eskip(t), we learn whether to take (Eskip(t) > Etake(t)) or to skip (Eskip(t) < Etake(t)) a checkpoint at a rising edge. In those notations, t is a relative time since the last checkpoint (or, when the task does not have checkpoint, it is the time since the starting time of its execution.)
4) Checkpointing Combinations: The above checkpointing
schemes are orthogonal to each other. We obtain12 different
types of checkpointing policies by combining them. The detailed information is given in Table II.
E. Partial Improvement based on the Delayed Termination
Amazon EC2’s pricing rules allow the following method to reduce the computation costs. As shown in Fig. 1, Amazon does not charge the last partial-hour when EC2 terminates the running instance (the last partial hour is charged if termination is due to the user). Based on that fact, each user can delay termination of the running instance up to the hour-boundary, and Amazon may terminate the running task with probability
pt, then the users may have pt×price_per_hour reduction
from the total price.
III. EVALUATION OF THECHECKPOINTINGPOLICIES
In this section, we analyze the impact of checkpointing policies on all 42 spot instance types in Amazon EC2. We
Table III
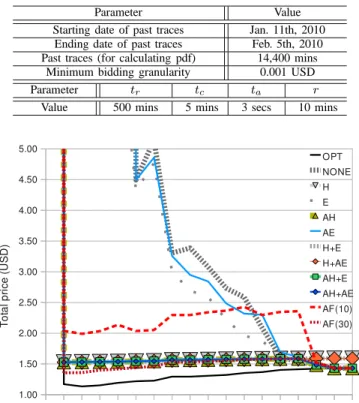
VALUES OF PARAMETERS USED IN THIS PAPER
Parameter Value Starting date of past traces Jan. 11th, 2010 Ending date of past traces Feb. 5th, 2010 Past traces (for calculating pdf) 14,400 mins
Minimum bidding granularity 0.001 USD Parameter tr tc ta r
Value 500 mins 5 mins 3 secs 10 mins
Figure 7. Total execution price on eu-west-1.linux.m1.large instance type
simulated the checkpointing schemes based on the real price traces in terms of the task completion time, total price, and the price×time product.
A. Simulation Setup
Table III shows our simulation setup in detail. We assume that the checkpointing cost of running programs is known. We used the constant value for the tc, but using a variable checkpointing cost is also possible in our system model. We assume that the total work of each program is 500 minutes,
and we used the latest 10-days (14, 400 minutes) of price
history to get the probability density function of the availability durations.
We implemented a simulator which reads the past history of spot price, calculates the probability density function of availability durations and rising edges, and simulates the 12
types of checkpointing policies (see Table II) on the 42 types
of spot instances. For each data point, we simulated 100 experiments to ensure confidence of our results.
B. Simulation Results and Evaluation
In the following, the policy OPT serves as a comparison baseline and is optimal in the sense that checkpoints are taken immediately before failures known in advance.
Figure 8. Task completion time on eu-west-1.linux.m1.large instance type
1) eu-west-1.linux.m1.large instance type: We have picked
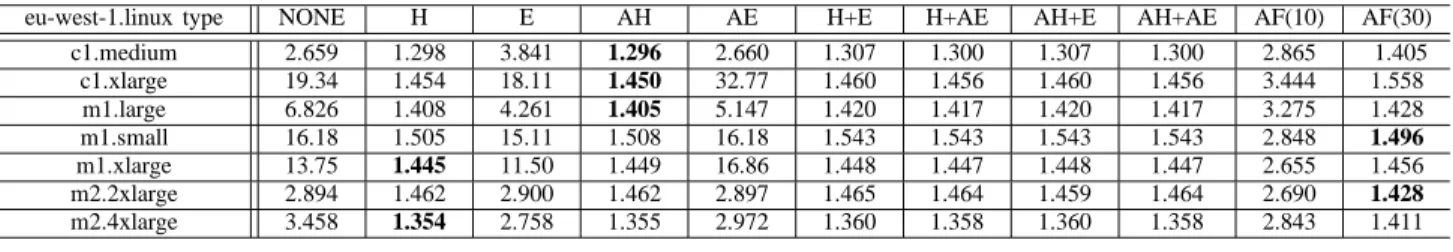
the eu-west-1.linux.m1.large as a representative instance type to evaluate the total price of a task, its completion time, and a product of both as a combined metric.
Total price. Figure 7 shows the total price for the
investi-gated instance type. Obviously the edge-driven checkpoint-ing policies perform poorly. Policy AF(30) has lower cost compared with the other combinations of hour-boundary and edge-driven checkpointing policies. This result shows that the edge-driven checkpointing is not effective in reducing price compared with other checkpointing policies. Furthermore, we have a10 ∼ 30 percent difference between OPT and the other
policies.
Task completion time. Figure 8 shows the task completion
time for the eu-west-1.linux.m1.large instance type. The adap-tive fine-grained checkpointing performs more poorly than the other combinations. The adaptive hour-boundary checkpoint-ing shows slightly lower task completion times than the normal hour-boundary policy. The difference between OPT and the other policies is about10 ∼ 15 percent.
Combined metrics. Figure 9 shows the performance metrics
combined, i.e., the product of total price and task completion time on our instance type. Policy AF(30) is better (lower product) than the others when the user’s bid is less than0.159,
but this metric is slightly higher for other bid ranges. We also observe that the performance gap between OPT and the other policies is about20 ∼ 30 percent.
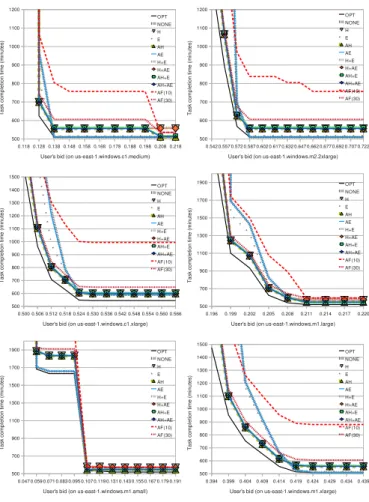
2) Evaluation on two us-east-1.windows instance types: We
have investigated two us-east-1.windows instance types as an alternative to the above eu-west-1.linux.m1.large study. Figures 10 and 11 show the corresponding results. The rising edge-driven checkpointing shows better performance than others while AF(10) and AF(30) show worse results in most of the range of user’s bids. This can happen when the movement of
Figure 9. Product of total price and task completion time on
eu-west-1.linux.m1.large instance type
spot price has a weaker relationship with the previous price changes. In other words, the adaptive decision mechanism may not perform well when the probability density function of failures significantly (and, unexpectedly) changes over time.
3) Mean price bidding: Table IV shows the normalized
product of the total price and the task completion time when a user bids the mean price based on the past price history. In this result, we observe that checkpointing policies affect the real price significantly. In particular, using the hour-boundary checkpointing can reduce significantly the cost compared with the edge-driven policies or without checkpointing policies on this instance type. Also, the cost of the adaptive fine-grained checkpointing depends on its sampling (decision) rate. Using a higher rate provides more available places to checkpoint, but it may not be efficient because the decision is not the optimal, and the decision requires overhead. This result shows that the checkpointing policies give results 30 ∼ 45 percent higher
than the optimal case. This means that finding a better strategy to take a checkpoint is still required to save more monetary costs. The detailed explanation of possible future approaches are discussed in Section V.
4) Delayed termination: Table V shows the price reduction
when using delayed termination introduced in Section II-E. This technique does not affect the task completion time but may reduce cost of the last partial-hour. For the long-term tasks the savings may be trivial; however shorter tasks (of a few hours or less) might benefit from it. The results shows that we can save almost0.01 ∼ 0.20 USD, depending on the
size of the instance types.
5) Policy comparison and result summary: Table VI shows
the best checkpointing policies for all 42 types of spot
instances. We observe that the hour-boundary checkpointing performs best for most cases, while AF(30) and the
rising-Figure 10. Total execution price on us-east-1.windows instance types
edge driven checkpointing perform well in a small fraction of the spot instance types. The policy combinations using rising edge-driven checkpointing (E, AE, and AH+AE) perform well only on Microsoft Windows-based spot instances while not performing so well on the Linux-based spot instances.
Summarizing, we observe that checkpointing can signif-icantly affect both the task completion time and the total price. We found that using hour-boundary checkpointing can reduce costs significantly in the presence of failures. But, we also found that the rising edge-driven checkpointing is better for some set of instance types. The results also show that delayed termination can reduce a small amount of monetary costs given our task’s size (which is 500 minutes), but this scheme may reduce significantly costs when running relatively short-term tasks. We also found that finding better placements of checkpoints is required to minimize the performance gap between the optimal and the other checkpointing policies.
IV. RELATEDWORK
We start with work related to Cloud Computing, including economics, management services, and fault-tolerant middle-ware. Several previous works focus on the economics of Cloud Computing [5], [6], [7], [8], [9]. However, these works assume a static pricing model for EC2’s dedicated on-demand
Table IV
NORMALIZED PRICE×TIME PRODUCT FOR EXECUTION ON THE MEAN PRICE BIDDING(NORMALIZED BYOPT)
eu-west-1.linux type NONE H E AH AE H+E H+AE AH+E AH+AE AF(10) AF(30) c1.medium 2.659 1.298 3.841 1.296 2.660 1.307 1.300 1.307 1.300 2.865 1.405 c1.xlarge 19.34 1.454 18.11 1.450 32.77 1.460 1.456 1.460 1.456 3.444 1.558 m1.large 6.826 1.408 4.261 1.405 5.147 1.420 1.417 1.420 1.417 3.275 1.428 m1.small 16.18 1.505 15.11 1.508 16.18 1.543 1.543 1.543 1.543 2.848 1.496 m1.xlarge 13.75 1.445 11.50 1.449 16.86 1.448 1.447 1.448 1.447 2.655 1.456 m2.2xlarge 2.894 1.462 2.900 1.462 2.897 1.465 1.464 1.459 1.464 2.690 1.428 m2.4xlarge 3.458 1.354 2.758 1.355 2.972 1.360 1.358 1.360 1.358 2.843 1.411 Table V
THE AMOUNT OF PRICE REDUCTION(INUSD)WHEN USING DELAYED TERMINATION(ON THE MEAN PRICE BIDDING)
eu-west-1.linux type OPT H E AH AE H+E H+AE AH+E AH+AE AF(10) AF(30) c1.medium 0.021 0.006 0.001 0.006 0.014 0.007 0.006 0.007 0.006 0.003 0.002 c1.xlarge 0.101 0.109 0.067 0.109 0.067 0.105 0.109 0.105 0.109 0.074 0.015 m1.large 0.019 0.029 0.032 0.029 0.043 0.025 0.025 0.025 0.025 0.028 0.008 m1.small 0.004 0.015 0.000 0.015 0.000 0.012 0.012 0.012 0.012 0.008 0.004 m1.xlarge 0.034 0.065 0.275 0.065 0.000 0.065 0.065 0.065 0.065 0.039 0.015 m2.2xlarge 0.033 0.093 0.006 0.093 0.006 0.093 0.093 0.093 0.093 0.049 0.049 m2.4xlarge 0.110 0.257 0.175 0.257 0.175 0.257 0.257 0.268 0.257 0.130 0.022 Table VI
BEST CHECKPOINTING POLICY FOR EACH SPOT INSTANCE TYPE INAMAZONEC2 (ON THE MEAN PRICE BIDDING,IN TERMS OF PRICE×TIME PRODUCT,
EXCEPT FOROPT)
Instance types c1.medium type c1.xlarge type m1.large type m1.small type m1.xlarge type m2.2xlarge type m2.4xlarge type eu-west-1.linux AH AH AH AF(30) H AF(30) H eu-west-1.windows AF(30) AF(30) AH AH H, AH H, AH AH+AE
us-east-1.linux H, AH H, AH AF(30) H H, AH H, AH AH us-east-1.windows AE H, AH H, AH AF(30) H AE E, AE
us-west-1.linux H, AH H, AH AF(30) AH H, AH H, AH AH us-west-1.windows H, AH AF(30) AH H, AH E E AH
instances. They evaluate the cost-benefit of Cloud Computing compared to self-built, dedicated infrastructures such as tra-ditional Grids or ISP’s. The authors focus on different types of applications including task parallel, message passing, and data-intensive applications.
Several services for monitoring and managing cloud ap-plications exist [10], [11], [12], but these services currently do not consider cloud costs that vary dynamically over time. For instance, RightScale [12] is a third party cloud computing broker that provides management services for clouds, such as EC2. They provide several software tools that reduce the complexity of managing and monitoring cloud computing resources. However, they still do not have any service for efficiently utilizing the spot instances on the Amazon EC2. Instead, the users of spot instances have to manage spot instance costs and reliability manually and individually.
Several middleware currently deployed over Clouds have fault-tolerance mechanisms [13], [14], [15], but these mecha-nisms currently are not cost-aware. For instance, Map-Reduce [13] and Condor [14] are intrinsically fault-tolerant, but how to conduct fault-tolerance in a cost-effective way has not been addressed. In particular, checkpointing has been well-studied, but previous studies have not taken into account variable resource costs. In [16], A. Duda studied the optimal placement of a checkpoint if the performance overhead is constant. In [3],
Yi et al. proposed an adaptive checkpointing scheme which provides adaptive taking point decision function when the cost of checkpointing changes over time. Their results apply under the assumption that failures occur according to the Poisson process. In contrast, we use the probability density function which is calculated from the previous traces of spot instances. There are several challenges related to checkpointing in context of unreliable resources such as spot instances. The first one is finding the relationship between past and future failures or availability for proactive checkpointing. Much work exists on finding correlations and dependence between failure events [17], [18], [19], [20]. Another challenge is using an efficient checkpointing method for minimizing the expected execution time in the presence of failures. This also has been the subject of previous work described in [16], [3], [21], [4], [22]. A new aspect is understanding the impact of checkpointing methods on the spot instances for reducing both the monetary costs and the task’s total execution time. This is the focus of this work.
V. CONCLUSIONS ANDFUTUREWORK
We proposed an approach to reduce monetary costs of computations using Amazon EC2’s spot instances for resource provisioning. Based on the price history given by Amazon, we simulated and compared several checkpointing schemes in terms of both price and task completion time. Our simulation
Figure 11. Task completion time on us-east-1.windows instance types
results show that using an appropriate checkpointing scheme can reduce significantly both the price and task completion time.
Our future work will include identifying correlation between past and current prices, between instance types, and between rising edges. We are also interested in developing robust pre-diction methods to minimize monetary costs and completion times under this schema. We will also investigate how to gather "hidden information" such as the amount of bids, the number of available resources, and the number of bidders in order to improve predictions.
ACKNOWLEDGMENTS
This work is carried out in part under the EC project eX-treemOS (FP6-033576) and the ANR project Clouds@home (ANR-09-JCJC-0056-01).
REPRODUCIBILITY OFRESULTS
All data used in this study, the full source code of the sim-ulator and additional results are available under the following URL:
http://spotckpt.sourceforge.net
REFERENCES
[1] Amazon EC2 Spot Instances, http://aws.amaz-on.com/ec2/spot-instances/, 2010.
[2] Amazon Simple Storage Service FAQs, http://a-ws.amazon.com/s3/faqs/, 2010.
[3] S. Yi, J. Heo, Y. Cho, and J. Hong, “Taking point decision mechanism for page-level incremental checkpointing based on cost analysis of pro-cess execution time,” Journal of Information Science and Engineering, vol. 23, no. 5, pp. 1325–1337, September 2007.
[4] ——, “Adaptive page-level incremental checkpointing based on expected recovery time,” in 2006 ACM Symposium on Applied Computing (ACM
SAC’06), April 2006, pp. 1472–1476.
[5] D. Kondo, B. Javadi, P. Malecot, F. Cappello, and D. P. Anderson, “Cost-benefit analysis of cloud computing versus desktop grids,” in
18th International Heterogeneity in Computing Workshop, Rome, Italy,
May 2009. [Online]. Available: http://mescal.imag.fr/membres/derrick. kondo/pubs/kondo_hcw09.pdf
[6] A. Andrzejak, D. Kondo, and D. P. Anderson, “Exploiting non-dedicated resources for cloud computing,” in 12th IEEE/IFIP Network Operations
& Management Symposium (NOMS 2010), Osaka, Japan, Apr 19–23
2010.
[7] M. Palankar, A. Iamnitchi, M. Ripeanu, and S. Garfinkel, “Amazon S3 for Science Grids: a Viable Solution?” in Data-Aware Distributed
Computing Workshop (DADC), 2008.
[8] S. Garfinkel, “Commodity grid computing with amazons s3 and ec2,” in login, 2007.
[9] E. Deelman, S. Gurmeet, M. Livny, J. Good, and B. Berriman, “The Cost of Doing Science in the Cloud: The Montage Example,” in Proc.
of Supercomputing’08, Austin, 2008.
[10] CloudStatus, http://www.cloudstatus.com/, 2010.
[11] CloudKick: Simple, powerful tools to manage and monitor cloud servers,
https://www.cloudkick.com/ , 2010.
[12] RightScale: Cloud Computing Management Platform,
http://www.rightscale.com/, 2010.
[13] J. Dean and S. Ghemawat, “Mapreduce: Simplified data processing on large clusters,” in OSDI, 2004, pp. 137–150.
[14] M. Litzkow, M. Livny, and M. Mutka, “Condor - A Hunter of Idle Workstations,” in Proceedings of the 8th International Conference of
Distributed Computing Systems (ICDCS), 1988.
[15] G. Bosilca, A. Bouteiller, F. Cappello, S. Djilali, G. Fedak, C. Germain, T. Herault, P. Lemarinier, O. Lodygensky, F. Magniette, V. Neri, and A. Selikhov, “MPICH-V: Toward a Scalable Fault Tolerant MPI for Volatile Nodes,” in Proceedings of SC’02, 2002.
[16] A. Duda, “The effects of checkpointing on program execution time,”
Information Processing Letters, vol. 16, no. 1, pp. 221–229, Jul. 1983.
[17] S. Fu and C.-Z. Xu, “Exploring event correlation for failure prediction in coalitions of clusters,” in SC’07: Proceedings of the 2007 ACM/IEEE
conference on Supercomputing. New York, NY, USA: ACM, 2007, pp.
1–12.
[18] B. Javadi, D. Kondo, J. Vincent, and D. Anderson, “Mining for availability models in large-scale distributed systems: A case study of seti@home,” in 17th IEEE/ACM International Symposium on Modelling,
Analysis and Simulation of Computer and Telecommunication Systems (MASCOTS), September 2009.
[19] D. Kondo, A. Andrzejak, and D. P. Anderson, “On correlated availability in internet distributed systems,” in IEEE/ACM International Conference
on Grid Computing (Grid), Tsukuba, Japan, 2008.
[20] A. Andrzejak, P. Domingues, and L. M. Silva, “Predicting machine availabilities in desktop pools,” in 10th IEEE/IFIP Network Operations
& Management Symposium (NOMS 2006), Vancouver, Canada, April
3–7 2006, pp. 1–4.
[21] J. S. Plank, K. Li, and M. A. Puening, “Diskless checkpointing,” IEEE
Transactions on Parallel and Distributed Systems, vol. 9, no. 10, pp.
972–986, October 1998.
[22] P. Domingues, A. Andrzejak, and L. M. Silva, “Using checkpointing to enhance turnaround time on institutional desktop grids,” in 2nd IEEE
International Conference on e-Science and Grid Computing (eScience 2006), Amsterdam, Netherlands, December 2006.