HAL Id: hal-00685193
https://hal.archives-ouvertes.fr/hal-00685193
Submitted on 4 Apr 2012
HAL is a multi-disciplinary open access
archive for the deposit and dissemination of
sci-entific research documents, whether they are
pub-lished or not. The documents may come from
teaching and research institutions in France or
abroad, or from public or private research centers.
L’archive ouverte pluridisciplinaire HAL, est
destinée au dépôt et à la diffusion de documents
scientifiques de niveau recherche, publiés ou non,
émanant des établissements d’enseignement et de
recherche français ou étrangers, des laboratoires
publics ou privés.
Attenuated total reflection - Infrared spectroscopy
applied to the study of mineral - aqueous electrolyte
solution interfaces: a general overview and a case study
Grégory Lefèvre, Tajana Preočanin, Johannes Lützenkirchen
To cite this version:
Grégory Lefèvre, Tajana Preočanin, Johannes Lützenkirchen. Attenuated total reflection - Infrared
spectroscopy applied to the study of mineral - aqueous electrolyte solution interfaces: a general
overview and a case study. Theophile Theophanides. Infrared Spectroscopy, Intech, 2012,
979-953-307-362-9. �hal-00685193�
Attenuated total reflection – Infrared
spectroscopy applied to the study of mineral –
aqueous electrolyte solution interfaces: a
general overview and a case study
Lefèvre Grégory
1, Preočanin Tajana
2, Lützenkirchen Johannes
31 Chimie ParisTech - LECIME - CNRS UMR 7575 - 11, Rue Pierre et Marie Curie, F-75231 Paris Cedex 05 (France)
2 Laboratory of Physical Chemistry, Department of Chemistry, Faculty of Science, University of Zagreb, Horvatovac 102a, HR-10000 Zagreb (Croatia)
3 Karlsruhe Institute of Technology (KIT), Institute for Nuclear Waste Disposal (INE), Postbox 3640, DE-76021 Karlsruhe (Germany)
1. Introduction
The present chapter gives an overview of the application of Attenuated total reflection – Infrared spectroscopy (ATR-IR) to the environmentally important mineral – aqueous electrolyte interface. At these interfaces the important adsorption processes occur that limit the availability of potentially toxic solutes. These retention processes may retard for example the migration of solutes in aquifer systems or even immobilize them on the aquifer material, which is usually a natural mineral. Selected solutes may also via a preliminary adsorption process, which weakens bonds, enhance both dissolution kinetics and the equilibrium solubility of a given mineral.
In the context of retardation (oxy)(hydr)oxide minerals are of major importance. At the surface of these minerals surface functional groups exist that are able to bind metal ions and organic ligands as well as they may promote the formation of so-called ternary surface complexes involving both metal ions and some ligand. To be able to quantify these retention phenomena in porous media (such as aquifers or soils) a physical model of solvent movement is coupled to a (chemical) adsorption model (usually some variant of the surface complexation approach). The intent in the chemical part of the model is to invoke as much understanding of the adsorption process as possible. Thus it turns out to be important whether an adsorption process results in monodentate or multidentate surface complexes. This can have profound consequences in the use of a surface complexation model under different conditions (Kulik et al., 2010; Kallay et al., 2011).
Evaluating a surface complexation model based on macroscopic adsorption data alone usually is not unambiguous. Consequently, it is required to study the adsorption process at the molecular level. Various spectroscopic approaches have been used to resolve the adsorption mechanism, one being ATR-IR.
We give an introduction to the approach and an overview of its possible applicability (and in this context its use in contributing to the understanding of the acid-base chemistry of (oxy)(hydr)oxide mineral surfaces, the adsorption of anions and cations like the uranyl-ion, and the formation of ternary surface complexes can be mentioned in general). Our contribution focuses on a review on the interaction of small organic molecules with oxidic surfaces and we highlight previous studies and point to some controversary issues in selected studies that continue to exist despite extensive research. Obviously such studies relate to other vibrational spectroscopies like Raman or sum frequency generation vibrational spectroscopies.
Finally we discuss results from an experimental study on the mineral gibbsite (Al(OH)3)
in the presence of 5-sulfosalicylic acid (5-SSA). We show how ideally such a study should be designed, starting from the study of the gibbsite-electrolyte solution system (i.e. in absence of 5-SSA) and that of 5-SSA in aqueous solution (i.e. in the absence of gibbsite). Furthermore, we show that it is necessary to study in aqueous solution the interaction of 5-SSA with dissolved aluminium, since the pH – dependent solubility of gibbsite will ultimately cause the appearance of aluminium ions in solution. The system involving gibbsite and 5-SSA is discussed in more detail. We relate the data to calculations of the species distribution for the solution systems, which indicate the dominant aqueous species thus facilitating the assignment of bands.
2. Review of use of ATR in studies about adsorption of selected small organic molecules
2.1. Principles of ATR
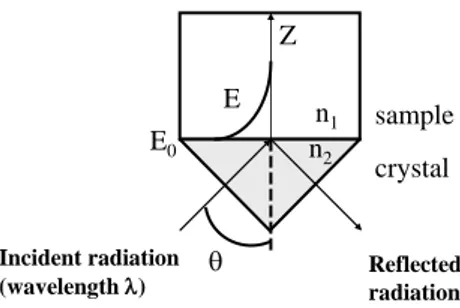
Attenuated Total Reflection effect is based on the existence of an evanescent wave in a medium of lower index of refraction in contact with an optically denser medium in which the infrared beam is sent. This evanescent field decays exponentially in the less dense medium according to equation (1).
)
Z
exp(
E
Z
)
n
(sin
2
exp
E
E
0 2 / 1 2 21 2 1 0
(1)where 1 = / n1 is the wavelength of the radiation in the denser medium, the
wavelength in free space, the angle of incidence with respect to the normal. The parameter n21 is defined as the ration of the refractive indices, i.e. n21 = n2 / n1, where n1
and n2 are respectively, the refractive indices of the optically denser and less dense
n1 n2 Z E sample crystal Incident radiation
(wavelength ) Reflectedradiation
E0
Fig. 1. Schematic diagram of the attenuated total reflection of the infrared beam in a monoreflection ATR accessory.
From the ATR element, the infrared beam probes only the first few micrometers of the sample medium. From equation (1), different parameters can be defined to characterize the depth of penetration. A first definition was the depth at which the electric field amplitude falls to half its value at the interface (Z = 0.69 / ). Another definition of the depth of penetration (dp) is given by Z = 1 / , i.e. a decay of the electric field of 63 %.
Moreover, this value is lower than the actual depth sampled (dS), which is about three
times dp (decay of the electric field of 95%) (Mirabella, 1993; Tickanen et al., 1991).
Equation (1) can be used to obtain the value of dp in a homogeneous solution, but the
determination of the penetration across oxy-hydroxide films is more complex. The depth of penetration, dp, is expressed as (Coates, 1993)):
2
1/2 21 2 1 psin
n
2
d
(2)or, with , the wavenumbers (cm-1):
2
1/2 21 2 1 psin
n
n
2
10000
d
(3)In studies on the adsorption of ions onto layers of particles deposited on ATR crystals, it is important that the whole layer be probed. Otherwise sorption which takes place in the top of the layer (i.e. further away from the crystal) does not significantly contribute to the observed signal. To take into account the presence of a layer of particles (pores filled with solution) formula (1) can be used with a volume-weighted average of the refractive index of the particle material and the aqueous solution (Hug and Sulzberger, 1994):
n2 = Fvnpar +(1-Fv)nwater (4)
where Fv is the volume fraction of solid and npar the refractive index of the pure solid. A
volume fraction between 0.30 and 0.40 was estimated for TiO2 (npar = 2.6), leading to a
maximum dp of 2.6 µm at 1100 cm-1. Thus, the actual depth sampled would be ca. 7 µm
2.2. Experimental
Using an accessory allowing to record infrared spectra in ATR mode is the first requirement to get in situ signals of the solid/solution interface. However, the way to prepare this interface and even the choice of the accessory is not straightforward.
2.2.1. Protocols to produce a suitable solid-liquid interface
The first step in ATR-related studies involves the formation of a suitable solid-liquid interface. To obtain a metal oxide / solution interface which can be probed by ATR, several methods have been described in literature.
The first one, described in the pioneering work by Tejedor-Tejedor and collaborators (Tejedor-Tejedor and Anderson, 1986; Tejedor-Tejedor and Anderson, 1990; Tickanen et al., 1991) consisted in a cylindrical internal reflection cell (a rod-shaped crystal of ZnSe) dipped in a suspension of 100 g/L goethite. This method is now less frequently used, to the advantage of horizontal ATR crystals. Using such instrumentation, Hug and Sulzberger (1994) have developed a method which has become standard. The approach consists in coating the ATR crystal by colloidal particles to form a film. As a typical protocol, a mixture of solid and ethanol is spread over the ATR crystal, then dried using a nitrogen flux. After drying, the layer is rinsed with water or with an electrolyte solution. More details are given in articles by Hug (1997) or Peak et al. (1999).
In another method, the equilibrium of the system solid/solution is reached by a classical batch experiment, using diluted suspensions of the solid. Then the suspensions are centrifuged to obtain a higher mass/volume ratio, for example 100-1000 g/L, or even a paste. The sample is then spread on the ATR crystal using a spatula (Villalobos and Leckie, 2001).
A final possibility is to use the surface of the crystal as the sample itself. Either the surface of the crystal is used as received, as ZnSe on which sodium dodecyl sulfate (Gao and Chorover, 2010) or Ge on which heptyl xanthate (Larsson et al., 2004) formed a monolayer, or the surface was chemically modified and is different from the bulk. Thus, Asay and Kim (2005) studied the adsorption of water molecules on the native layer of silica present on a silicium ATR crystal, or Wang et al. (2006) studied the adsorption of hexane and ethylbenzene from the vapor phase on a layer of zeolite grown directly on the surface of a silicium ATR crystal. Frederiksson and Holmgren (2008) have formed a PbS film on a ZnS ATR crystal by a chemical bath deposition process in order to study the adsorption of heptyl xanthate. In these latter studies, the system is very close to a film obtained by drying of a suspension, but the optical properties are expected to be better. Couzis and Gulari (1993) have deposited 600 Å of alumina by sputtering on a ZnSe crystal.
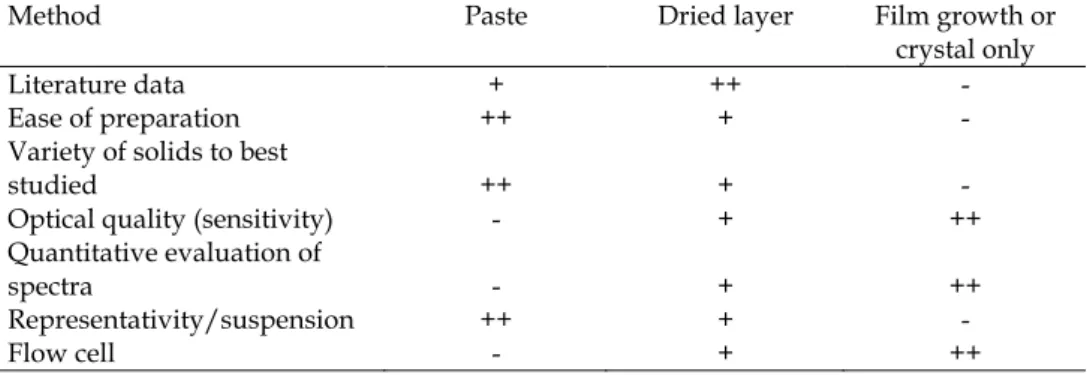
The advantages and drawbacks of the three methods to prepare the solid/solution interface discussed above are listed in table 1. As of today, the most common method is to prepare a dry layer, even though it is simpler to use a paste. However, using a paste has a major drawback since the contact between particles and the ATR crystal is not optimal, the sensitivity is low and depends on the suspension structure (which in general is pH-dependent). On the other hand, using the results obtained with a dry layer to interpret macroscopic data obtained in well-dispersed suspensions can be tricky, since effects due to the confinement of the solutions are ignored. The last advantage of using a film is the possibility to perform experiments with a flow cell. This set-up allows
recording spectra, while varying the composition of the solution, e.g. by modifying pH, or the concentration of adsorbing species.
Method Paste Dried layer Film growth or crystal only
Literature data + ++ -
Ease of preparation ++ + - Variety of solids to best
studied ++ + -
Optical quality (sensitivity) - + ++ Quantitative evaluation of
spectra - + ++
Representativity/suspension ++ + -
Flow cell - + ++
Table 1. Summary of characteristics of the three methods of preparation of the solid/solution interface probed by ATR-IR: (++) strong advantage, (+) advantage, (-) drawback.
2.2.2. Limitations in the wavenumber range
Once the procedure to prepare the interface has been chosen, the wavenumber range covered by the measurement is another important experimental aspect. Indeed, a number of interferences may occur between bands of adsorbed species and the experimental set-up.
The main limitation may arise from the ATR element itself. Each material has a transmission threshold, which may be located at a high wavenumber, such as silicium. Other materials with a low transmission threshold may be too reactive towards solutions. Thus, ZnSe can be attacked by acid or zinc-complexing species. A usual choice made by ATR-elements-dealers is an element made in ZnSe, but covered by a thin layer of diamond to increase its chemical resistance. This possibility exists only for small ATR crystals, allowing only few reflections of the infrared beam. To increase sensitivity, large ATR crystals are used. For example 40 mm × 10 mm crystals with a thickness of around 1 mm allow dozens of reflections. Such crystals usually consist of a pure material. Besides the above limitations due to the ATR element, two gases present in the ambient
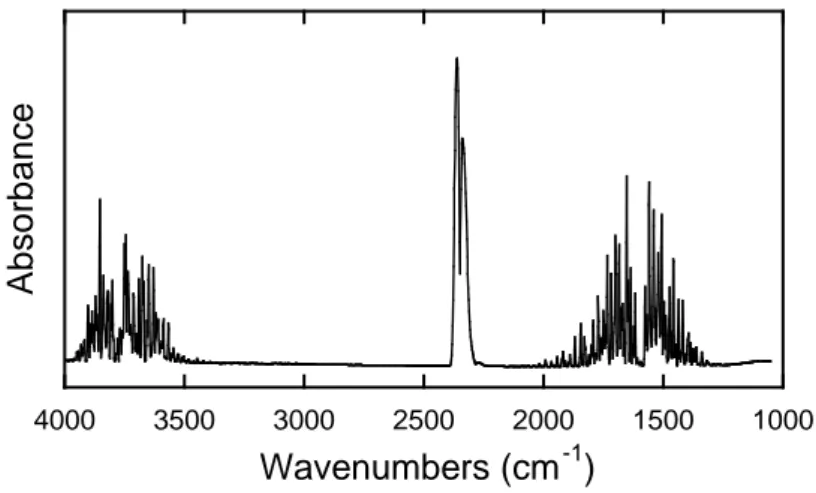
atmosphere lead to absorption bands in IR spectra: carbon dioxide, and water. The main
bands (Fig. 2) consist in a doublet at 2361 and 2339 cm-1 (CO2), and numerous narrow
peaks in the range 2000 – 1300 (H2O bending) and 4000 – 3400 (H2O stretching).
Generally, the band of CO2 does not interfere with bands of adsorbates, but H2O
bending can interfere with adsorbed organic molecules. Several methods exist to solve this problem. In fact, the presence of CO2 and water in the atmosphere of the
spectrometer is not the actual problem since it is taken into account in the background spectrum. It is rather the evolution of their concentrations (or partial pressures) during the subsequent spectra collection that leads to the presence of bands, which varies with time. The less concentrated these gases are, the lower are the bands, since the signal comes from the fluctuation of the partial pressures. Thus, some spectrometers are
evacuated to enhance sensitivity and stability. Other spectrometers are purged with inert gas or with compressed dried air. Another possible solution to the problem consists in the use of spectrometers which are sealed and equipped with desiccant powder. In all cases, if bands of atmospheric compounds remain, they can be tentatively removed by subtracting the atmosphere spectra.
1000 1500 2000 2500 3000 3500 4000
Absor
b
ance
Wavenumbers (cm
-1)
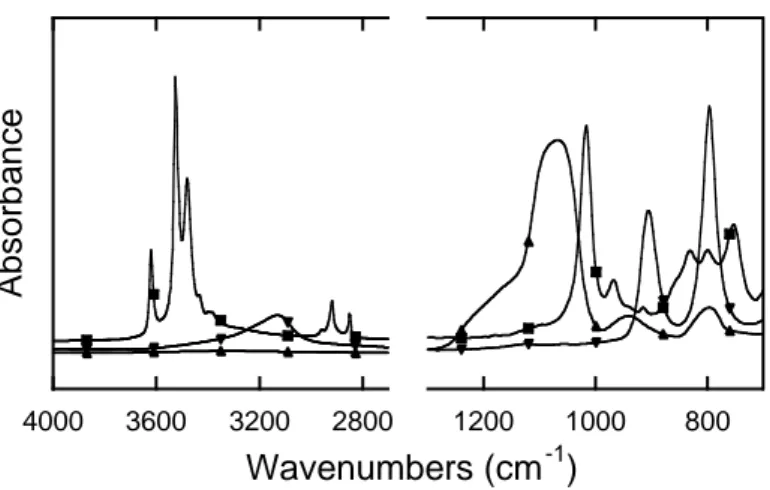
Fig 2. Spectrum of the atmosphere showing the contributions as discussed in the text. Since the studies generally consist in probing the species adsorbed on a solid deposited on the ATR crystal, it is important to take into account bands from the solid itself. For metal oxides, the absorption bands are generally located at low wavenumbers, which does not cause interferences with adsorbed species. Exceptions exist with light metals as SiO2 (around 1060 cm-1). For metal hydroxides, stretching of M-OH can lead to the
presence of bands above 800 cm-1 as is the case with goethite (900 and 800 cm-1) or
gibbsite (around 1000 cm-1).
Ideally, if the layer formed by particles is stable, the signal coming from the solid can be subtracted from the final spectra, and the presence of these bands does not hamper the detection and interpretation of bands from adsorbed species. However, in practice subtraction is often difficult due to the evolution of the signal of the solid with time or solution composition. Phenomena such as re-entrainment of particles by flowing solution, or swelling/shrinkage due to the change in surface potential can explain this problem.
2800 3200 3600 4000 1200 1000 800
Wavenumbers (cm
-1)
Absor
b
ance
Fig 3. Spectra of solids as dried layer on an ATR element: silica (), gibbsite (), goethite ()
Water is the most common solvent in environmental studies and its absorption bands can be a problem too. Stretching of H2O occurs around 3000-3600 cm-1 and interferes
with stretching of surface hydroxyl groups. Bending takes place at 1643 cm-1
(Venyaminov and Prendergast, 1997), close to the stretching of C=O groups (see below). This can complicate the accurate measurement of C=O maxima. Finally, water absorption
is very strong below ca. 900 cm-1, and this can prevent the measurement of any bands in
the lowest wavenumber range. In fact the actual threshold appears to depend on the number of reflections in the ATR system. For a monoreflection accessory, a measurement can be made down to 650 cm-1 without large absorption of H2O, while for a 25-reflection
crystal, the signal becomes noisy below 890 cm-1 (Lefèvre et al., 2006). To be able to
record spectra at lower wavenumbers, heavy water (D2O) can be used because the
absorption bands are shifted by a factor of ca. 1.4 to lower wavenumbers. Thus, a good signal can be obtained for bands located between 850 and 950 cm-1 (Lefèvre et al., 2008)
using the same 25-reflection crystal. It can be useful to avoid interferences with bands around 1650 cm-1 since D2O bending is located at 1209 cm-1 (Venyaminov and
Prendergast, 1997).
2.3. Review of adsorption of carboxylic acids onto metal (hydr)oxides by ATR-IR 2.3.1. Monoacids: formic, acetic, benzoic, lauric
A number of monoacids are discussed in the context of this review. Table 2 gives some information on the monoacids both in solution and at the interface. The systems are discussed in detail in the remainder of the section.
Acid pKa R COO (cm-1) in solution COO (cm-1) adsorbed Formic 3.75 * –H 230 192 (TiO2) Acetic 4.76 * –CH3 137 90 (TiO2) Benzoic 4.19 * –C6H5 154 109 (TiO2) 117 (Ta2O5) 122 (goethite) 141 (ZrO2) Lauric 4.90 ** –CH2–(CH2)9–CH3 136 185 (alumina)
from *Lide (1998), ** Dean (1999)
Table 2. Characteristics of carboxylic acid (R-C(O)OH). COO=as(COO)- s(COO)
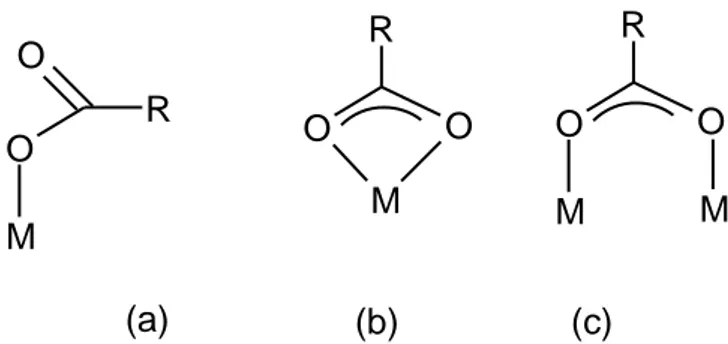
Several surface complexes can be formed with monoacids, such as monodentate, or bidentates (Fig. 4). Monodentate surface complexes can be distinguished from bidentates based on the occurrence or not of the free C=O group band, with a stretching frequency at about 1700 cm-1.
M
O
O
R
M
O
O
R
M
M
O
R
O
(a)
(b)
(c)
Fig. 4. Surface complexes between a monoacid and a metal oxide: (a) monodentate, (b) mononuclear bidentate and (c) binuclear bidentate
The ATR-FTIR spectrum of 1M of formate ion is characterized by bands located at 1350, 1383 and 1580 cm-1, assigned to s(COO), (HCO) and as(COO), respectively (Rotzinger
et al., 2004). Spectra of formate adsorbed on TiO2 at pH 5.0, up to 30 mM display the
presence of bands of formate ions and a new peak at 1540 cm-1, assigned to as(COO) of
species interacting with the surface. Spectra in D2O confirmed this assignment since only
a small shift (8 cm-1) of this band was observed, which precludes the vibration of a
protonated/deuterated species. A decrease of pH from 9 to 3 leads to the decrease of the peak area. A series of experiments where the adsorption of formic acid as a gas has been studied have shown the presence of bands of formic acid, formate, and a peak at ca. 1540 cm-1. In support of this, molecular calculations have been performed for the three
hypothetical surface complexes (Fig. 4), leading to calculated frequencies. Calculations on the stability of the surface complexes were found to support the binuclear bidentate coordination.
Sorption of acetate ions has been studied by ATR on rutile (Rotzinger et al., 2004) and several other minerals (Kubicki et al., 1999). In solution, the acetate ion is characterized
by bands at 1348-1349, 1415-1422 and 1552-1555 cm-1 (Rotzinger et al., 2004; Kubicki et
al., 1999) assigned to (CH3), s(COO), and as(COO), respectively. Acetic acid is
characterized by bands at 1279-1283, 1370-1371, 1392-1397(CH3), 1642-1650 and
1711-1717 (C=O) (Rotzinger et al., 2004; Kubicki et al., 1999). Spectra of adsorbed species have
been recorded at pH 5.0 (ca. 1:1 mixtures of the acetate ion and acetic acid in solution since pH is close to pKa), and at total acetate concentrations up to 25 mM on TiO2
(Rotzinger et al., 2004), and at pH 3 and 6 in the presence of 2 M acetate on quartz, albite, illite, kaolinite and montmorillonite (Kubicki et al., 1999). On TiO2, bands of acetate are
present with a new band at 1512 cm-1 assigned to as(COO) shifted due to the adsorption.
The absence of a band at ca. 1700 cm-1 indicates that the C=O group is not present in the
surface species. On several minerals (Kubicki et al., 1999), spectra recorded at pH 3 and pH 6 are similar to spectra of solution species. With acetic acid adsorbed on quartz, two bands are seen around 1710 cm-1 (at 1709 and 1732), suggesting two different bonding
environments. For the other minerals, the authors conclude that chemisorption is below the detection limit of the spectroscopy. This might be due to the low specific surface area of the minerals used in the study.
Adsorption of benzoic acid on minerals was studied by several authors on quartz, albite, illite, kaolinite and montmorillonite (Kubicki et al., 1999), goethite (Tejedor-Tejedor et al., 1990), TiO2 (Tunesi and Anderson, 1992; Dobson and McQuillan, 1999), as well as Al2O3,
ZrO2 and Ta2O5 (Dobson and McQuillan, 1999). Aqueous benzoate is characterized by
bands at 1542 cm-1 (as(COO)), 1388 cm-1 (s(COO)) and 1593 cm-1 (C=C). At pH < pKa,
spectra are characterized by bands at 1705 cm-1 (C=O), 1319 cm-1 (COH), 1279 cm-1 (COH),
and bands associated with C=C and C-H vibrations (1603, 1494, 1452, 1178, 1073 and 1026 cm-1). Benzoic acid adsorbed on quartz displays bands of the aqueous species with
two new peaks (at 1604 and 1569 cm-1). The lower frequency was found by calculation to
correspond to a monodentate complex, and the higher one to an outer-sphere complex. On albite at pH 3, no peaks above 1700 cm-1 were observed, indicating that the C=O
group is absent from the surface complex even in the pH range where the acid species predominates over the benzoate anion. This result is a direct evidence of the formation of a bidentate complex, stable over a wide range of pH. On goethite at pD 3.9 (Tejedor-Tejedor et al., 1990) and on TiO2 at pH 3.6 (Tunesi and Anderson, 1992), the C=O mode is
also absent. Another interesting point is that the asymmetric / symmetric carboxylate group stretching ratio decreases when benzoate interacts with Fe(III), which can be explained by the increase of co-planarity between the benzene ring and the as(COO).
These observations are consistent with the formation of a bidentate complex. c.f. Fig. 5 (Tejedor-Tejedor et al., 1990).
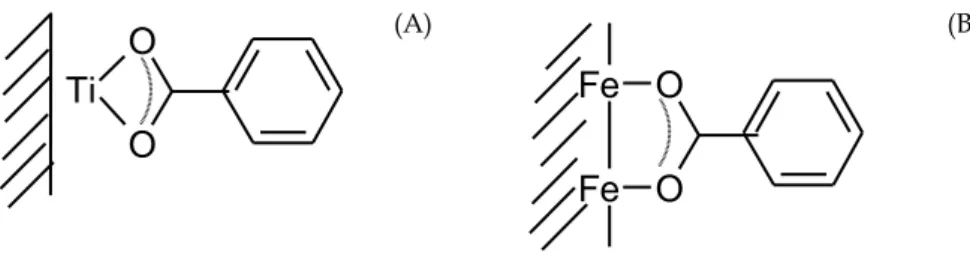
On TiO2, the difference between as(COO) et s(COO) for the adsorbed species is lower
by 45 cm-1 compared to the corresponding difference for the solute species. It is believed
that a lower value is indicative of a bidentate complex, and that such a large value indicates a chelate structure with a single centre (Fig. 5) (Tunesi and Anderson, 1992). On goethite, the difference was lower by 32 cm-1, consistent with a bridging complex (Tunesi
Ti
O
O
(A)O
O
Fe
Fe
(B)Fig. 5. Proposed surface complexes of benzoate on (A) TiO2 and (B) goethite.
The bands pertaining to as(COO) and s(COO) modes of laurate in solution are located
at 1547 and 1411 cm-1, respectively. Between 2850 and 3000 cm-1, several bands are
reported corresponding to hydrocarbon stretching. Laurate anions were adsorbed onto alumina, which had been deposited on the ATR element by a sputtering technique the thickness of the film being 600 Å (Couzis and Gulari, 1993). The recorded spectra depended on contact time and pH. At pH 8, up to 20 minutes after initiation of the solid-liquid contact, the observed peaks mainly corresponded to the solute species and the authors inferred the presence of an outer-sphere surface complex, since the surface is positively charged at this pH. For longer times of exposure, a new band appeared at 1597, along with the increase of the band at 1412 cm-1. This new band was assigned to
as(COO) of the adsorbed species. The difference between as(COO) and s(COO) for the
surface species was higher than the value obtained for the solute species. This behaviour, contrary to that observed for carboxylic acids with a shorter alkyl chain (Table 3) has been interpreted as a different, i.e. monodentate, surface coordination. From the evolution of the spectra recorded in the hydrocarbon stretching range (2750 – 3000 cm-1),
a chain-chain interaction is inferred after adsorption of laurate for short contact times, suggesting the association of the aliphatic chains at low surface coverage. For longer contact times, corresponding to a higher surface coverage, the chain-chain interactions become negligible.
2.3.2. Saturated and unsaturated diacids
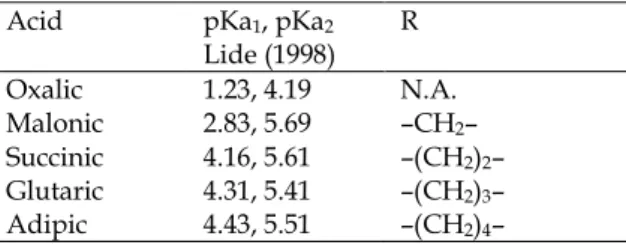
This section in a similar way as the previous one summarizes a number of studies on the adsorption saturated and unsaturated diacids to (oxy)(hydr)oxide minerals. The chemical speciation (in terms of the number of species in solution) becomes more complex for these compounds, which concomitantly enhances the possibilities of the diacids to form surface complexes of different stoichiometries in terms of bonding and proton balances. The diacids addressed are summarized in tables 3 (saturated diacids) and 4 (unsaturated diacids). The remainder of the section discusses in some detail published findings from ATR-FTIR spectroscopy.
Acid pKa1, pKa2 Lide (1998) R Oxalic 1.23, 4.19 N.A. Malonic 2.83, 5.69 –CH2– Succinic 4.16, 5.61 –(CH2)2– Glutaric 4.31, 5.41 –(CH2)3– Adipic 4.43, 5.51 –(CH2)4–
Table 3. Characteristics of dicarbocylic acids (HO(O)C–R–C(O)OH).
Acid pKa1, pKa2
fom Lide (1998) Formula trans-Fumaric 3.03, 4.44 O O OH O H Maleic 1.83, 6.07 OH O O OH o-Phtalic 2.89, 5.51 OH OH O O
Table 4. Characteristics of unsaturated dicarbocylic acids.
Oxalic acid is the simplest polyacid molecule (COOH)2 and its adsorption is the most
common subject of study by ATR-IR on oxy-hydroxides of aluminum (Axe and Persson, 2001; Johnson et al., 2004; Rosenqvist et al., 2003; Yoon et al., 2004; Dobson and McQuillan, 1999), iron (Borda et al., 2003; Duckworth and Martin, 2001; Persson and Axe, 2001), chromium (Degenhardt and McQuillan, 1999; Garcia Rodenas et al., 1997), titanium (Hug and Sulzberger, 1994; Weisz et al., 2001; Weisz et al., 2002; Dobson and McQuillan, 1999), silicon (Kubicki et al., 1999), tantalum (Dobson and McQuillan, 1999) and zirconium (Dobson and McQuillan, 1999). The spectra of species in solution, i.e. (COOH)2, HOOCCOO- and (COO-)2 were reported in several studies. The oxalate ion is
characterized by two peaks at 1307 and 1571 cm-1, respectively, which are assigned to
as(COO) and s(COO) modes. The spectrum of the oxalic acid species in solution is
dominated by C=O stretching at 1735 cm-1 and C-OH stretching at 1227 cm-1. These
features of oxalate and oxalic acid are consistent with theoretical frequency calculations (Axe and Persson, 2001). The spectra of hydrogen oxalate shows three peaks assigned to C=O stretching (1725 cm-1), as(COO) (1620 cm-1), and C-OH stretching (1240 cm-1)
(Degenhardt and McQuillan, 1999).
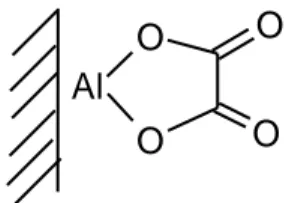
Sorption of oxalate on boehmite was studied as a function of oxalate concentration and pH (Axe and Persson, 2001). Two different complexes were identified: an outer-sphere complex characterized by a spectrum similar to that of dissolved oxalate (two bands at 1577 and 1308 cm-1), and an inner-sphere complex. The assignment of this latter was
based on the comparison of the spectra of the boehmite surface after sorption of oxalate (characterized by strong bands at 1722, 1702, 1413, 1288 cm-1) with the spectra of
dissolved [Al(Ox)(H2O)4]+ (1725, 1706, 1412, 1281 cm-1). The very close resemblance
suggests a mononuclear five-membered chelate geometry. The possibility of a symmetric bridging coordination to two equivalent Al(III) ions was ruled out by Raman spectra of the surface species. Indeed, the comparison of Raman spectra of [Al(Ox)(H2O)4]+ with
theoretical frequency calculations have indicated that the intensity of Raman bands can be used to distinguish a ring chelate from a bridging structure.
Al
O
O
O
O
Fig. 6. Ring chelate of oxalate on alumina (Axe and Persson, 2001)
This interpretation has been supported by a study of oxalate sorption on corundum modelled by the CD-MUSIC model involving ATR-IR spectroscopy (Johnson et al., 2004). A mononuclear bidentate complex was found up to 14 µmol/m2, whereupon
oxalate additionally adsorbed as an outer-sphere complex. Sorption of oxalate has also been studied on boehmite and corundum by Yoon et al. (2004) The peaks assigned to the inner-sphere complex in previous works (near 1286, 1418, 1700 and 1720 cm-1) were
claimed to arise from the presence of several species. Evidence for this phenomenon comes from the observation that peaks at 1286 and 1418 cm-1 are shifted to 1297 and 1408
cm-1 as the oxalate surface coverage increases. The authors finally postulated the
existence of two species: species “A” at 1286 and 1418 cm-1, and species “B” at 1297 and
1408 cm-1, respectively, which were assigned to an inner-sphere surface complex on
boehmite and to dissolved oxalate coordinated to aqueous Al(III). This assumption is supported by oxalate promoted dissolution of the aluminum oxy-hydroxide arising from the complexation reactions of dissolved Al(III) cations. Quantum calculations of infrared vibrational frequencies of possible surface complexes were carried out on aluminium oxide clusters (Al18O12 and Al14O22) including monodentate, bidentates with 4- and
5-membered ring, and bridging bidentates. They showed that the bidentate 5-5-membered ring most closely matched the experimental observations (within 15 cm-1), while the
simulation results for the other models showed deviations between 17 and 102 cm-1.
On hematite (Duckworth and Martin, 2001), the spectra of sorbed oxalate are similar to the above discussed surface complex on an aluminum oxy-hydroxide and consequently a 5-member bidentate complex was proposed. The effect of pH on the sorption of oxalate on goethite has also been studied (Persson and Axe, 2001). An outer-sphere surface complex and a 5-member ring inner-sphere surface complex were inferred from spectra of the goethite/oxalate system and the aqueous Fe(III)-oxalate complex. At low pH, the presence of outer-sphere surface complexes (COOH)2 was ruled out because of the
absence of a band corresponding to these species in aqueous solutions (around 1735 and 1233 cm-1).
Oxalate sorption on chromium oxide (Degenhardt and McQuillan, 1999) is characterized by bands at 1708, 1680, 1405 and 1269 cm-1, which was interpreted as a side-on surface
complex (both carboxylic groups interact with the surface), but without distinguishing between a 5- or a 7-member ring. An additional weakly bound oxalate ion was detected (bands at 1620-1580 and around 1306 cm-1). The absence of absorption at 1725 cm-1
(corresponding to C=O group) eliminates the singly protonated oxalate species. However, an upward shift of as(COO) is observed (from 1571 cm-1 in Ox2-), suggesting
hydrogen bonding with the surface. On chromium oxide (Garcia Rodenas et al., 1997), spectra were recorded after exposure to 0.1 M oxalate solution at pH 3.6 followed by washing with pure water. The resulting spectra were compared to the spectra of Cr(Ox)33- species in solution. As in the work by Degenhardt and McQuillan (1999), an
inner-sphere surface complex was inferred from the bands at 1710, 1680, 1410 and 1260 cm-1. The remaining shoulder at 1620 cm-1 and the peak at 1310 cm-1 were attributed to
uncoordinated oxalate ions. Since the solid has been washed after contacting with oxalate solution, the solute species are expected to be removed, and these data could be reinterpreted as a species involving hydrogen bonding.
Oxalate sorption onto TiO2 was amongst the first in situ adsorption studies involving
ATR-IR spectroscopy at the solid/solution interface (Hug and Sulzberger, 1994). Hug and Sulzberger (1994) have focused their study on the measurement of adsorbed oxalate to plot an isotherm curve. The isotherm at constant pH (3) was fitted by three Langmuir components, correlated with the three possible solute species (H2Ox/HOx-/Ox2-). Weisz
et al. (2001, 2002) have used the same protocol, and have measured three Langmuir stability constants. Dobson and McQuillan (1999) have recorded the spectra of Na2[TiO(Ox)2]2.3H2O(S), where the oxalate ion forms a µ2-oxo bridged Ti dimeric
complex. Its spectrum is close to those obtained with oxalate adsorbed onto TiO2 and the
comparison would lead to the interpretation of the spectroscopic results in terms of a bidentate-bridging surface complex. However, this interpretation disagrees with observations by Scott et al. (1973) who have shown on oxalato-Co(III) complexes that bidentate-chelating and bidentate-bridging oxalato ligands are characterized by nearly identical spectra.
ATR-FTIR studies of the sorption of other saturated diacids HO(O)C-(CH2)n-C(O)OH
with n=1 to 4 have been reported, as malonic (Dobson and McQuillan, 1999; Dolamic and Bürgi, 2006; Duckworth and Martin, 2001; Rosenqvist et al., 2003), succinic (Dobson and McQuillan, 1999; Duckworth and Martin, 2001), glutaric (Duckworth and Martin, 2001) and adipic (Dobson and McQuillan, 1999; Duckworth and Martin, 2001) acids. In solution, the dicarboxylate ions are characterized by as(CO2) around 1560-1550 cm-1 and
s(CO2) around 1410-1350 cm-1 (Dobson and McQuillan, 1999). The value of as(CO2) is
close for all values of n (and equal to frequency in oxalate), but s(CO2) increases with n,
from ca. 1360 cm-1 (1310 cm-1 in oxalate) to 1400 cm-1. Dicarboxylic acids are
characterized by (C=O) at 1718 cm-1 (malonic) and (C-O) at 1328 cm-1 (malonic). The –
CH2– bending frequencies are located at 1410-1440 cm-1 and 1300-1250 cm-1. Malonate
adsorbed on hematite at pH 5 is characterized by peaks at 1260 ((-CH2-)), 1349 (s(CO2)),
1439 ((-CH2-)) and 1631 ((C=O)) cm-1. s(CO2) remains at 1349 cm-1 without shift. In
comparison with solution spectra, the intensity of –CH2- bending is enhanced, and the
CO2 asymmetric stretching is replaced by (C=O) (70 cm-1 higher). Such an assignment is
The –CH2- bending band enhancement indicates a change of the dipole moment, which
may be an indication of a strained surface structure with increased bond angles (Dobson and McQuillan, 1999). On other metallic oxides, as TiO2 (Dobson and McQuillan, 1999;
Dolamic and Bürgi, 2006), ZrO2 (Dobson and McQuillan, 1999), Al2O3 (Dobson and
McQuillan, 1999; Rosenqvist et al., 2003) and Ta2O5 (Dobson and McQuillan, 1999), the
spectra of sorbed malonate species are similar: (-CH2-) at 1430-1450 and 1270-1280 cm-1,
(C=O) at 1580-1600 cm-1, and unshifted s(CO2) at 1360-1380 cm-1. On gibbsite
(Rosenqvist et al., 2003), the study of the evolution of the spectra with pH has shown two independent species: an inner-sphere complex (corresponding to a peak at 1438 cm-1)
and an outer-sphere complex (corresponding to the unshifted s(CO2)). Since the other
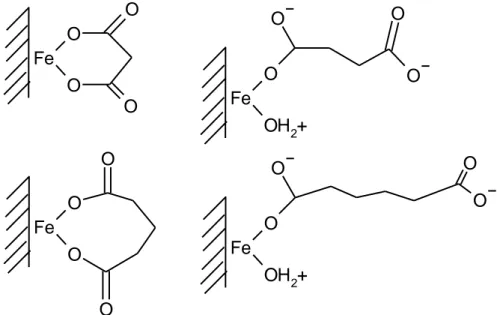
authors (Dobson and McQuillan, 1999; Dolamic and Bürgi, 2006; Duckworth and Martin, 2001) have not studied the effect of pH, it is not possible to rule out the presence of an outer-sphere complex in their studies, even if they have not mentioned this possibility. Duckworth and Martin (2001) and Dobson and McQuillan (1999) have studied the effect of longer carbon chains on the adsorption of dicarboxylic acids. Dobson and McQuillan (1999) found surface structures similar to malonate (bridging bidentate via a loop) consistent with greater molecular flexibility. On the contrary, Duckworth and Martin (2001) have found either a bridging bidentate via a loop for malonate and glutarate, or a monodentate complex for succinate and adipate. This interpretation is supported by the behaviour of these ions in dissolution of hematite: oxalate, malonate and glutarate promote the dissolution whereas succinate and adipate show less of an effect. However, the spectral evidence for this difference in the geometry of complexes is the presence of a peak at 1550-1540 cm-1, i.e. at a similar location as (as(CO2)) of the solution species,
whereas this stretching mode was absent in malonate and glutarate surface species.
Fe
O
O
O
O
O
Fe
O
OH
2+
O
O
Fe
O
O
O
O
O
Fe
O
OH
2+
O
O
Fig. 7. Proposed structures of diacids adsorbed on hematite (Duckworth and Martin, 2001)
Three unsaturated dicarboxylic acids have been studied by ATR: fumaric (Dobson and McQuillan, 1999; Rosenqvist et al., 2003), maleic (Dobson and McQuillan, 1999; Borda et al., 2003; Rosenqvist et al., 2003, Johnson et al., 2004), (respectively trans- and cis- butendioic acids), and phtalic (Boily et al., 2000; Dobson and McQuillan, 1999; Hwang et al., 2007; Klug and Forsling, 1999; Kubicki et al., 1999; Nordin et al., 1997; Rosenqvist et al., 2003; Tunesi and Anderson, 1992) acid. On gibbsite, the spectra of these three species after sorption are very similar to spectra of the carboxylate ion in solution. Consequently, Rosenqvist et al. (2003) have concluded that an outer-sphere complex was formed. On Al2O3, the same behaviour was shown for maleate and fumarate (Dobson
and McQuillan, 1999). On corundum, high resolution spectra of the adsorbed maleate ion were recorded (Johnson et al., 2004), and only small differences between bands of dissolved and adsorbed species have been detected, supporting outer-sphere complexation. For phtalate, inner-sphere and outer-sphere complexes were found on ferric oxy-hydroxides (Boily et al., 2000; Hwang et al., 2007).
3. Adsorption of 5-sulfosalicylic acid onto gibbsite
3.1. Introduction
The system 5-sulfosalicylic acid (5-SSA)/gibbsite is part of a broader study involving Cm adsorption onto gibbsite (Huittinen et al., 2009). Interaction of dissolved Cm with 5-SSA (Panak, 1996) and acid-base equilibria of gibbsite (Adekola et al., 2011) have been studied separately. Gibbsite as used in this study has a platelike morphology. Most of its surface relates to the basal plane. A very complex issue is the interfacial behaviour of the bare gibbsite. While the basal plane from a conventional point of view is considered quite inert, there are a number of indications that rather show that the basal plane can be quite reactive (Rosenquist et al., 2002; Gan and Franks, 2006). The present view is that a number of effects can be of importance, such as the precise conditions for the preparation of the gibbsite particles. This has been further studied by mimicking the basal plane by individual single crystals of sapphire, which are structurally very similar to the ideal basal plane of gibbsite (Lützenkirchen et al., 2010). Here we present some results on the interaction of 5-SSA with the gibbsite particles used in the Cm adsorption and basic charging studies mentioned above to lay a foundation to the study of the ternary Cm-SSA-gibbsite system.
Adsorption of 5-SSA to related minerals (i.e. alumina) has been previously studied previously by Jiang et al. (2002) by both a set of electrokinetic data and batch adsorption. Furthermore they reported IR data which they interpreted in terms of 5-SSA forming a bidentate surface complex involving the carboxylate group and the phenol group.
3.2. Experimental
3.2.1. Chemicals
The gibbsite particles were synthesized by the following procedure: 1 mol.dm–3
value of about 4.6. Dialysis was carried out at 70 °C during four months, with initially one change of water per day. Subsequently, water was changed two to three times a week. The gibbsite was stored as a suspension at a concentration of 41.9 g.dm–3. The
radius of the particles was determined by several methods, including AFM and field flow fractionation yielding an average width of the platelets of about 200 nm and a thickness of about 10 nm.
The suspension and solution were prepared with de-ionized water (conductivity > 18.2 MΩ cm). All solutions and suspensions were prepared in plastic containers. The following chemical reagents were used: NaCl (p.a., Merck), HCl (0.1 mol.dm–3, titrival,
Merck), NaOH (0.1 mol.dm–3, titrival, Merck), 5-sulfosalicylic acid (5-Sulfosalicylic
acid.2H2O, Sigma Aldrich), AlCl3.6H2O (Merck p.a.), standard buffers (pH = 3, 5, 7, 9 and
11).
Speciation of 5-SSA in solution results in four species. The occurrence of these species depends on pH (Fig. 8). OH SO3H COOH OH SO3 -COOH OH SO3 - CO O-SO3 -
COO-pKa1 = 1.52 pKa2 = 2.32 pKa3 = 11.30 Figure 8. Equilibrium constants for the deprotonation of 5-SSA (Panak, 1996).
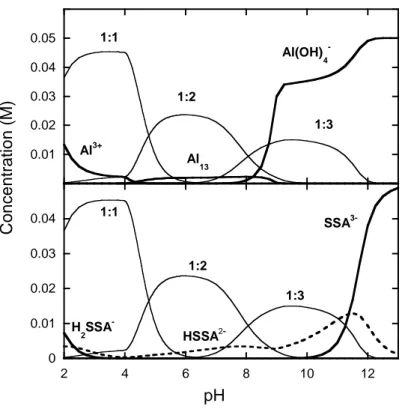
In presence of aluminium ions, a number of Al(5-SSA)x species (with x=1 to 3) can be
formed. The speciation of 5-SSA and Al as a function of pH for 510-2 mol.dm-3 of each
component is plotted in Fig. 9. The relevant Al-species are shown in the upper part, indicating that Al is preferably bound to 5-SSA up to pH 8. Above pH 8, the tetra-hydroxo species of aluminium dominates the speciation under the given conditions. The lower part of Figure 9 shows the distribution of 5-SSA for the equimolar solution. 5-SSA is predominantly bound in Al-complexes up to pH 11.
0 0.01 0.02 0.03 0.04 0.05 2 4 6 8 10 12
pH
1:1 1:2 1:3 SSA 3-HSSA 2-H 2SSA-Conce
ntrati
o
n (M)
0 0.01 0.02 0.03 0.04 0.05 0.06 Al3+ Al 13 Al(OH) 4 -1:1 1:2 1:3Fig. 9. Calculated speciation for an equimolar solution (510-2 M) of Al(III) (top) and
5-SSA (bottom). Uncomplexed species are in thin lines, and complex Al:5-5-SSA are in bold lines. Only species whose concentration are higher than 5% are represented.
3.2.2. Electrokinetics
The electrokinetic (zeta) potential of gibbsite particles was measured after adsorption of 5-SSA on gibbsite surfaces by means of a ZetaPals (Brookhaven Instruments). The mass concentration of gibbsite particles was 0.1 g.dm-3 and 5-SSA concentration was 10–3
mol.dm-3. The experiments were performed at two different ionic strength values (Ic = 10 -1 mol.dm-3 and 10-2 mol.dm-3). The results are shown in Figure 10 together with zeta
-10 0 10 20 30 40 1 2 3 4 5 6 7 8 9 10 11 12 13 x / m V pH
Figure 10. Zeta-potentials of gibbsite particles in the absence (□,○) and in the presence (■,●) of 5-SSA. Ionic strength was controlled by NaCl: 10–1 mol.dm–3 (circles) and 10–2
mol.dm–3 (squares). Temperature was 25 ºC.
For both ionic strengths studied, the electrokinetic data show (i) a strong shift of the isoelectric point and (ii) negative zeta-potentials over a wide pH range, indicating adsorption of 5-SSA and transfer of negative charges to the gibbsite surface. The speciation diagram (Fig. 9) actually shows that the speciation of 5-SSA is dominated both in the absence and the presence of Al by negatively charged aqueous species.
3.2.3. Spectroscopy
The IR-ATR spectra of gibbsite in absence and presence of 5-SSA, as well as spectra of the aqueous solutions of the 5-SSA and 5-SSA/Al3+ were obtained using a Bruker
spectrometer (IFS 55). A ZnSe crystal (multibounce) was used and for each measurement 1024 scans were recorded with a resolution of 4 cm–1. All measurements were made
under dry argon atmosphere. The effect of pH, which has an influence on gibbsite surface charge as well on the speciation of 5-SSA in solution was examined. For spectra of the gibbsite layer in contact with solution of 5-SSA, the gibbsite layer was prepared by drying an aliquot of a suspension.
3.3. Results and discussion
3.3.1. Spectral characterization of 5-SSA in solution
Solution spectra of 5-SSA, with and without aluminium ions have been recorded by ATR-IR. For pure 5-SSA solution at pH 2, 5 and 12, the spectra are shown in Fig. 11. At pH 2, the spectrum consists in several bands which have been assigned following previous works by Varghese et al. (2007) and Jiang et al. (2002) as shown in Table 6. From pH 2 to 5, some differences can be seen: bands around 1200 cm-1 decrease, bands at
1270 and 1306 cm-1 appear, while bands at 1370 cm-1, 1430 cm-1 increase. Around 1200
cm-1, bands corresponding to vibration of the sulfate group are expected, so this
evolution would be in agreement with the change in the molecule from –SO3H to –SO
3-at pH 1.5. From pH 5 to 12, the shift of several bands is visible, the most important is 1292 cm-1 to 1306 cm-1. According to Jiang et al. (2002), this band corresponds to
stretching of Ph-OH, which is deprotonated at pH > 11.3. Thus, the difference between these spectra would correspond to the change of speciation from pH 5, where only HSSA2- is present to pH 12, dominated by 83% of SSA3-. The main impact would be on
the vibration band of hydroxyl group which is deprotonated, but a consequence on vibration of other groups would be possible.
1000 1100 1200 1300 1400 1500
Wavenumbers (cm
-1)
Absor
b
ance
1430 1370 1306 1270 pH 2 pH 5 pH 12Fig. 11. Spectra of 5-SSA at pH 2 (black line), pH 5 (grey line), pH 12 (dotted line)
wavenumbers (cm-1) Assignments from literature pH 2 pH 5 pH 12 Ph * 1480 1479 1468 Ph,COHc * 1439 1431 1425 sCOc ** 1371 1373 1379 asSO2 * 1346-1330 1346-1330 1306 Ph-OH ** 1292 1294 1269 sSO2 * 1242sh 1218sh 1201sh 1198sh C-OH, SOH * 1180 1175 CH * 1159 1159 1151 C-COOH * 1082 1080 1084 S-OH * 1034 1030 1028 * Varghese et al. (2007), ** Jiang et al. (2002), sh: shoulder, c:carboxyl
3.3.2. Spectral characterization of 5-SSA in presence of aluminium ions or adsorbed onto gibbsite
Spectra of solutions of 5-SSA in the absence and presence of aluminium ions have been recorded. The results are shown as dotted and grey lines in Figure 12. The main difference is the presence of a bands at 1330 and 1270 cm-1 at pH 2 and pH 5. At pH 12,
the pure 5-SSA presents the same band too, yet a difference between the spectra is rather observed in the shift of bands at 1308, 1428, 1470 cm-1 to 1326, 1431, 1480 cm-1
respectively. Speciation calculation led to a predominant Al-SSA at pH 2, a mixture of Al-SSA and Al-SSA2 at pH 5 and no Al-SSA complex at pH 12.
1000 1100 1200 1300 1400 1500
Wavenumbers (cm
-1)
Absor
b
ance
1270(A)
13305-SSA with gibbsite 5-SSA with Al3+ 5-SSA 1000 1100 1200 1300 1400 1500
Wavenumbers (cm
-1)
Absor
b
ance
(B)
5-SSA with Al3+ 5-SSA5-SSA with gibbsite
1000 1100 1200 1300 1400 1500
Wavenumbers (cm
-1)
Absor
b
ance
(C)
1308 1428 1470 5-SSA 5-SSA with Al3+ 5-SSA with gibbsiteFig. 12. Spectra of SSA at (A) pH 2, (B) pH 5, (C) pH 12, as a pure solution (dotted line), a solution in presence of aluminium ions (grey line), a solution after the deposition of a gibbsite layer (black line).
From the study of the effect of pH on pure SSA, it was concluded that the band visible at 1270 cm-1 indicates the presence of Ph-O-, while a band at 1294 cm-1 wich indicates the
presence of Ph-OH is absent in spectra at pH 5 in presence of aluminium ion, or less intense at pH 2. At both pH values, the spectra would indicate that the presence of aluminium promotes the deprotonation of the phenol group, which leads to a bond between 5-SSA and the aluminium ion. The band corresponding to carboxyl group at 1370 cm-1 is not shifted in presence of aluminium. However, a hypothetical carboxyl-Al
group could perturb also the intramolecular hydrogen bond, as suggested for salicylate-iron interaction, what makes difficult to use this method to evaluate the interaction with carboxyl groups. We may conclude that the affinity of carboxyl groups for aluminium ion is well known, and an interaction is expected, despite any direct experimental evidence. At pH 12, the speciation calculation indicates the favourable formation of Al(OH)4- and the absence of any Al-SSA complexes. However, the spectra evolves in
presence of aluminium ions, mainly by the shift of bands at 1425 and 1468 cm-1 towards
values close to the spectra of pure SSA at pH 2. This result remains unexplained but suggests an interaction between both species.
SO
3-O
O
O
Al
Fig. 13. Structure of the Al-SSA complex. Al is either an ion in solution, or bound to surface in surface complexes.
As the last step, the spectra of 5-SSA in the presence of gibbsite have been recorded. The results are shown as black lines in Figure 12. In the 1500-1000 cm-1 range, no difference
between spectra of pure 5-SSA solution and gibbsite-SSA was observed at pH 2 and 12. At pH 2, this behaviour is different from that of aluminium in solution. This might be consistent with an extent of 5-SSA adsorption that is too low to be detectable by the ATR measurements.
A comparison of the spectroscopic results to the zeta-potential measurements shown in Fig. 10 suggests the following picture. The differences in zeta potential of gibbsite particles with and without 5-SSA being present are substantial over the complete pH range investigated, except for pH 12. At pH 12, no adsorption is expected according to the electrokinetic results, but the spectra of 5-SSA in the presence of gibbsite do show a slight shift of 1425 cm-1 and 1468 cm-1 bands, similar to that observed with aluminium in
solution. At pH 5, the spectra in presence of gibbsite are similar to that of 5-SSA in presence of aluminium ions, mainly due to the presence of a peak near 1270 cm-1. The
effect of SSA on zeta potential is high, so it can be concluded that a complex between 5-SSA and aluminium atom occurs at the gibbsite surface at pH 5, similar to what has been observed with aluminium ion. In such a geometry (Fig. 13), the negative charge observed in the electrokinetic data would be consistent with the free sulfonate group, deprotonated in the whole pH range. At very low pH, the zeta-potential turns positive even in the presence of 5-SSA, which can be explained by the speciation of the organic molecule itself, which might on average be less negative than at higher pH.
At pH 12, there might still be adsorption of 5-SSA, since the spectra of 5-SSA/gibbsite system is close to those of 5-SSA/Al(III). However, it would be difficult to detect by the electrokinetic method, since the gibbsite itself turns negative at pH > 11.3. The fact that the solution spectra of 5-SSA are different with or without Al(III) species indicates the possibility that there is some interaction. Again, the importance of spectroscopic studies in pinpointing interactions which are not detectable by macroscopic methods can be highlighted here.
4. Conclusions
In the first part of this chapter, the principles and experimental protocols of the use of ATR-IR to probe solid/solution interfaces have been described. A review of the literature has shown that ATR-IR can be useful to get information about the surface speciation of adsorbed carboxylic acids.
The second part was devoted to the comprehensive study of the adsorption of 5-SSA onto gibbsite platelets, and it was suggested that this phenomenon occurs via a dominant tridentate surface complex involving the phenolic and carboxylic groups. The ring structure of this surface complex had been previously postulated by Jiang et al. (2002) based on a limited set of spectra. The fact that the sulphate group is not involved in co-ordination to the surface, and therefore oriented towards the solution side of the interface, agrees with the negative charge of the gibbsite in the presence of 5-SSA. The solution study strongly indicates that the present speciation schemes for the 5-SSA-dissolved aluminium system are incomplete. The spectra show differences between the
absence and presence of Al(III) in solution at high pH, where within the current speciation scheme no complexes are expected. At high pH in the 5-SSA-gibbsite-system, the spectroscopic data also suggest interaction, which is undetectable by the electrokinetic method, since the gibbsite surface has an overall negative charge in that pH-range.
A general conclusion of our experimental study would be that comprehensive studies of solid-solution interfaces via ATR-IR may contribute to solving the structure of surface complexes. Furthermore, such studies may help finding previously unidentified species in solution speciation schemes. Overall the interplay of surface complexation and solution complexation in this system indicates that the adsorption process may be very complex and that multi-method approaches are best suited to gain deeper understanding.
5. References
Adekola, F., Fédoroff, M., Geckeis, H., Kupcik, T., Lefèvre, G., Lützenkirchen, J., Plaschke, M., Preocanin, T., Rabung, T., & Schild, D. (2011). Characterization of acid-base properties of two gibbsite samples in the context of literature results, J. Colloid
Interface Sci. Vol. 354, 306-317, 0021-9797.
Asay, D. B. , & Kim, S.H. (2005). Evolution of the Adsorbed Water Layer Structure on Silicon Oxide at Room Temperature, J. Phys. Chem. B Vol. 109, 16760-16763, 1089-5647. Axe, K., & Persson, P. (2001). Time-dependent surface speciation of oxalate at the
water-boehmite (-AlOOH) interface: implications for dissolution, Geochim. Cosmochim. Acta Vol. 65, 4481-4492, 0016-7037.
Boily, J.-F., Persson, P., & Sjöberg, S. (2000). Benzenecarboxylate surface complexation at the goethite (-FeOOH)/water interface: II. Linking IR spectroscopic observations to mechanistic surface complexation models for phthalate, trimellitate, and
pyromellitate, Geochim. Cosmochim. Acta Vol. 64, No. 20, pp. 3453-3470, 0016-7037. Borda, M. J. , Strongin, D. R., & Schoonen, M. A. (2003). A novel vertical attenuated
total reflectance photochemical flow-through reaction cell for Fourier transform infrared spectroscopy, Spectrochim. Acta A Vol. 59, 1103-1106, 0584-8539. Coates, J.P. (1993). The Industrial Applications of Infared Internal Reflection
Spectroscopy, In: Internal Reflection Spectroscopy, Dekker, New York, Mirabella, F. M. (Ed.), pp.53-96.
Couzist, A., & Gulari E. (1993). Adsorption of sodium laurate from its aqueous solution onto an alumina surface. A dynamic study of the surface-surfactant interaction using attenuated total reflection Fourier transform infrared spectroscopy, Langmuir Vol. 9, 3414-3421, 0743-7463.
Dean, J.A. (1999) Lange's Handbook of Chemistry (15th ed.), McGraw-Hill. Degenhardt, J., & McQuillan, A.J. (1999) Mechanism of oxalate ion adsorption on
chromium oxide-hydroxide from pH dependance and time evolution of ATR-IR spectra, Chem. Phys. Lett. Vol. 31, 179-184, 0009-2614.
Dobson, K. D., & McQuillan, A. J. (1999). In situ infrared spectroscopic analysis of the adsorption of aliphatic carboxylic acids to TiO2, ZrO2, Al2O3, and Ta2O5 from aqueous
Dolamic, I., & Bürgi, T. (2006). Photoassisted decomposition of malonic acid on TiO2
studied by in situ attenuated total reflection infrared spectroscopy, J. Phys. Chem. B Vol. 110, 14898-14904, 1089-5647.
Duckworth, O.W. , & Martin, S.T. (2001), Surface complexation and dissolution of hematite by C1-C6 dicarboxylic acids at pH = 5.0, Geochimi. Cosmochim. Acta Vol. 65,
4289-4301, 0016-7037.
Fredriksson, A., & Holmgren, A. (2008). An in situ ATR-FTIR investigation of adsorption and orientation of heptyl xanthate at the lead sulphide/aqueous solution interface. Miner. Engineer. Vol. 21, 1000-1004, 0892-6875.
Gan, Y., & Franks, G.V. (2006). Charging Behavior of the Gibbsite Basal (001) Surface
in NaCl Solution Investigated by AFM Colloidal Probe Technique. Langmuir Vol. 22, pp.
6087-6092.
Gao, X., & Chorover, J. (2010). Adsorption of sodium dodecyl sulfate (SDS) at ZnSe and α-Fe2O3 surfaces: Combining infrared spectroscopy and batch uptake studies. J.
Colloid Interface Sci. Vol. 348, pp. 167-176, 0021-9797.
Garcia Rodenas, L. A., Iglesias, A. M., Weisz, A. D., Morando, P. J., & Blesa, M. A. (1997). Surface complexation description of the dissolution of chromium(III) hydrous oxides by oxalic acid, Inorg. Chem. Vol. 36, 6423-6430, 0020-1669.
Hwang, Y. S., Liu, J, Lenhart, J. J. , & Hadad, C. M. (2007). Surface complexes of phthalic acid at the hematite/water interface, J. Colloid Interface Sci. Vol. 307, 124–134, 0021-9797.
Hug, S.J., & Sulzberger, B. (1994). In situ Fourier transform infrared spectroscopic evidence for the formation of several different surface complexes of oxalate on TiO2 in
the aqueous phase, Langmuir Vol. 10, pp. 3587-3597, 0743-7463.
Hug, S. H. (1997). In situ Fourier transform infrared measurements of sulfate adsorption on hematite in aqueous solutions. J. Colloid Interface Sci. Vol. 188, pp. 415-422, 0021-9797.
Jiang, L. , Gao, L. , & Liu, Y. (2002). Adsorption of salicylic acid, 5-sulfosalicylic acid and Tiron at the alumina–water interface, Colloids Surf. A. Vol. 211, 165-172, 0927-7757. Johnson, S. B. , Yoon, T. H. , Slowey, A. J. , & Brown, G. E. (2004). Adsorption of organic
matter at mineral/water interfaces: 3. Implications of surface dissolution for adsorption of oxalate, Langmuir Vol. 20, 11480-11492, 0743-7463.
Johnson, S. B. , Yoon, Kocar, B.D. , & Brown, G.E. (2004). Adsorption of organic matter at mineral/water interfaces. 2. outer-sphere adsorption of maleate and implications for dissolution processes, Langmuir Vol. 20, 4996-5006 , 0743-7463.
Kallay, N., Preočanin, T., Kovačević, D., Lützenkirchen, J., & Villalobos, M. (2011), Thermodynamics of the Reactions at Solid/Liquid Interfaces, Croat. Chem.
Acta Vol. 84, 1, pp. 1-10, 0011-1643.
Klug, O., & Forsling, W. (1999). A spectroscopic study of phthalate adsorption on -aluminum oxide, Langmuir Vol. 15, 6961-6968, 0743-7463.
Kubicki, J.D., Schroeter, L.M., Itoh, M.J., Nguyen, B.N., & Apitz, S.E. (1999). Attenuated total reflectance Fourier-transform infrared spectroscopy of carboxylic acids adsorbed onto mineral surfaces, Geochim. Cosmochim. Acta Vol. 63, 2709-2725, 0016-7037.
Kulik, D. A., Luetzenkirchen, J., & Payne, T. (2010). Consistent treatment of 'denticity' in
surface complexation models. Geochim. Cosmochim Acta Vol. 74, 12 , pp. A544-A544,
Larsson, M.L., Fredriksson, A., & Holmgren, A. (2004). Direct observation of a self-assembled monolayer of heptyl xanthate at the germanium/water interface: a polarized FTIR study. J. Colloid Interface Sci. Vol.273, 345–349, 0021-9797.
Lefèvre, G., Noinville, S., & Fédoroff, M. (2006). Study of uranyl sorption onto hematite by in situ attenuated total reflection - infrared spectroscopy, J. Colloid Interface Sci. Vol. 296, 608-613, 0021-9797.
Lefèvre, G., Kneppers, J., & Fédoroff, M. (2008). Sorption of uranyl ions on titanium oxide studied by ATR-IR spectroscopy, J. Colloid Interface Sci. 327, 15-20, 0021-9797. Lide, D.R. (1998). Handbook of Chemistry and Physics 79th.; Lide, D.R., Ed.; CRC Press:
Boca Raton.
Huittinen, N., Rabung, Th., Lützenkirchen, J., Mitchell, S.C., Bickmore, B.R., Lehto, J., & Geckeis, H. (2009). Sorption of Cm(III) and Gd(III) onto gibbsite, alpha-Al(OH)3: A
batch and TRLFS study, J. Colloid Interface Sci. Vol. 332, 158-164, 0021-9797.
Lützenkirchen, J., Kupcik, T., Fuss, M., Walther, C., Sarpola, A., & Sundman, O. (2010). Adsorption of Al(13)-Keggin clusters to sapphire c-plane single crystals: Kinetic observations by streaming current measurements, Appl. Surf. Sci. Vol. 256, 5406-5411, 0169-4332.
Mirabella, F.M. (1993). Principles, Theory, and Practice of Internal Reflection
Spectroscopy, In: Internal Reflection Spectroscopy, Dekker, New York, Mirabella, F. M. (Ed.), pp.17-52.
Nordin, J. , Persson, P., Laiti, E., & Sjöberg, S. (1997). Adsorption of o-phthalate at the water-boehmite (-AlOOH) interface: evidence for two coordination modes, Langmuir Vol. 13, 4085-4093, 0743-7463.
Panak, P. (1996). Untersuchung von intramolekularen Energietransferprozessen in Cm(III)- und Tb(III) Komplexen mit organischen Liganden mit Hilfe der
zeitaufgelösten Laserfluoreszencspektroskopie. Ph.D. Thesis, Technische Universität München, 236 p.
Peak, D., Ford, R.G., & Sparks, D.L. (1999). An in-situ FTIR-ATR investigation of sulfate bonding mechanisms on goethite. J. Colloid Interface Sci.Vol. 218, pp. 289-299, 0021-9797.
Persson, P., & Axe, K. (2005). Adsorption of oxalate and malonate at the water-goethite interface: molecular surface speciation from IR spectroscopy, Geochim. Cosmochim. Acta Vol. 69, No. 3, pp. 541–552, 0016-7037.
Rosenqvist, J., Persson, P., & Sjöberg, S. (2002). Protonation and Charging of Nanosized Gibbsite (-Al(OH)3) Particles in Aqueous Suspension. Langmuir Vol. 18, pp. 4598-4604.
Rosenqvist, J., Axe, K., Sjöberg, S., & Persson P. (2003). Adsorption of dicarboxylates on nano-sized gibbsite particles effects of ligand structure on bonding mechanisms,
Colloids Surf. A Vol. 220, 91-104, 0927-7757.
Rotzinger, F.P., Kesselman-Truttmann, J.M., Hug, S.J., Shklover, V. , & Grätzel, M. (2004). Structure and vibrational spectrum of formate and acetate adsorbed from aqueous solution onto the TiO2 rutile (110) surface, J. Phys. Chem. B Vol. 108, 5004-5017,
1089-5647.
Scott, K.L., Wieghardt, K., & Sykes, A.G. (1973). Mu-oxalato-cobalt(III) complexes, Inorg.
Chem. Vol. 12, 655-663, 0020-1669.
Tejedor-Tejedor, M.I., & Anderson, M.A. (1986). "In situ" attenuated total reflection Fourier transform infrared studies at the goethite (a-FeOOH)-aqueous solution interface. Langmuir Vol. 2, pp. 203-210, 0743-7463.
Tejedor-Tejedor, M.I., & Anderson, M.A. (1990).Protonation of phosphate on the surface of goethite as studied by CIR-FTIR and electrophoretic mobility. Langmuir Vol. 6, pp. 602-611, 0743-7463.
Tejedor-Tejedor, M.I., Yost, E.C., & Anderson, M.A. (1990), Characterization of benzoic and phenolic complexes at the goethite/aqueous solution interface using cylindrical internal reflection Fourier transform infrared spectroscopy. Part 1. Methodology.
Langmuir Vol. 6, 979-987, 0743-7463.
Tickanen, L.D., Tejedor-Tejedor, M.I., & Anderson, M.A. (1991). Quantitative characterization of aqueous suspensions using attenuated total reflection Fourier transform infrared spectroscopy: influence of internal reflection element-particle interactions on spectral absorbance values. Langmuir Vol. 7, pp. 451-456, 0743-7463. Tunesi, S., & Anderson, M.A. (1992). Surface effects in photochemistry: an in situ
cylindrical internal reflection-Fourier transform infrared investigation of the effect of ring substituents on chemisorption onto TiO2 ceramic membranes, Langmuir Vol. 8,
487-495, 0743-7463.
Varghese, H.T., Panicker, C. Y., & Philip, D. (2007). IR, Raman and SERS spectra of 5-sulphosalicylic acid dihydrate, J. Raman Spectr. Vol. 38, 309-315, 1097-4555.
Venyaminov, S.Y., & Prendergast, F.G. (1997). Water (H2O and D2O) molar absorptivity
in the 1000–4000 cm-1 range and quantitative infrared spectroscopy of aqueous
solutions. Anal. Biochem. Vol. 248, 234-245, 0003-2697.
Villalobos, M., & Leckie, J. O. (2001). Surface complexation modeling and FTIR study of carbonate adsorption to goethite. J. Colloid Interface Sci. Vol. 235, pp. 15-32, 0021-9797. Wang, Z., Grahn, M., Larsson, M.L., Holmgren, A., Sterte, J., & Hedlund, J. (2006).
Zeolite coated ATR crystal probes, Sensors Actuators B. Vol. 115, 685-690, 0925-4005. Weisz, A.D., Regazzoni, A.E., & Blesa, M.A. (2001). ATR-FTIR study of the stability
trends of carboxylate complexes formed on the surface of titanium dioxide particles immersed in water, Solid State Ionics Vol. 143, 125-130, 0167-2738.
Weisz, A.D., Garcia Rodenas, L., Morando, P.J., Regazzoni, A.E., & Blesa, M.A. (2002). FTIR study of the adorption of single pollutants and mixtures of pollutants onto titanium dioxide in water: oxalic and salycylic acids, Catal. Today Vol. 76, 103-112, 0920-5861.
Yoon, T. H., Johnson, S. B., Musgrave, C. B., & Brown, G. E (2004). Adsorption of organic matter at mineral/water interfaces: I. ATR-FTIR spectroscopic and quantum chemical study of oxalate adsorbed at boehmite/water and corundum/water interfaces, Geochim. Cosmochim. Acta Vol. 68, No. 22, pp. 4505-4518, 0016-7037. Yost, E.C., Tejedor-Tejedor, M.I., & Anderson, M.A. (1990). In situ CIR-FTIR
characterization of salicylate complexes at the goethite/aqueous solution interface,
Environ. Sci. Technol. Vol. 24, pp. 822-828, 0013-936X.