Publisher’s version / Version de l'éditeur:
IEEE Transactions on Industry Applications, 16, 3, pp. 419-427, 1980-05
READ THESE TERMS AND CONDITIONS CAREFULLY BEFORE USING THIS WEBSITE. https://nrc-publications.canada.ca/eng/copyright
Vous avez des questions? Nous pouvons vous aider. Pour communiquer directement avec un auteur, consultez la première page de la revue dans laquelle son article a été publié afin de trouver ses coordonnées. Si vous n’arrivez pas à les repérer, communiquez avec nous à [email protected].
Questions? Contact the NRC Publications Archive team at
[email protected]. If you wish to email the authors directly, please see the first page of the publication for their contact information.
NRC Publications Archive
Archives des publications du CNRC
This publication could be one of several versions: author’s original, accepted manuscript or the publisher’s version. / La version de cette publication peut être l’une des suivantes : la version prépublication de l’auteur, la version acceptée du manuscrit ou la version de l’éditeur.
Access and use of this website and the material on it are subject to the Terms and Conditions set forth at
Lighting controls, patterns of lighting consumption, and energy
conservation
Levy, A. W.
https://publications-cnrc.canada.ca/fra/droits
L’accès à ce site Web et l’utilisation de son contenu sont assujettis aux conditions présentées dans le site LISEZ CES CONDITIONS ATTENTIVEMENT AVANT D’UTILISER CE SITE WEB.
NRC Publications Record / Notice d'Archives des publications de CNRC:
https://nrc-publications.canada.ca/eng/view/object/?id=55d2ef6a-9bce-4ffd-8b0e-886ec009bc1b https://publications-cnrc.canada.ca/fra/voir/objet/?id=55d2ef6a-9bce-4ffd-8b0e-886ec009bc1bSer
TH1
"~ 2 1 d
National Research
Conseil national
3.929
1
Council Canada
de recherches Canada
op. 2
- r . -= -3-
-
-2.LIGHTING CONTROLS, PATTERNS OF LIGHTING
CONSUMPTION, AND ENERGY CONSERVATION
by
Alan
W.
Levy
h~
AL'~Z€*
Reprinted from
IEEE Transactions on Industry Applications
VoL IA.16, No.
3, May/June 1980
p.
419.427
DBR Paper No. 929
Division of Building Research
L'auteur d6crit certains points importants du programme de recherche sur les 6conomies d16nergie d'gclairage qui est actuellement en cours 1 la Division des recherches sur le bztiment du Conseil national de recherches du Canada. Le principal objectif du programme est de dgterminer les schihas et niveaux d16clairage actuels dans les bureaux
et les Stoles, et de mettre au point des systGmes de
r6gulation rentables (manuels ou automatiques) pour r6duire les charges d'utilisation de 1'6nergie d'sclairage. L'auteur dEcrit un nouvel appareil de mesure de la consommation d'6nergie d16clairage. I1 utilise aussi la photographie psriodique afin d'obtenir des informations dGtaill6es sur les p6riodes d16clairage dans les 6coles et les bureaux. L'auteur 6tudie enfin les dconomies rsalisdes au moyen d'un systsme photoseneible automatique, install6 dans un bureau type.
IEEE TRANSACTIONS ON INDUSTRY APPLICATIONS, VOL. IA-16, NC$. &-.MAYJJUNE 1980
Lighting Controls, Patterns of Lighting Consumption,
and
Energy Conservation
ALAN W. LEVYAbsnactSome of the important areas of the lighting energy con- servation research program currently being carried out at the Division of Building Research, National Research Council of Canada, are described. The major emphasis of the program is to monitor present patterns and levels of lighting consumption in offices and schools and then develop and encourage cost-effective control systems to reduce the hours of use of lighting power loads. A new device to measure lighting energy consumption
is described. Tie-lapse photography is being employed to obtain detailed information regarding patterns of lighting use in offlces and schools. This information is used to develop cost-effective manual- and automatic- control devi-. The savings measured with a daylight-linked automatic system installed in a typical offlce are discussed.
1. INTRODUCTION
T
HE DIVISION of Building Research (DBR), National Re- search Council of Canada, initiated a research program in January 1977 to investigate means of reducing lighting energy consumption in office and school buildings. Present estimates attribute 17 percent of the total lighting energy consumed in the U.S. to office and school buildings [ I ] , and this same fig- ure is generally assumed to be appropriate for Canada. The uncertainty in this estimate, however, becomes of academic Paper IUSD 79-37, approved by the Production and Application of Light Committee of the IEEE Industry Applications Society for presen- tation at the 1978 Industry Applications Society Annual Meeting, Toronto, ON, Canada, October 1 4 . Manuscript released for publica-tion January 29, 1980.
The author is with the Energy and Services Section, Division of Building Research, National Research Council of Canada, Ottawa, ON, KIA OR6 Canada.
interest to those owning and operating office and school buildings where lighting is often found t o be one of the major consumers of energy, accounting for anywhere between 25 and 50 percent of total energy consumption in the building
PI.
Lighting energy (E) is calculated as the product of two in- dependent variables, power (p) and time (t):
Power is normally expressed in kilowatts and time in hours. This seemingly simple fact has been overlooked on many occasions by those involved in lighting energy conservation to the extent that their attention has focused entirely on reducing lighting levels (with an expected commensurate reduction in the installed or demand lighting load) as a sole means of achieving their goal.
Research at the DBR has taken a different approach. A major goal has been the development of a method of ensuring that lights are on when required and off when they are not. The alternative approach of advocating a general reduction in lighting levels is beset with difficulties. The choice of the "csr- rect" or "adequate" lighting level is arbitrary, and its imple- mentation often creates controversy and dissatisfaction. In addition, a reduction of lighting levels may lead to a lowering of productivity and increased absenteeism. Although evidence for this is not extensively documented, there is considerable laboratory data to indicate that reductions in productivity could be expected. Setting an upper limit to the installed
420 IEEE TRANSACTIONS O N INDUSTRY APPLICATIONS, VOL. IA-16, NO. 3, MAY/JUNE 1980 power load is again an arbitrary process and may not achieve
the desired results if present waste is due to lamps being left on unnecessarily. Power-load limits remain a controversial topic. On the other hand, optimizing the hours of use of lighting power loads is noncontroversial, practical, and in most instances cost-effective with payback periods attractive to building owners and operators. The technology for achieving efficient automatic and improved manual controls already exists, but has not been fully exploited for the purpose of re- ducing lighting energy consumption. With the emergence of numerous building codes limiting electrical power ioads in new and existing buildings [3], and more importantly, energy bud- get codes in preparation, there is a very real requirement for numerous types of lighting control systems to both monitor and control loads. It is not without reason, therefore, that a number of the devices and systems described in this paper have been developed with the assistance of commercial or- ganizations.
To be successful, any program aimed at developing ways to minimize hours of use of lighting energy requires infor- mation on present patterns of use; that is, during what periods of the working day and for what reasons are lights left on when they are not needed? Unnecessary lights are those which illuminate an unoccupied space, a space with sufficient day- light, or a space lit for an activity other than that which is currently being performed. Engineers using building-energy- analysis computer programs to predict energy consumption in buildings are also interested in "typical" daily profdes of lighting use to improve the accuracy of their predictions.
11. MONITORING CONSUMPTION
A. ,.ime-Lapse Photography
Data on typical lighting consumption patterns can be used in three ways. First, the potential effectiveness of alternative conservation strategies (e.g., automatic controls) can be com- pared. Second, an indication can be obtained of the percentage of electricity consumed by lighting alone compared to other building services and its effect on peak demand for electricity. Third, profiles of use needed as input to building-energy-analysis cbmputer programs can be obtained.
The data required at any given instant include
1) the fraction of maximum lighting load switched on; 2) the contribution of natural daylight to internal illumi-
nance levels and its effect on the use of artificial light; 3) the number of occupants in the space;
4) the activity being performed in the space.
Time-lapse photography can be employed t o collect the infor- mation periodically in a single photographic frame. An ordin- ary 8-mm movie camera fitted with a wide-angle lens is sus- pended from the ceiling, positioned in such a way that its field of view contains the luminaires in the ceiling and most of the floor space (Figs. 1 and 2). In certain installations the switching arrangement of the luminaires allows the field of view to be limited to a single luminaire in each switching cir- cuit. Knowing that a particular luminaire has been switched on also indicates that the remainder in the particular switching
Fig. 1.
circuit are similarly activated. Restricting the field of view of the ceiling in this way can enable a larger floor area to be monitored for determining space occupancy.
A small analog quartz watch is mounted in front of the camera to indicate the time in hours and minutes. A timing circuit, placed above the ceiling, controls the activation of the automatic camera exposure mechanism and the shutter control. A single frame can be exposed typically at 6- to 8-min intervals. With 3600 frames on a 50-ft film (color, super 8) the film cas- sette must be changed every 20 days. The timing circuit and camera are powered by a single 6-V lantern battery with a typical life of up to six months.
Radiation data are also monitored for future work on the contribution of natural daylight to interior illumination levels. This work will be aimed at predicting the savings that can be attained with automatic light controls that switch or dim arti- ficial light in response to changes in the available daylight. Also, patterns of switching behavior can be explored, such as the determination of the threshold interior illuminance at which artificial lights are activated.
Details of studies of two open-plan office spaces and one school classroom which have been carried out to date will
LEVY: LIGHTING A N D ENERGY CONSERVATION
"."
0 2 4 b 8 10 1 2 14 26 I 8 2 0 2 2 24
T l M E O F D A Y . E A S T E R N D A Y L I G H T T l M E
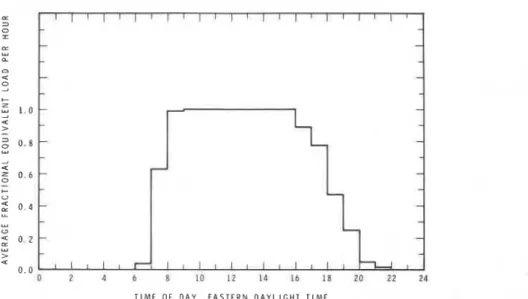
Fig. 3. Equivalent load pattern for large open-plan office.
indicate the scope and use of the photographic method. In each study the average kilowatt-hour equivalent load is calcu- lated as the product of the fraction of hours the lamps are on in a given hour and the fraction of maximum lighting load utilized. For example, if 4 0 percent of the lamps are on (with all lamps of the same wattage)for 15 min in a given hour the
equivalent load is calculated as 0.40 X 0.25 = 0.1 0.
The merit of the time-lapse photographic technique is that occupancy data is obtained simultaneously with instantaneous energy use. For the purposes of this work, 100-percent oc- cupancy within a given hour interval is defined as at least one person in the room for the entire 60 min. One or more peo- ple in the room for a total of 15 min during a particular 6 0 min interval is calculated as 25-percent occupancy. Where ap- plicable, the hours of use for each lighting circuit within a space can be illustrated, indicating the switching behavior of the occupants where selective switching is available.
The two open-plan office spaces I and I1 exhibit almost identical patterns of lighting use (Figs. 3 and 4). Office space I spanned an area of 242 m 2 ; its southwest wall was approxi- mately 80 percent glazed. Three switching zones were control- led from wall-mounted rocker switches at one end of the of- fice. The individual switches were labelled in accordance with the floor area they controlled. It was not possible to collect meaningful occupancy data because acoustic screens surround- ing each work space interfered with the camera field of view.
Fig. 3 shows that between 09:OO and 16:OO the full lighting load was used all of the time. No switching occurred with re- spect to daylight or occupancy. Lighting energy consumed between 08:OO and 16:OO accounted for 72 percent of total daily average consumption; six percent of the energy was used before 08:00, and the remaining 22 percent after 16:OO. Cleaning activities, in the absence of office workers, took place on average after 17:OO; lighting energy consumption for this particular purpose was 14 percent of the total daily average. On most occasions (approximately 1 1 of the 16 days monitored) the cleaners preferred to have all the lamps on when working, switching them off on completion of their task. In the remain-
T I M E , h
Fig. 4. Equivalent kwh load.
ing instances use was made of zonal switching in the office, with less than half the lights switched on at any one time. There was almost no variability from day to day in the pattern of light usage, indicating that the profile shown in Fig. 3 is typical for the time of year in which the study took place (Augustlseptember).
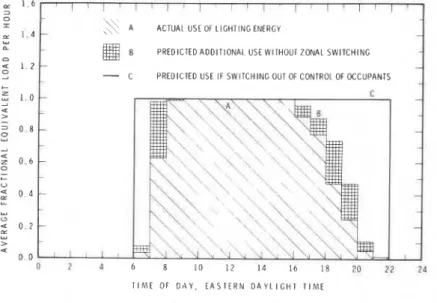
Fig. 5 illustrates the predicted use of artificial light within the space if there is no zonal switching. This can be calculated from the raw data by assuming that each time the lamps are switched on or off the entire lighting load is under control, i.e., conditions that would prevail if a single switch controlled the entire space. The predicted quantities may be considered con- servative estimates because it is probable that the lamps would be switched less frequently if there were only one switch con- trol available. The difference in total equivalent load between this estimated use and the actual consumption provides a con- servative estimate of nine-percent savings achieved from a zonal switching facility. The true savings lie somewhere be- tween this figure and savings that accrue when the zonal switching system is compared to the situation where the entire lighting load is completely out of control of the occupants. Then, the pattern of use would be similar t o profile C in Fig. 5. The difference between profiles C and A represents a saving
IEEE TRANSACTIONS ON INDUSTRY APPLICATIONS, VOL. IA-16, NO. 3, MAYIJUNE 1980
,a
A ACTUAL USE OF LIGHTING ENERGY, 1 4
u
PREDICTED ADDITIONAL USE WITHOUT ZONAL SWITCHING
4 1 2 0
PREDICTED USE IF SWITCHING OUT OF CONTROL OF OCCUPANTS
T I M E O F D A Y . E A S T E R N D A Y L I G H T T I M E
Fig. 5. Equivalent load pattern.
TABLE I
CALCULATED FC-H VALUES FROM RADIATION DATA MONITORED A T NRC, OTTAWA, AUG. 23-SEPT. 15,1977
of 31 percent. This saving indicates the difference in lighting energy consumption that can occur between an installation where the luminaires are on a single switch circuit, out of the control of the occupants themselves, and an installation where zonal switching by the occupants is possible.
Insufficient data do not permit correlation between the probability of switching lights and internal illuminance levels
where there is a contribution from daylight. The global (sun
+
sky) illuminance values in Table I do indicate that during the study there was a considerable contribution from daylight to indoor light levels, but this does not seem to have influenced the switching of luminaires during the core time of 09:OO to
16:00, when the largest proportion of lighting energy is con-
sumed. Interior illumination levels, given in Table I, have been calculated for a daylight factor1 of five percent.
Office 11, with an area of 214 m2, had much less glazing
than office I. The south wall was 11 percent glazed, providing
insufficient daylight to contribute usefully t o interior illumina- tion levels. For this reason no daylight data were collected.
The average kilowatt-hour equivalent load consumed in each hour is given in Fig. 4, and percentage occupancy is given in Fig. 6. In this office there were two switching zones control-
1 The daylight factor is the ratio o f the interior daylight illuminance level to that simultaneously available out-of-doors from an unobstructed hemisphere of sky of known luminance distribution. Direct sunlight is excluded for both values of illuminance.
LEVY: LIGHTING AND ENERGY CONSERVATION 423
TIME, h
Fig. 6. Occupancy pattern.
, , 1 1 1 1 1 1 1 1 1 1 1 1 1 1 1 M A X I M U M USE I F O R 2 1 D A Y S 1
/
h 1 10 1 2 I 4 16 I 8 20 2 1 14
T I M E , h
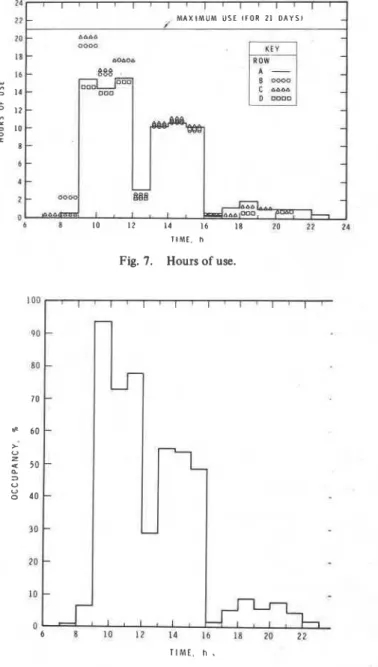
Fig. 7. Hours of use.
led from three wall-mounted switch panels separately located within the space.
Selective switching of the luminaires occurred on only 11 days of the 45 monitored, and with one exception, this took place before 08:00. T l e cleaning staff were therefore the only personnel to utilize separately the two switching circuits avail- able. Consequently, the pattern of hours of use for the two switching zones are almost identical and follow the pattern obtained for the equivalent kilowatt-hour profile illustrated in Fig. 4, because a fxed load, equal to the total lighting power load, was activated most of the time.
Lighting energy consumed between 08:OO and 17:OO ac- counted for 85 percent of the total daily average consumption;
six percent of the energy was used before 08:OO and the re-
maining nine percent after 17:OO. Nearly all of the six percent use before 08:OO can be attributed to cleaning activities. The occupancy data, Fig. 6, indicate that the office space was occupied by at least one person each day during the core hours, but never after 17:OO and rarely before 08:OO. The absence of office personnel after 17:OO and the nine-percent energy use during this time period can be attributed to security personnel and simply wasted energy consumption during unoccupied hours. Very little use was made of the two-zone switching facility; only the cleaning staff made use of it.
The following conclusions can be drawn for these two open- plan offices.
1) The patterns of lighting use were very similar, although the percentage wall glazing and switching zones were quite dis- similar.
2) Without exception, the full lighting load was used be- tween the core hours 09:OO and 16:OO.
3) Lights were not switched off in relation to interior day-
light levels.
4) Very little use was made of the light switches other than at the beginning and end of the workday.
5) For both offices, the switch panels were located at in- convenient positions for the occupants to make use of them during the working day.
6) Any conservation measure must be addressed predom- inantly to the core hour use.
The results obtained in a cellular school classroom gave quite different patterns of use compared t o the offices. The
w 6 B Ia 12 14 t h 1 B 70 2 2 TIME, h .
Fig. 8. Occupancy pattern.
9-m X 7.5-m classroom was 70 percent glazed on the east
wall. Three rows of suspended luminaires ran parallel to the east wall, each on a separate switching circuit as were the lamps parallel to and in front of the south wall illuminating the blackboard. Each row of luminaires were controlled from a single switch panel (containing four switches) adjacent to the classroom door.
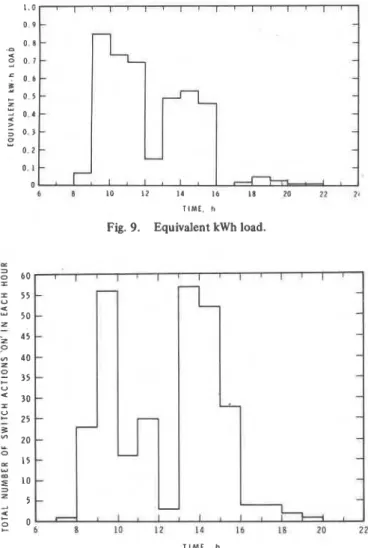
The hours of use for each row of luminaires is illustrated in Fig. 7, the occupancy pattern in Fig. 8, and equivalent kilo- watt-hour consumption in Fig. 9. The occupancy pattern closely resembles the hours of use of artifical light and pattern of energy consumption. The latter two are similar because .the lighting load was equally distributed amongst three of the four lighting circuits.
Only seven percent of the total lighting energy was con- sumed when the classroom was unoccupied. A core time of use of the classroom between 09:OO and 16:OO can be defined
IEEE TRANSACTIONS O N INDUSTRY APPLICATIONS, VOL. IA-16, NO. 3, MAYIJUNE 1980
b B I0 I2 14 16 I8 20 1 2 11
TIME. h
Fig. 9. Equivalent kwh load.
12 14 16
TIME, h
Fig. 10. Pattern of switching luminaires on.
TIME. h
Fig. 11. Patterns of switching luminaires off.
from Fig. 7. As little as nine percent of the recorded occupancy
time occurred outside of the core time and, referring to Fig. 7, 95 percent of the total hours of use of light occurred during
this period of time.
One can also analyze the pattern of switching lights on and off (Figs. 10 and 11). The total number of switchings were reasonably equal amongst the different rows indicating little
selective switching. Most switch ON'S occurred between 09:OO
and 10:OO at the start of school, then after lunch, followed by mid-afternoon between 13:OO and 15:OO. The majority of
switch OFF'S occurred at the end of school between 15:OO and
16:OO.
Table I1 gives an indication of the potential daylight pene- tration of the space. However, evidence from the film records indicate that when direct sunlight was incident on the east glazed wall during the morning session, the curtains were drawn, necessitating the use of artificial light.
In contrast to the office studies where the full lighting load was used between 09:OO and 16:00, the. school occupants switched the load on and off in relation to their occupancy of the space. By switching the luminaires off during the core time, a 41-percent saving in energy was realized in comparison to full load utilization. However, the absence of any significant selective switching between rows of luminaires indicates little switching of light in relation to daylight.
Although no general conclusions can be drawn from the limited studies described here, they do serve to illustrate the wealth of information that can be obtained from the time- lapse photographic technique. Such information removes some of the guesswork in calculating the cost effectiveness of alter- native control conservation strategies. Considerable work has already been performed in the U.K. along these lines to deter- mine the economics of automated daylight-linked lighting con-
trol systems [4]
.
In addition, the cost effectiveness of installingmore manual switches and occupancy detectors and replacing fluorescent lamps with more efficient high-intensity discharge (HID) sources (for installations where infrequent or zero switching of lights can be expected during core hours) can be explored.
B. Remote Wireless Lighting Energy Monitor
The remote lighting energy monitor developed from a re- search requirement to monitor the lighting energ consump-
tion in office and school buildings separately from other
building electrical services. The mode of operation of the device is to accumulate and record .the number of hours a given lighting circuit is on. Energy consumption is then cal-
culated as the product of the power load
(kW)
and recordedhours of use for that switch circuit. The power load in a given circuit for lamps of given wattage is obtained as (number of
lamps X lamp wattage)
+
(number of ballasts X ballast loss).Where more than one luminaire is controlled by a single switch, it is only necessary to meter a single luminaire to obtain the energy consumption for the total circuit.
Since the initial prototype was assembled at DBR, a num-
ber of alternative electronic design approaches have been ex- plored. One of the more promising and potentially inexpensive is to couple an electronic accumulator to a phototransistor. Artificial lights operated from a 60-Hz electricity supply pro- duce an imperceptible 120-Hz periodic variation in light out- put. This "flicker" is detected by a phototransistor, which conducts current proprotionately to the quantity of light it receives, producing pulses at a 120-Hz rate. The pulses are ac- cumulated in a counter chain in decimal units up to 999.9 h (Fig. 12). The device, powered by a 9-V transistor-type battery, will operate up to six months at which time the battery is re- placed and the accumulated time is automatically reset to zero. Installation costs are low because no wiring is necessary.
LEVY: LIGHTING AND ENERGY CONSERVATION
TABLE I1
CALCULATED FC-H VALUES FROM RADIATION DATA MONITORED AT NRC, OTTAWA, SEPT.-NOV., 1977
(CONVERSION FACTOR 115 ~ h i I / w ) 2 1 0 TOTAL 0 MEAN 0 Eint ( d = 5%) ( f t - c ) 0 F L U O R E S C E N T L A M P
-
I
P H O T O D E T E C T O R1
1 2 0 H z S I N E W A V E2
120 H z P U L S E S C O U N T E R 1 1 1 0 h P U L S E S C O U N T E R D E C O D E R h x 1 0 0 0 Fig. 13.Fig. 12. Principle operation of time-elapsed meter.
has no display. Instead the accumulated time is stored in coded form and is read out using a separate reader unit (Fig. 13). Its LED display is powered by penlight cells with a life of about 3600 readings if the reader is not left on too long be- tween readings. The monitor is insensitive to daylight and will record illumunation from incandescent, fluorescent, and HID lamps.
The meter performs a number of functions which are im-
portant to present energy conservation policies. Primarily, the meter can be used t o collect much needed data for the electrical energy consumed by artificial lighting in the building. Current figures of national annual lighting energy consumption are normally only estimates based on the sales figures of the leading lamp manufacturers. Secondly, by monitoring hours of use separately from power loads, lowering of lighting levels as the sole conservation measure can be avoided, and less contro- versial ways of controlling the hours of use of artificial illumin- ation, e.g., through efficient switching and automatic control, can be applied immediately.
426 IEEE TRANSACTIONS
If the meter were read with sufficient frequency over a rep- resentative period of time, a daily power-load pattern for light- ing would emerge. Building owners and operators could then evaluate the dollar savings possible by regulating load demand in relation to peak electricity rates. Electricity generating and distributing companies might be interested to obtain such data for use in their present and future generating capacity plans and energy conservation programs.
It is believed that the DBR time-elapsed meter is the first to provide a convenient method for inexpensive remote wireless monitoring of lighting energy consumption separately from other electrical services. It is most common for electrical panelboards l o distribute electricity for a variety of uses, e.g., lighting, office equipment, and maintenance machinery. This precludes the connection of conventional ac time-elapsed meters to panelboards to monitor lighting energy separately. The normal approach would be to use a meter in series with every lighting switch circuit. There are numerous disadvantages with such a procedure, however, from both research and energy management considerations.
1 ) Cost: An electrical contractor must be hired to install the meters. The unit price of a typical meter is currently about $30, the DBR device will cost less than $20.
2) Legal and Safety Regulations: Since the wiring of the building would be interfered with, permission of the building owner or operator must be sought and the cooperation of the resident plant engineer obtained. All safety regulations must be checked.
3) Inconvenience: Most commercial time-elapsed meters are conspicuous in their design. For research purposes, one would prefer a n inconspicuous design so as not to affect the normal behavioral pattern of the occupants. A conspicuous meter may also be considered as a detraction to the decor and mood of the interior. Such problems of aesthetics can be a serious draw- back when trying to persuade the occupants to cooperate in collecting the data.
111. LIGHTING CONTROLS
Lighting controls range in sophistication from the common wall-mounted rocker switch t o microprocessor-controlled car- rier-frequency line control. The time-lapse photographic studies have revealed in some installations the profound effect that the design and location of the seemingly innocuous wall switch have on the pattern of light usage. Instances have occurred where luminaires have been switched in relation not to where the occupants sit, nor daylight levels but rather following a left-to-right movement of the hand across the switching panel. Where switch panels are inaccessible or inconveniently located they will generally be underused as was the case in the office studies. Furthermore, the number and location of luminaires controlled by individual switches certainly determine their potential for controlling the efficient use of lighting energy. Some effort is therefore devoted to making the manual light switch as efficient as possible within the economic constraints set by the building ownerloperator and the behavior of the user. To this end, certain control devices are being developed. These include a simple ceiling-mounted pull-cord switch, an inexpensive wall-timer switch, and low-voltage and wireless
ON INDUSTRY APPLICATIONS, VOL. IA-16, NO. 3, MAYIJUNE 1980
remote controls that use ultrasound and infrared frequencies as the transmitting media.
The ceiling-mounted pull-cord switch perhaps deserves special mention as a possibly attractive low-technology con- trol device and will illustrate the criteria by which one should judge the cost effectiveness of any switch. The pull-cord switch is commdnly used in store rooms and residential basements but rarely in offices. For offices, the switch has the following advantages which are especially appealing for retrofit.
1) It can conveniently located above or near each work sta- tion, facilitating individual lighting control.
2) It retains its effectiveness when changes in personnel and furniture layout take place (changes are estimated at seven per- cent oer annum r51).
3) Because no wires have t o be run t o walls and down to switch boxes, there is a low installation cost (especially for retrofit).
4) Because of low installation cost, there are less economic constraints in choosing the number of luminaires controlled by each switch, that is, felxible switching arrangements are possible. 5) Less wire is required, and there is n o need to interfere with wall fabric.
6) With the insulating cord material, there is complete elec- trical isolation and safety for users.
The only disadvantage would appear t o be aesthetics. It can be argued that offices would look unfamiliar and untidy with cords suspended from the ceiling. However, at least one office in the U.K. [6] has a successful installation. The ad- vantages of the switch are so compelling that, in conjunction with two companies, a switch is being designed which may be acceptable t o office environments and encourage the efficient use of artificial light.
The success of this control and others mentioned earlier, however, is dependent on the behavior of the user. To circum- vent this unknown factor, automatic control systems are being evaluated. The installation of time clocks with override facilities provides a relatively inexpensive method of securing some de- gree of control. In larger installation~ the use of automatic daylight-linked lighting systems controlled by photocells mounted in the interior ceiling can yield substantial savings. The simplest and cheapest system is an on/off control. More sophisticated and expensive are continuous dimming systems, which in many circumstances are more acceptable to the oc- cupants and, with additional on/off capabilities, save the maximum energy. The system operates by activating luminaires when daylight in the interior falls below a preset value and de-
activating when sufficient daylight becomes available.
i
I Although analytic techniques [4], [7] have been developedto predict energy savings from daylight-linked automatic con-
I
I
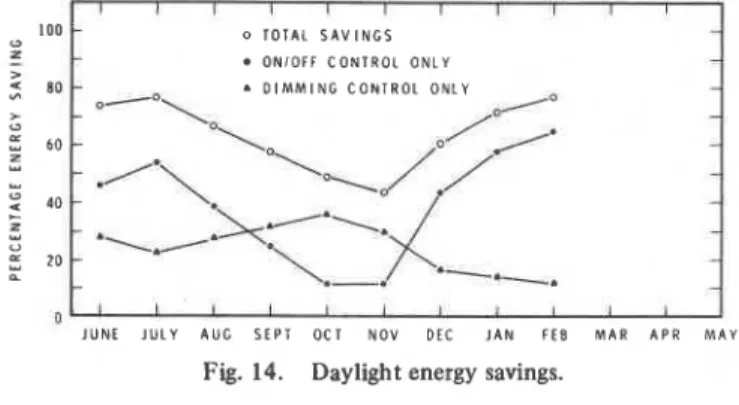
trols they are either simplified to the extent that their built-in assumptions are questionable, or complex enough to require considerable computer time. In June, 1977, DBR installed an automatic-control system in an office with considerable day- light penetration to actually measure the energy savings and test a commercial system. The measured savings accrued, com- pared to typical consumption patterns (as for offices I and I1 described earlier), are illustrated in Fig. 14. To date, the sum- mer savings in energy have reached over 75 percent of the pre-
LEVY: LIGHTING A N D ENERGY CONSERVATION I 1 I 1 I I 1 I I I I 100 - 0 0 T O T A L S A V I N G S Z -
-
O N l O F F C O N T R O L O N L Y > D I M M I N G C O N T R O L O N L Y-
- --
--
&-
- 0 1 I I I I t l I I l l 1 JUNE J U L Y A U C S E P T O C T N O V DEC J A N F E E M A R A P R M A YFig. 14. Daylight energy savings.
dicted core consumption. Of this 75-percent saving, approxi- mately 46 percent is due simply t o the onloff facility, the re- mainder achieved by continuous dimming. Predictably, in the vinter months, with reduced daylight hours, the major savings can be attributed t o the dimming control. This trend is re- versed, however, when the ground is covered with snow. The first snowfall was recorded in late November and the dramatic change in energy consumption is revealed in the December data points.
IV.
CONCLUSIONSThe work described in this paper is part of a research pro- gram being carried out at the Division of Building Research, National Research Council to achieve cost-effective and environmentally acceptable lighting systems that are optimized for energy efficiency, worker productivity and satisfaction. Other aspects of the work at DBR such as task-ambient lighting systems, visual performance, and visibility methods will be the subject of future reports.
The time-lapse photographic technique is invaluable in obtaining detailed information of just how people use light- ing energy and provides the basic data necessary to evaluate the cost-effectiveness of alternative conservation strategies. The remote wireless lighting energy monitor will provide, for the first time, accurate and comprehensive data on lighting
energy consumption for the various consumers. A number of lighting control systems are being developed with industry and this is regarded as an especially worthwile activity in view of the imminence of energy budget building codes.
REFERENCES
[I] D. K. Ross, "Energy conservation applied to task lighting," IEEE
Trans. Ind. Appl., vol. IA- 13, pp. 68-73, Jan./Feb. 1977. [2] Public Works Canada (private communication).
[3] "Measures for energy conservation in new buildings 1978," Associate Committee on the National Building Code, National Research Council of Canada, Ottawa, NRCC 16574, 1978.
[4] D. R. G. Hunt, "Simple expressions for predicting energy savings from photo-electric control of lighting," Light. Res. Tech., vol. 9, pp. 93- 102.
[5] R. T. Dorsey, "The potential for energy conservation in lighting,"
L.D: & A . , vol. 8, pp. 25-34, July 1978. [6] IES Code 1977 (U.K.).
[7] T. Kusuda and J. W. Bean, "Comparison between a simplified daylighting calculation procedure and a comprehensive interreflection model calculation prccedure," in Proc. 1978 3rd In;. Symp. Use of
Computers for Environment Engineering Related to Buildings, to be published.
Alan W. Levy received the B. Sc. (Honours) degree in chemical physics from the University of Kent, Canterbury, England, in 1969 and the Ph.D. degree from the Council for National Academic Awards (U.K.) in 1972.
While completing his Ph.D. work, he was working for Zenith Radio Research Corporation (U.K.) Ltd. Between 1972 and 1975 he carried out research under a postdoctoral fellowship on amorphous sernicon- ductors at the Clarendon Laboratory, Oxford Uni- versity, and in 1975 he joined the Building Research Establishment, Garston, U.K., to work on lighting. He joined the Division of Building Research, National Research Council of Canada, in 1977 and is presently the Head of the Energy and Services Section.
Dr. Levy is a member of the Illuminating Engineering Society and is actively involved in a number of technical committees. He is presently Chairman of the Recommendation on Quality and Quantity of Illumination (RQQ) technical committee. He is Secretary to the Canadian National Committee of the CIE, Canadian delegate to TC-4.2 Daylighting and holds the position of Executive Secretary to the NRC Office of Lighting Research.
This publication i s being distributed by the Division of Building R e s e a r c h of the National R e s e a r c h Courlcii of
Canada. I t should not be reproduced in whole o r in par:
without p e r m i s s i o n of the original publisher. The Di-
vision would be glad to be of a s s i s t a n c e in obtaining such permiseion.
Publications of the Division may be obtained by mail- ing the appropriate remittance ( a Bank, Express, o r P o s t Office Money Order, o r a cheque, made payable to the Receiver General of Canada, c r e d i t NRC) t o the National R e s e a r c h Council of Canada, Ottawa. K1A OR6
.
Stamps a r e not acceptable.A list'of a l l publications of the Division i s available and
may be obtained f r o m the Publications Section, Division of Building Research, National R e s e a r c h Council of Canada, Ottawa. KIA OR6.