HAL Id: hal-02338892
https://hal.archives-ouvertes.fr/hal-02338892
Submitted on 30 Oct 2019
HAL is a multi-disciplinary open access
archive for the deposit and dissemination of
sci-entific research documents, whether they are
pub-lished or not. The documents may come from
teaching and research institutions in France or
abroad, or from public or private research centers.
L’archive ouverte pluridisciplinaire HAL, est
destinée au dépôt et à la diffusion de documents
scientifiques de niveau recherche, publiés ou non,
émanant des établissements d’enseignement et de
recherche français ou étrangers, des laboratoires
publics ou privés.
An experimental study of dissolution and precipitation
of forsterite in a thermal gradient: implications for
cellular growth of olivine phenocrysts in basalt and melt
inclusion formation
Mickaël Laumonier, Didier Laporte, François Faure, Ariel Provost, Pierre
Schiano, Kazuhiko Ito
To cite this version:
Mickaël Laumonier, Didier Laporte, François Faure, Ariel Provost, Pierre Schiano, et al.. An
ex-perimental study of dissolution and precipitation of forsterite in a thermal gradient: implications
for cellular growth of olivine phenocrysts in basalt and melt inclusion formation. Contributions to
Mineralogy and Petrology, Springer Verlag, 2019. �hal-02338892�
UN
C
ORRECTED
PR
OOF
https://doi.org/10.1007/s00410-019-1627-x ORIGINAL PAPERAn experimental study of dissolution and precipitation of forsterite
in a thermal gradient: implications for cellular growth of olivine
phenocrysts in basalt and melt inclusion formation
Mickael Laumonier1 · Didier Laporte1 · François Faure2 · Ariel Provost1 · Pierre Schiano1 · Kazuhiko Ito3
Received: 6 December 2018 / Accepted: 3 October 2019 © Springer-Verlag GmbH Germany, part of Springer Nature 2019
Abstract
The morphology of crystals in magmas strongly depends on the temperature regime of the system, in particular the degree of undercooling and the cooling rate. To simulate low degrees of undercooling, we developed a new experimental setup based on thermal migration, in which large cylinders of forsterite (single crystals) immersed in haplobasaltic melt were subjected to a temperature gradient. As forsterite solubility is sensitive to temperature, the forsterite on the high-temperature side undergoes dissolution and the dissolved components are transported toward the low-temperature side where a layer of newly grown forsterite forms (up to 340 μm thick after 101 h). A striking feature is that the precipitation process does not produce a planar front of forsterite advancing at the expense of liquid: the growth front shows a fingered outline in planar section, with solid lobes separated by glass tubes that are perpendicular to the growth front. We ascribe this texture to cellular growth, a type of growth that had not been experimentally produced so far in silicate systems. We find that the development of cel-lular growth requires low degrees of undercooling (a few °C) and large crystal–liquid interfaces (~ 1 mm across or more), and that it occurs at a growth rate of the order of 10−9 m/s. We found natural occurrences of cellular growth on the rims of olivines from basanites, but otherwise cellular textures are poorly documented in natural volcanic rocks. Melt inclusions were produced in our experiments, showing that they can form in olivine at relatively slow rates of growth (10−9 m/s or lower).
Keywords Crystal growth and dissolution · Cellular growth · Temperature gradient · Melt inclusion formation · Thermal
migration
Introduction
Crystals and melt inclusions are precious tools to decipher the processes from magma production to final emplacement, and they have been the topic of an impressive amount of studies in the past decades. Melt inclusions are parcels of liquid trapped in crystals, which hold precious information on the chemical composition (major and trace elements, volatiles) of primitive magmas (Roedder and Bodnar 1980; Schiano 2003). Zoning patterns, shape and texture of crys-tals are a record of the composition of the liquid they grew from and the conditions during crystallization (Welsch et al. 2013). To decipher igneous processes, we need to know the growth mechanisms of minerals. The rate at which crystals grow is of particular interest to investigate the timescale of magmatic processes, such as magma ascent rate or crystal residence time in a reservoir prior to eruption (Armienti et al. 1994; Brewer 2000; Murphy et al. 2000; Blundy et al. 2006; Schiano et al. 2006; Humphreys et al. 2006; Morgan
Communicated by Timothy L. Grove.
Electronic supplementary material The online version of this
article (https ://doi.org/10.1007/s0041 0-019-1627-x) contains supplementary material, which is available to authorized users. * Mickael Laumonier
mickael.laumonier@gmail.com
1 Université Clermont Auvergne, CNRS, IRD, OPGC, Laboratoire Magmas et Volcans, 63000 Clermont-Ferrand, France
2
Université de Lorraine, CNRS, Centre de Recherches Pétrographiques et Géochimiques, 54501 Vandoeuvre Les Nancy, France
3 Faculty of Bioenvironmental Science, Kyoto Gakuen University, Kameoka, Kyoto 621-8555, Japan
1 2 3 4 5 6 7 8 9 10 11 12 13 14 15 16 17 18 19 20 21 22 23 24 25 26 27 28 29 30 31 32 33 34 35 36 37 38 39 40 41 A1 A2 A3 A4 A5 A6 A7 A8 A9 A10 A11 A12 A13 A14
Author Proof
UN
C
ORRECTED
PR
OOF
and Blake 2006; Castro and Dingwell 2009; Costa et al. 2010; Viccaro et al. 2012; Zellmer et al. 2012; Druitt et al. 2012; Eppich et al. 2012).
Crystal growth is controlled by a dominant rate control-ling process that defines the morphology of the crystal. Such processes are reaction at the crystal–melt interface, chemical diffusion in the melt or latent heat flow (Kirkpatrick 1975, 1981; Sunagawa 1981). The reactions at the crystal–melt interface are attachment mechanisms such as continuous growth, surface nucleation or screw dislocation. In this case, there are not significant compositional gradients in the melt along the interface. Diffusion controls the crystal growth when it is slower than attachment mechanisms. Growth con-trolled by chemical diffusion may produce spatial compo-sitional gradients and usually results in morphologies like skeletal or dendritic crystals. The mechanisms that define the crystal shape and size depend on the variation of extrinsic (temperature, pressure…) or intrinsic (chemical composi-tion, volatile content) parameters. A determinant parameter affecting the mechanism of crystal growth is temperature. In most cases, the increase of the crystal growth rate is attrib-uted to the cooling regime of the magmatic system (O’hara et al. 1968; Takei and Kobayashi 1974; Faure and Schiano 2005). For instance, the olivine growth shape switches from polyhedral, to skeletal and to dendritic with increasing degree of undercooling and cooling rate (Donaldson 1976; Faure et al. 2003a). This crystallization shape sequence does not include cellular growth that produces an intermediate morphology (between polyhedral and skeletal/dendritic) at relatively low growth rates. Cellular growth is well known in metallurgy but poorly documented in silicate minerals (Tiller et al. 1953; Keith and Padden 1963; Shechtman et al. 1984).
Most experimental studies of olivine crystal morpholo-gies were performed at relatively large undercooling degrees and cooling rates (Donaldson 1976; Jambon et al. 1992; Faure et al. 2003a, 2007; Faure and Schiano 2005; Gold-stein and Luth 2006), which are specific to scenarios like the emplacement of a small volume of magma at or near the Earth surface. However, the large abundance of dominantly polyhedral olivine phenocrysts in igneous rocks implies low degrees of undercooling and cooling rates in numer-ous natural magmatic environments. At present, the study of the effect of low undercooling degrees (≤ 10 °C) on crystal growth is nearly absent from the literature due to experi-mental limitations. To fill this gap, we conducted thermal migration experiments, in which large forsterite crystals immersed into a basaltic liquid were subjected to a low-temperature gradient (typically, 5–10 °C/mm). In the pres-ence of a thermal gradient, solid–liquid systems are known to undergo dissolution–precipitation processes that contrib-ute to mass transport and can strongly affect the develop-ment of cumulates in layered intrusions or the compaction
of partially molten rocks (Lesher and Walker 1988; Walker et al. 1988; Schiano et al. 2006; Sonzogni et al. 2011). At a smaller scale, a thermal gradient can cause the migration of a melt inclusion in its host crystal (Lesher and Walker 1988; Walker et al. 1988; Schiano et al. 2006; Sonzogni et al. 2011).
Figure 1 illustrates the concept of thermal migration (Buchwald et al. 1985; Lesher and Walker 1988; Walker and Agee 1988) and how it was adapted in our experimen-tal study. Thermal migration is a process of mass transport and phase redistribution in a mixture of crystals and liq-uid subjected to a temperature gradient. It comprises two components: chemical diffusion resulting from variations of mineral solubility with temperature, and thermodiffusion (Soret effect) resulting from differences in temperature in the liquid. We consider a simple binary system A–B, with crystals of phase A in suspension in an interconnected liquid phase. If this system is placed in a temperature gradient, then local equilibrium between phase A and liquid will impose a more A-rich liquid composition on the high-temperature side (T+ in Fig. 1), and a more B-rich composition on the low-temperature side (T− in Fig. 1). As the liquid is inter-connected, this gradient in liquid composition will give rise to chemical diffusion of component A from regions of high temperature to regions of low temperature, and of compo-nent B in the opposite direction. This process, which is dic-tated by local mineral saturation, is called saturation gradient chemical diffusion (Lesher and Walker 1988; Walker and Agee 1988). To maintain local equilibrium between crystals
Fig. 1 Illustration of saturation gradient chemical diffusion in a
binary system A–B. In contrast to the conventional usage, tempera-ture is increasing downwards to be consistent with the experimental conditions. The sketch on the right shows one of the configurations used to study forsterite growth and dissolution; a thin layer of liquid is placed between two forsterite monocrystals in a temperature gradi-ent. The small arrows indicate the displacement of the upper solid– liquid interface (growth front at temperature T−) and of the lower interface (dissolution front at T+). The large arrow shows the diffu-sion of dissolved forsterite components in the liquid
42 43 44 45 46 47 48 49 50 51 52 53 54 55 56 57 58 59 60 61 62 63 64 65 66 67 68 69 70 71 72 73 74 75 76 77 78 79 80 81 82 83 84 85 86 87 88 89 90 91 92 93 94 95 96 97 98 99 100 101 102 103 104 105 106 107 108 109 110 111 112 113 114 115 116 117 118 119 120 121 122 123
Author Proof
UN
C
ORRECTED
PR
OOF
and liquid, phase A must continuously dissolve on the high-temperature side and precipitate on the low-high-temperature side. In parallel to saturation gradient chemical diffusion, the liquid phase will also undergo thermodiffusion. In the case of basic silicate liquids, thermodiffusion leads to the trans-port of dissolved olivine components (MgO, FeO) toward the low-temperature side of the thermal gradient (Lesher and Walker 1986). Accordingly, in our study, Soret effect will assist saturation gradient chemical diffusion and lead to additional concentration of forsterite on the cold end of experimental charges.
In comparison to former thermal migration experiments (Lesher and Walker 1988; Walker and Agee 1988; Walker et al. 1988), the main difference in our study is that we replaced the small olivine crystals by large forsterite cyl-inders (single crystals). The most simple configuration is sketched in Fig. 1: it is composed of a thin layer of liquid between two forsterite monocrystals. Because of the differ-ence of temperature, the lower forsterite–liquid interface (at T+) will continuously dissolve, and the lower forster-ite–liquid interface (at T−) will continuously grow during the experiment. We show that studying the behavior of large monocrystals in a thermal gradient allows to bridge the gap between Ostwald ripening experiments, in which degrees of undercooling are ≤ 1 °C (Cabane et al. 2005), and cool-ing experiments, in which crystal growth data can only be obtained at degrees of undercooling of ≈ 10 °C or more (Donaldson 1976; Kirkpatrick 1981). Another advantage
of our experimental configuration is to provide at the same time an insight into the dissolution and crystallization pro-cesses at low degrees of superheating and undercooling, respectively.
Experimental procedure
Starting materials and experimental protocol
The experiments were run in the simplified system Na2O–CaO–MgO–Al2O3–SiO2 (Na–CMAS). The hap-lobasaltic glass was produced by Schott AG Company (see chemical compositions in Table 1) and crushed down into fine powder. Cylinders of forsterite 2–2.5 mm diameter were cored in a large synthetic monocrystal of pure Mg2SiO4 (Ito et al. 2003a, b) (Table 2). The thickness of the forsterite cyl-inders ranged from 0.6 to 2.3 mm. The faces of the cylcyl-inders were polished down to the micron. The starting materials were loaded in platinum capsules with an outer diameter of 3.0 mm and an inner diameter of 2.6 mm. The capsules were inserted into an assembly for a ¾-inch piston–cylinder apparatus with Pyrex glass and NaCl sleeves used as pres-sure medium and thermal insulator. All experiments were conducted at 10 kbar (1GPa) and 1400 or 1425 °C (Table 3). The temperature was generated by a graphite cylinder and read by a C-type (tungsten–rhenium alloy) thermocouple placed about 0.8 mm below the capsule. Prior to experiment,
Table 1 Electron probe
microanalyses of the glass (2σ)
a From M. Hardiagon (unpublished data)
b Anorthite content An is the Ca/(Ca + Na) molar ratio
Exp.# Location (number of analyses) SiO2 Al2O3 MgO CaO Na2O Total An Synthesisa Starting glass (54) 49.25 19.41 16.4 12.83 2.11 100 0.77
0.46 0.25 0.25 0.25 0.12 0.68 0.01
A4 Bath at the top (12) 49.52 17.63 19.18 11.80 1.87 100.34 0.78
0.29 0.56 0.36 0.33 0.18 0.76 0.02 Between pillars (32) 49.53 17.58 19.16 11.83 1.90 100.36 0.78 0.22 0.56 0.48 0.31 0.15 0.91 0.01 Bottom (17) 49.30 17.88 18.91 11.96 1.95 100.14 0.77 1.96 1.65 1.95 0.54 0.20 1.89 0.01 B6 Middle (78) 49.34 18.84 17.32 12.42 2.07 99.73 0.77 0.38 0.41 0.82 0.52 0.17 1.23 0.02 Top cyl. (23) 49.11 19.48 16.81 12.41 2.18 99.60 0.76 0.56 0.47 0.35 0.32 0.12 0.83 0.01 Melt inclusions
A2 Euhedral Fo, Fig. 6c (5) 50.32 22.96 8.53 13.51 2.89 98.20 0.72
0.56 0.48 0.20 0.74 0.36 0.84 0.02 A4 Overgrowth, Fig. 7c, d (5) 50.96 21.32 10.33 14.25 2.35 99.20 0.77 0.28 0.32 0.12 0.26 0.20 0.20 0.02 B1 Overgrowth, Fig. 5b (5) 49.17 19.99 13.84 14.24 2.06 99.31 0.79 0.84 0.67 1.18 0.42 0.26 0.58 0.01 AQ1 124 125 126 127 128 129 130 131 132 133 134 135 136 137 138 139 140 141 142 143 144 145 146 147 148 149 150 151 152 153 154 155 156 157 158 159 160 161 162 163 164 165 166 167 168 169 170 171 172 173 174 175
Author Proof
UN
C
ORRECTED
PR
OOF
the assemblage containing the capsule was stored at 150 °C for 12 h minimum. The experiments started with the pres-surization of the assembly to 3–4 kbar to ensure good elec-trical contacts between the graphite furnace and the power supplier without fracturing the solid pieces of the assembly. Then the temperature was raised to 650 °C (close to the
Pyrex glass transition) with a rate of 60 °C/min and kept constant for the end of the pressurization of the assembly. Once close to the target pressure (10 kbar), the temperature was increased to the desired set point (1400 or 1425 °C) and maintained constant during the experiment by a Eurotherm controller. Run duration ranged from 0 to 176 h. At the end
Table 2 Electron probe
microanalyses of the different types of forsterite (2σ): the cores of the monocrystalline cylinders; the overgrowth layers on the forsterite cylinders; the pillars on the dissolution side of the cylinders; the large euhedral forsterites that grew during the experiments; the small forsterite grains in suspension (“Fo bath”)
a Representative compositions of the inner part of the pillars (analyzed at 15–20 μm from the liquid)
Location Exp.# (number
of analyses)
SiO2 Al2O3 MgO CaO Na2O Total Mg/Si (Fo)
Cylinder core Starting (8) 42.83 0.02 57.15 0.00 0.00 100.76 1.99
0.45 0.03 1.04 − 0.01 0.01 1.22 0.04 A0 (6) 42.46 0.01 57.52 0.01 0.01 100.77 2.02 0.55 0.02 0.47 0.01 0.02 0.84 0.03 A4 (46) 42.82 0.02 57.13 0.01 0.01 101.18 1.99 0.66 0.03 0.66 0.03 0.02 1.22 0.01 B6 (48) 42.62 0.01 57.34 0.01 0.00 99.10 2.01 0.63 0.02 0.62 0.04 0.01 1.06 0.05 Cylinder overgrowth A4 (8) 43.21 0.13 56.41 0.24 0.01 101.80 1.95 0.40 0.08 0.66 0.13 0.03 0.72 0.03 B6 (14) 42.63 0.13 56.96 0.28 0.01 99.02 1.99 0.32 0.08 0.34 0.10 0.02 0.69 0.03 Cylinder pillarsa A4 (1) 42.87 0.05 56.96 0.12 0.01 101.30 1.98 B6 (1) 42.49 0.03 57.35 0.13 0.00 99.38 2.00 Euhedral Fo B6 (16) 42.56 0.14 57.00 0.28 0.01 99.23 2.00 0.68 0.04 0.69 0.04 0.03 0.61 0.05 Fo bath A4 (9) 42.73 0.14 56.84 0.28 0.02 100.22 1.98 0.32 0.04 0.36 0.03 0.04 0.61 0.03 Table 3 Summary of experimental conditions a
In type A experiments, a single forsterite cylinder was immersed into a mixture of glass (67 wt%) plus small forsterite grains (33 wt%). In type B experiments, a glass layer was placed between two forsterite cyl-inders (Fo1 is the upper cylinder; Fo2 the lower cylinder)
b Most cylinders were drilled along the a-axis of the forsterite lattice, except those in run B7 (parallel to
b-axis) and in run B8 (parallel to the c-axis); see Fig. S2
c Thermocouple temperatures: the temperatures at the hot post are about 20 °C higher than these tempera-tures (see Fig. S1)
d No Au–Pd sputtering
m Fo mass of forsterite in mg, m bath mass of the bath (glass or glass + small forsterite) in mg, height height of the forsterite cylinder(s), phases phases present in the run products (gl, glass; ol, olivine; cpx, clinopyroxene; spl, spinel)
Expa m Fo Fo axisb m bath m Fo/m bath Fo/gl Height (mm) Fo1; Fo2 T °Cc Duration (h) Phases A0 12.8 a-axis 25.8 0.33 0.55 1.02 1425 0.1 gl, ol A2d 31.2 a-axis 27.0 0.54 0.69 2.19 1400 176.0 gl, ol, cpx, sp A4 29.8 a-axis 36.4 0.45 0.63 2.10 1425 48.1 gl, ol B1d 11.7 a-axis 34.5 0.25 0.25 0.68; 0.58 1425 45.2 gl, ol, sp B6 32.0 a-axis 16.0 0.67 0.78 0.86; 1.41 1400 101.0 gl, ol B7 28.6 b-axis 14.8 0.66 0.77 1.05; 0.94 1400 50.4 gl, ol B8 47.1 c-axis 15.4 0.75 0.83 1.75; 1.53 1400 47.6 gl, ol B9 33.9 a-axis 15.5 0.69 0.79 1.24; 1.11 1400 22.9 gl, ol 176 177 178 179 180 181 182 183 184 185 186 187
Author Proof
UN
C
ORRECTED
PR
OOF
of the experiment, the sample was quenched by switching off the power, resulting in a cooling rate of ~ 80 °C/s, and then slowly decompressed to 1 bar. Details of the experimental conditions are presented in Table 3.
Setup geometry
In our experiments, a system composed of forsterite monocrystal(s) in contact with a haplobasaltic melt is sub-jected to a temperature gradient. In a first series of experi-ments, we used the experimental configuration A, in which a single forsterite crystal (Fig. 2a) about 1–2 mm thick is immersed in haplobasalt. In the final series, we used the configuration B, in which a liquid layer of the order of mm is sandwiched between two crystals (Figs. 1, 2b). Based on temperature calibration experiments, we adjusted the posi-tion of the capsule into the piston–cylinder assembly so that its bottom was less than 1 mm below the hot spot in every experiment (Figs. 2 & S1). Consequently, most of the cap-sule (70–80%) was above the hot spot and was subjected to a temperature decreasing upwards.
The principle of our thermal migration experiments is best explained by considering configuration B (Figs. 1, 2b). In type B experiments, the opposite faces of the cylinders are at temperatures T+ (upper face of lower cylinder) and
T− (lower face of the upper cylinder), with T+ > T−. Let us assume that the liquid is homogeneous at the beginning, with a composition in equilibrium with forsterite at the mean temperature (T+ + T−)/2. As forsterite solubility depends on temperature, the liquid is slightly oversaturated in forsterite on the colder side of the liquid layer, and undersaturated on the hotter side. This situation triggers a process of forsterite dissolution, transport, and precipitation. The driving force is
proportional to the temperature difference ΔT = T+ – T−, and we assume that the degree of undercooling along the upper face of the monocrystal and the degree of superheating on the lower face are equal to ≈ ΔT/2. Thus, for a thermal gra-dient of 6 °C/mm (typical of type B experiment; see below) and a melt thickness of 1 mm, the degree of undercooling driving forsterite growth will be 3 °C. Type B configuration provides a straightforward path for solute transport from the dissolution site to the precipitation site (Fig. 1).
In theory, the same reasoning applies to experimental configuration A (Fig. 2a), with a difference of temperature between the lower face of the forsterite monocrystal and its upper face equal to the thermal gradient times the thick-ness of the monocrystal. In this case, we expected the lower face of the forsterite to dissolve, the dissolved components to be transported upwards (in the thin melt layer between the forsterite and the platinum wall), and the upper face of the forsterite to crystallize. In practice (see “Results”), we observed that at the end of type A experiments, the plati-num capsule was pressed against the forsterite monocrystal and that there was almost no melt layer left to transport the dissolved forsterite components upwards. Hence, the upper and lower parts of the sample behaved as two independent subsystems in all type A experiments.
Sample preparation
In type A geometry (runs A0, A2 and A4; Fig. 2a; Table 3), the sample was composed of a forsterite cylinder embedded in a mixture of haplobasaltic glass and small grains of forst-erite (33 wt% forstforst-erite/67 wt% glass). The purpose of add-ing micron-sized grains of forsterite in type A experiments was to ensure a fast establishment of equilibrium between
Fig. 2 Sketch of the experimental geometries used for experiments of
types A (a) and B (b), with a typical qualitative temperature (T) dis-tribution along the capsule axis; the hot spot is located in the lower third of the capsule, 05–07 mm above the bottom. The height of the samples ranges from 3.1 to 5.1 mm. c Experiment A0 at time zero (t = 0.1 h; Table 3): SEM picture of the whole sample and
enlarge-ments of the upper and lower faces of the forsterite cylinder; the matrix is composed of small grains of forsterite and Na–CMAS basaltic glass. The bright small balls are metallic droplets produced by the destabilization of a thin layer of Au80Pd20 sputtered on the faces of the forsterite cylinder
AQ2 188 189 190 191 192 193 194 195 196 197 198 199 200 201 202 203 204 205 206 207 208 209 210 211 212 213 214 215 216 217 218 219 220 221 222 223 224 225 226 227 228 229 230 231 232 233 234 235 236 237 238 239 240 241 242 243 244 245 246 247 248 249
Author Proof
UN
C
ORRECTED
PR
OOF
forsterite and liquid at the beginning of the experiments. In type B geometry (runs B1, B6–9; Fig. 2b), a layer of pure haplobasaltic glass was sandwiched in between two forsterite cylinders.
In all type A experiments and in experiments B1, B6 and B9, the cylinders were drilled along the a-axis of the for-sterite lattice (i.e., perpendicular to (b, c) plane; see Fig. S2). Some cylinders were prepared differently to explore the effect of crystal orientation on growth mechanisms: cyl-inders of run B7 were prepared parallel to b-axis, and those in B8 were drilled along the c-axis of the starting forsterite single crystal (Fig. S2). The others axes of the cylinders were not constrained due to free rotation during their inser-tion in the capsule.
The faces of forsterite cylinders can advance or recede several hundred microns during an experiment due to pre-cipitation or dissolution, respectively. To measure precisely these displacements, it is necessary to be able to locate the initial position of the forsterite faces. We used a Denton Vacuum Coater to sputter the planar surfaces of each forst-erite cylinder with a layer of Au80Pd20 (except in two experi-ments, B1 and A2, to compare the dissolution and growth textures with and without gold–palladium sputtering). At run temperature, the thin layer (a few tens of nanometers) decomposes into an array of coplanar droplets, which mark the original surfaces without disturbing the dissolution and precipitation processes (Fig. 2c). The decomposition of the continuous Au–Pd layer into droplets is due to the fact that the experiments are run well above the melting temperature of the alloy and that when the alloy layer melts, it breaks down into droplets to minimize interfacial energy.
Thermal profile
Our experiments were conducted at constant temperature, the main driving force for forsterite growth and dissolution being the temperature difference along the sample height. In a piston–cylinder assembly, the temperature difference between the top and the bottom of a sample depends on its vertical position relative to the hot spot of the furnace (Fig. 2a). The thermal profile along the axis of our pis-ton–cylinder assemblies has been calibrated previously using either multiple temperature readings (up to five) at different heights or the reaction MgO + Al2O3 → spinel (Watson et al. 2002) (Fig. S1). These calibrations show that the position of the hot spot is rather well constrained: it is at 17 ± 0.5 mm from the basis of the assembly, with values closer to 16.5 mm at high temperatures (1200 °C and above). This is about the mid-height of the furnace (34.3 mm high, includ-ing a 1.3-mm-thick graphite disc at the top). In our experi-mental configuration, the thermocouple tip is located at a height of 14.5 mm, that is about 2 mm below the hot spot, and the temperature difference between the thermocouple
and the hot spot is 20 °C (note that the temperatures in Table 3 are the thermocouple temperatures; Fig. S1). There is a thin alumina disc separating the thermocouple tip and the platinum capsule, and the bottom of the silicate sample is located 0.5-0.7 mm below the hot stop (depending on the thickness of the platinum weld at the bottom of the capsule).
To estimate the temperature at the top of the capsules (the low-temperature side, on the opposite side to the thermocou-ple tip), we relied on two independent techniques: (1) the temperature calibration curve in Fig. S1, and (2) the appear-ance of secondary mineral phases (spinel and clinopyroxene) using the phase diagram of our CMAS–Na haplobasaltic composition as reference (M. Hardiagon, personal commu-nication). At 10 kbar, the liquidus temperature lies between 1450 and 1425 °C, and the liquidus phase is forsterite (Fo). The second solid phase that crystallizes at 10 kbar is spinel (Sp), which appears between 1400 and 1375 °C, and the third one is clinopyroxene (Cpx), which appears between 1350 and 1300 °C. At 1300 °C, Cpx and plagioclase (Pl) are stable, in addition to Fo and melt, while spinel is absent. To compute the temperature difference between the bottom and the top of the samples, we considered that the Spl- and Cpx-in temperatures are equal to 1385 (± 10 °C) and 1330 (± 20 °C), respectively.
The thermal data are summarized in Table 4. The tem-perature difference between the warmest and the coldest regions of a capsule ranges from 20 to 80 °C depending on the length of the capsule. The 80 °C difference corre-sponds to experiment A2, which was the one with the long-est capsule (5.1 mm); it is the only one in which Cpx was found at the top of the capsule (see below). The temperature difference between the two faces of a forsterite cylinder in type A experiments ranges from 8 to 25 °C, depending on their thickness and position in the capsule. The melt layer in type B experiments is placed about 1 mm above the hot spot; thus, the temperature difference across the glass layer between the two forsterite cylinders is less than ~ 10 °C and the thermal gradient is typically 5–6 °C/mm (Fig. S1), except in B1 (10 °C/mm) because the capsule was longer.
Analytical techniques
At the end of an experiment, the whole platinum capsule was mounted in epoxy, sectioned lengthwise, polished and carbon coated. Textures of the experimental products were observed with a JEOL JSM-5910 LV scanning electron microscope (SEM). Crystal fractions and sizes were deter-mined from SEM photographs of 2D sections (automatic threshold based on the gray level) using SPO2003 software (Launeau 2004). Crystal orientation and face recognition were done from interfacial angle measurements following Welsch et al. (2013). Chemical analyses of the run prod-ucts were made by electron probe microanalysis (EPMA) 250 251 252 253 254 255 256 257 258 259 260 261 262 263 264 265 266 267 268 269 270 271 272 273 274 275 276 277 278 279 280 281 282 283 284 285 286 287 288 289 290 291 292 293 294 295 296 297 298 299 300 301 302 303 304 305 306 307 308 309 310 311 312 313 314 315 316 317 318 319 320 321 322 323 324 325 326 327 328 329 330 331 332 333 334 335 336 337 338 339 340 341 342 343 344 345 346 347 348 349 350 351
Author Proof
UN
C
ORRECTED
PR
OOF
Table 4 Main c har acter is tics of e xper iment al pr oducts a Thic knesses bef or e and af ter the exper iments w er e measur ed wit h calipers and fr om SEM imag e, respectiv el y. In type A exper iments, ther e is onl y one cy linder (no. 1); in type B exper iments, cy linder 1 is t he upper f ors ter ite cy linder and cy linder 2 t he lo w er one b T em per atur e di ff er ences (fr om bo tt om t o top) and tem
per atur e g radients in absolute v alues; tem per atur es ar e decr easing upw ar ds c The column “Dissolution” giv es the thic kness of fors ter ite dissol v ed and the rate of dissolution. The thic kness of fors ter ite dissol v ed is eq ual to the initial cy linder thic kness plus the thic kness of t he g ro wt h la y er minus t he final cy linder t hic kness d The column “Gr o wt h” giv es t he t hic kness of t he g ro wt h la y er (eq ual t o t he dis tance fr om t he alignment of A u–Pd dr ople ts t o t he g ro wt h fr ont) and t he r ate of g ro wt h e “Size” cor responds t o t he r adius of t he lar g es t euhedr al cr y st als Exp# Thic kness a cy linder 1 Thic kness a cy linder 2 T em per atur e Cy linder 1 Euhedr al F o g ro wt h e Dissolution c Gr o wt h d Bef or e Af ter Bef or e Af ter R atio F o1 R atio F o2 Bulk r atio Sam ple height (mm) Dif- fer ence b (sam ple) A v er ag e g radient b (°C/ mm) Thic k . (mm) R ate (m/s) × 10 10 Thic k . (mm) R ate (m/s) × 10 10 Size (mm) R ate (m/s) ×10 10 A0 1.01 1.00 0.99 0.99 A2 2.14 2.12 0.99 0.99 5.07 80 15.8 0.33 5.3 0.31 5.0 0.13 2.1 A4 2.10 2.11 1.00 1.00 4.45 45 10.1 0.19 10.7 0.20 11.3 0.05 2.9 B1 0.68 0.76 0.58 0.36 1.12 0.62 0.89 4.48 45 10.0 0.12 7.4 0.20 12.3 0.10 6.2 B6 0.86 0.83 1.41 1.18 0.97 0.84 0.89 3.43 20 5.8 0.33 9.1 0.34 9.4 0.19 5.2 B7 0.99 nd 1.08 nd nd nd 3.11 20 6.4 nd 0.11 6.3 0.06 53.3 B8 1.57 1.52 1.71 1.51 0.97 0.88 0.92 4.27 20 4.7 nd 0.17 10.1 0.07 4.1 B9 1.15 1.11 1.28 1.18 0.97 0.92 0.94 3.33 20 6.0 nd nd 0.06 6.7
Author Proof
UN
C
ORRECTED
PR
OOF
using a Cameca SX 100. Analytical conditions were focused beam (< 1 μm)—15 nA and 22 kV for crystals—and unfo-cused beam (< 15 μm)—8 nA and 15 kV for glasses—dur-ing 10 + 20 + 10 s (background, sample, background). The probe was calibrated using wollastonite, corundum, albite and forsterite standards.
Results
The textural results are illustrated in Figs. 3, 4, 5, 6, 7, and supplementary Figures S3 and S4. In all figures, the polarity of the sample during the experiment is respected (that is, the lower part of the microphotograph corresponds to the bottom of the sample in the hot spot). The location of electron probe microanalyses is shown using the same shape and color
codes in Figs. 3, 4, 5, 6, and 7. If we put aside experiment A0 that was quenched shortly after heating, major changes in the thickness of the forsterite cylinders and in the shape of their surfaces occurred during all experiments due to dis-solution and precipitation processes.
Dissolution and precipitation textures: type B
experiments
Experiments B6–B9 (Figs. 3, 4, S3–S4) show the evo-lution of type B geometry with increasing duration (at
T = 1400 °C). This geometry is designed to produce a dis-solution/precipitation process in three steps (Fig. 1): (1) dis-solution of the upper face of the lower cylinder, which is at a higher temperature; (2) solute transport upwards through the melt layer; (3) precipitation along the lower face of the
Fig. 3 SEM photographs of experiment B6 (1400 °C, 101 h). a
Overview of the sample at low magnification. Black regions are due to decompression cracks and crystal snatching, white areas are the platinum capsule, and bright and dark gray are glass (gl) and forst-erite (Fo), respectively. b Enlargement of the upper part of the sam-ple showing dissolution of the upper face of forsterite cylinder 1 and crystallization of large euhedral forsterite hosting melt inclusions (MI). The dissolution of the upper part of the cylinder is indicated by the Au–Pd droplets deposited on its surface and by the gap between the glass–cylinder interface and the capsule shrinkage (dashed orange arrow). The a-axis direction is indicated by an arrow. c Enlargement
of the lower face of the upper forsterite cylinder experiencing crys-tallization. The alignment of bright metallic droplets (Au–Pd) marks the initial forsterite cylinder surface, allowing the determination of the cylinder overgrowth (yellow arrow). Symbols and segments are EPMA spots and chemical profiles, respectively (see Figs. 8, 9). In this figure and the following ones, the polarity of the sample during the experiment is respected; the upper part of the microphotograph corresponds to the top of the sample. Crystal orientation in (C) was determined from interfacial angles indexation following (Welsch et al.
2013) AQ3 352 353 354 355 356 357 358 359 360 361 362 363 364 365 366 367 368 369 370 371 372 373 374 375 376 377 378
Author Proof
UN
C
ORRECTED
PR
OOF
upper cylinder (at a lower temperature). The most obvious textures are those associated with step (3), especially after 101 h and 48 h (Figs. 3c, 4b). In these figures, an alignment of Au–Pd droplets is visible deep inside the forsterite cyl-inder: it corresponds to the Au–Pd layer that was sputtered on the original surface. The thickness of the precipitated layer (measured from the alignment of Au–Pd droplets to the forsterite front) measures 170 μm after 48 h and 340 μm after 101 h. As presented below, the alignment of Au–Pd droplets corresponds also to a compositional limit (for minor elements: Al, Ca) between the starting synthetic forsterite and the newly grown forsterite.
A striking feature is that the precipitation process does not produce a planar front of forsterite advancing at the expense of liquid. There is a kind of self-organization that develops, in which domains of faster growth give rise to forsterite lobes protruding into the liquid. As a result, the growth front shows a fingered outline in two dimensions (2-D), with solid lobes separated by tubes of glass that are roughly perpendicular to the growth front (Figs. 3c, 4b). The average lobe spacing is of the order of 0.1 mm (that is, 10 lobes per mm of interface). The longest tubes can be up to ~ 150 μm deep, but are still shorter than the growth layer (that is, they do not reach the alignment of Au–Pd droplets). The lobes are elongated parallel to the orienta-tion of the forsterite cylinder: parallel to a-axis in run B6 and parallel to c-axis in run B8. Facets controlled by the crystallographic orientation of the cylinder develop at the growth front (Figs. 3c, 4b, S3C and S4B); in Fig. 3c, these crystallographic facets join to form pyramids with sharp edges. In some cases, neighboring lobes merge at their ends and thus entrap melt in the observed section. We checked
by optical microscopy that some of these regions of trapped melt in 2-D are real glass inclusions in 3-D (i.e., inclusions totally closed).
As expected, the upper face of the lower cylinder receded due to dissolution. This is not obvious at first glance because it remained almost flat (Figs. 3a, 4c, S3A, S4C). In experi-ment B9 (23 h; Fig. S4C), the slightly curved alignexperi-ment of Au–Pd droplets visible in the glass few tens of μm above the forsterite cylinder demonstrates that the upper part of the lower cylinder has been dissolved. The Au–Pd align-ment is no longer visible in the longer duration experialign-ments, but there are still a few larger Au–Pd droplets visible either suspended in the glass or fallen on the receding forsterite surface (Fig. 4c). The dissolution of the lower cylinder is also demonstrated by the downward displacement of the upper surface compared to its initial position marked by the shrinkage of the capsule (displayed by an orange arrow on Fig. 3a). This shrinkage is due to a higher degree of compac-tion of glass powder compared to forsterite cylinder during the compression at the beginning of the experiment. Finally, the forsterite right below the receding surface has levels of CaO and Al2O3 recalling those in the starting synthetic for-sterite and lower than those expected at equilibrium with the haplobasaltic melt (see below).
In our first type B experiment (B1), we used a slightly different initial configuration, including forsterite cylinders with a smaller outer diameter (2 mm instead of 2.5 mm). Figure 5a shows that this configuration was not stable and that the upper forsterite cylinder fell into the lower part of the liquid reservoir. We observe, however, the same textures as above: dissolution along the top of the lower cylinder produced a flat surface and rounded cylinder edges, and
Fig. 4 SEM photographs of experiment B8 (1400 °C, 48 h). a
Over-view of the sample at low magnification. b Enlargement of the lower face of the upper forsterite cylinder, showing the fingered outline of the forsterite–liquid interface; the yellow arrow gives the thickness of
the precipitated layer. c Enlargement of the upper face of the lower forsterite cylinder: the receding surface is almost perfectly flat. There are some Au–Pd droplets suspended in the glass or fallen on the for-sterite surface 379 380 381 382 383 384 385 386 387 388 389 390 391 392 393 394 395 396 397 398 399 400 401 402 403 404 405 406 407 408 409 410 411 412 413 414 415 416 417 418 419 420 421 422 423 424 425 426 427 428 429 430 431 432 433 434 435 436 437 438 439 440 441 442
Author Proof
UN
C
ORRECTED
PR
OOF
precipitation at the base of the upper cylinder yielded a fin-gered interface, with glass tubes separating solid lobes ter-minated by crystallographic facets (110) (Fig. 5b). The melt inclusions are especially well developed in this experiment, reaching up to 80 μm and showing a range of shapes from rounded, to ovoid, to negative crystals. A section perpen-dicular to the growth front is illustrated in Fig. 5c. On a tech-nical point of view, it is interesting to note that experiment B1, in which the forsterite cylinders were not sputtered with Au–Pd, shows the same microtextures as in experiments with Au–Pd-sputtered forsterite cylinders. Accordingly, the precipitation and dissolution processes are not affected by the presence of droplets of gold–palladium.
Unlike the sketch in Fig. 2b, some of the liquid was able to sneak above the upper cylinder during type B experiments (and to a lesser extent under the lower forsterite cylinder).
As a result, a second dissolution–precipitation cell operated at the top of the capsule, as a parallel system. The effect is best visible in experiment B6 (Fig. 3), with the recession of the upper face of the top forsterite cylinder and the growth of large euhedral crystals of forsterite hanging from the roof of the capsule. The dissolution of the upper face left a few vertical pillars of forsterite standing several hundreds of microns above a slightly wavy floor (on the right of Fig. 3b). These special features are best visible in type A experiments and will be discussed below.
Dissolution and precipitation textures: type
A experiments
A major complication arose in runs A2 (1400 °C, 176 h; Fig. 6) and A4 (1425 °C, 48 h; Fig. 7) due to the absence of
Fig. 5 SEM photographs of experiment B1 (1425 °C, 45 h). a
Over-view of the sample at low magnification, showing the two cylinders at the bottom and a layer of large euhedral forsterite (with a few small spinel crystals) at the top. b Enlargement showing precipitation microtextures on the lower face of the upper forsterite cylinder, and
the flat dissolution surface on the top of the lower cylinder. Note the planar facets at the ends of the forsterite lobes and the melt inclusions (MI) and tubes. The orange dashed line corresponds to the position of the cross section shown in c. c Cross section through the growth front on the lower side of the upper forsterite cylinder
443 444 445 446 447 448 449 450 451 452 453 454 455 456 457 458 459 460 461 462 463 464 465 466 467 468 469 470 471 472
Author Proof
UN
C
ORRECTED
PR
OOF
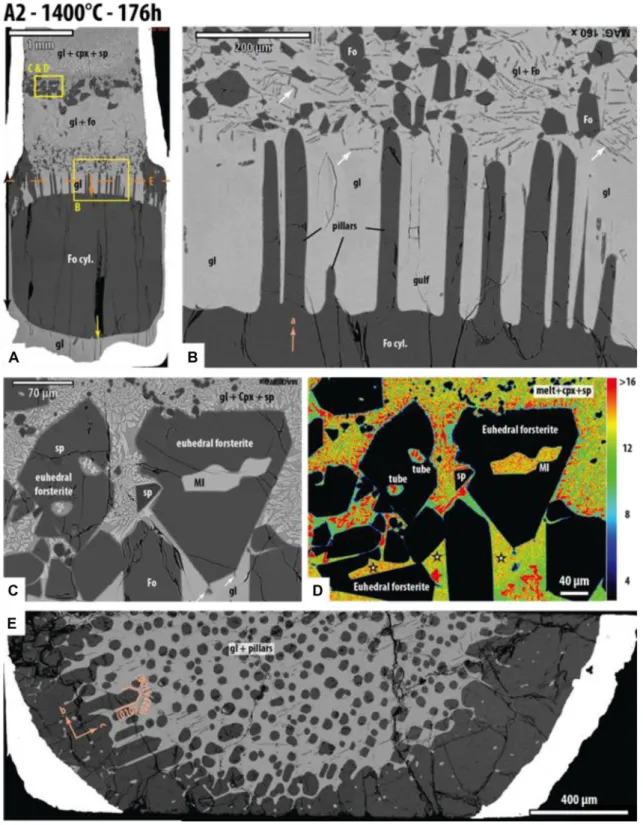
Fig. 6 SEM photographs of experiment A2 (1400 °C, 176 h). a
Over-view of the sample at low magnification showing its mineralogical stratification. The orange arrow shows the thickness of forsterite dis-solved on the upper side of the cylinder; the kinks in the platinum wall mark the initial position of the upper surface of the forsterite cyl-inders before dissolution. The yellow arrow indicates the thickness of forsterite precipitated on the lower side. The orange dashed line cor-responds to the position of the cross section shown in (E). b Close-up view of the upper part of the forsterite cylinder: pillars of residual
for-sterite stand several hundreds of microns above the receding surface; note the small grains of forsterite suspended in glass above the disso-lution zone. The forsterite dendrites (white arrows) presumably grew during quench. c SEM micrograph (back-scattered electrons) of large euhedral forsterite in the upper part of the capsule. d Calcium map of the same area (with concentration scale in wt% CaO on the right). e Cross section through the layer of forsterite pillars and glass in b. Sp spinel, Cpx clinopyroxene, Fo forsterite, gl glass, MI melt inclusion
UN
C
ORRECTED
PR
OOF
connection or the poor connection between the lower face of the forsterite cylinder and its upper face. As a result, the sys-tem did not work as sketched in Fig. 2A because two inde-pendent subsystems developed in the lower half and upper half of capsules. In the lower half, the lower face of the forsterite cylinder grew at the expense of the small forsterite grains at the bottom of the capsules, giving rise to crystal-free layers right below the forsterite cylinder (Figs. 6a, 7c). Forsterite overgrowth is best visible in run A4 owing to the presence of a distinct alignment of Au–Pd droplets in the cylinder, 200 μm behind the front. In the upper half of the capsules, the upper face of the forsterite cylinder underwent dissolution (see below) and large, euhedral forsterite crystals grew at the top of the capsules (Figs. 6a, 7a). These crys-tals are ≈ 100–800 μm in size. They have euhedral outlines, with planar faces and sharp edges; some of them show large embayments and contain glass inclusions (Fig. 6c). Large euhedral crystals are actually present in all experiments of A and B types (Figs. 3, 4, 5, 6, 7, S3 and S4). In all cases, they are located at the top of the capsule, which is the coldest
part of the system. In experiment A2, they are not right at the top, but just below a layer of clinopyroxene + spinel + glass, which occupies the upper part of the capsule (Fig. 6a).
Type A experiments show a very special kind of disso-lution texture: in experiments A2 and A4, the upper face of the forsterite cylinder displays vertical pillars standing several hundreds of microns above a slightly wavy floor (Figs. 6b, 7b). There is no doubt that these pillars represent a dissolution texture because we found some Au–Pd drop-lets kept at the top of the pillars or hanging on their walls (Fig. 7e; they are absent in run A2, in which the forsterite cylinder had not been sputtered with Au–Pd), and because the forsterite making the pillars has low levels of CaO and Al2O3, which approach the levels of the starting synthetic forsterite and which are lower than those measured in forst-erite grown from the haplobasaltic melt (see below). In addi-tion, all overgrowth layers show a very distinct alignment of entrapped Au–Pd droplets underlining the original forsterite surface (for example, sample A4 in Fig. 7c); as we do not see any Au–Pd droplets entrapped at the basis of the pillars in
Fig. 7 SEM photographs of
experiment A4 (1425 °C, 48 h).
a Overview of the sample at low magnification. b Close-up view of the dissolution texture at the top of the forsterite cylinder, with pillars of residual forsterite almost 200 μm high. Small grains of forsterite are suspended in the glass above the dissolution zone. c Close-up view of the precipitation layer at the bottom of the forsterite cylinder; the layer of Au–Pd droplets is well visible. White arrows: quench overgrowths. Symbols and segments are EPMA spots and chemical profiles, respectively (see Figs. 8, 9). d Chemical map of magnesium in part of image (c).
e Chemical map of magnesium in part of image (b) 473 474 475 476 477 478 479 480 481 482 483 484 485 486 487 488 489 490 491 492 493 494 495 496 497 498 499 500 501 502 503 504 505 506 507 508 509 510 511 512
Author Proof
UN
C
ORRECTED
PR
OOF
Fig. 7b, the forsterite pillars are not growth textures. There is also a geometrical argument because the initial position of the upper face of the cylinder is marked by a kink in the platinum wall (Figs. 6a, 7a); the vertical pillars are well inside the original outline of the forsterite cylinders. Finally, we observe that small forsterite crystals (from the starting material) are present in the glass above the dissolution zone, but not in the dissolution zone between the pillars (e.g., the “gulfs” in Fig. 6b).
We prepared a cross section through the layer of forst-erite pillars and glass of sample A2 (Fig. 6e). In the center of the sample, the pillars form numerous, sub-rounded sec-tions isolated in glass with ~ 35 μm diameter and a density of 254 pillars per mm2 (Fig. 6e). Toward the rim, the for-sterite increases in proportion relative to glass and it forms polyhedral sections or rods. It is important to note that the forsterite sections from all sides of the capsule display the same crystallographic orientation, which demonstrates that all these crystal units correspond to the same initial forsterite crystal before dissolution. In addition to the forsterite pillars in experiments A2 and A4, a few pillars are also observed in experiment B6 (Fig. 3a, b). Given the crystallographic orientations of the forsterite cylinders in these experiments, the pillars are all elongated preferentially along the a-axis of forsterite.
Mineralogical stratification and temperature
gradient
The presence of Sp or Sp + Cpx (in addition to Fo + melt) primarily depends on the nominal temperature of the experi-ment (1400 or 1425 °C) and on the length of the capsule (3.1–5.1 mm; Table 4). Clinopyroxene was only found
at the top of experiment A2 (Fig. 6), which was made at 1400 °C with a capsule length > 5 mm. Thus, this combina-tion resulted in a temperature lower than 1330 °C at the very top of the capsule. A few small Sp crystals, but no Cpx, were observed in the layer of large euhedral forsterites at the top of experiments B1 and A4, indicating a temperature lower than 1385 °C but higher than 1330 °C. Again, the presence of an additional phase is related to the length of the samples (4.5 mm). In all other experiments (B6–B9), the capsule length was < 4.3 mm, and the only solid phase was forsterite even when the nominal temperature was 1400 °C. If we take into account the temperature difference between the ther-mocouple reading and the maximum temperature at the hot spot (Watson et al. 2002), the temperature interval in these experiments was < 35 °C (Table 4).
Chemical results
Chemical compositions of forsterite are presented in Fig. 8a and Table 2. Three main populations can be identified: com-positions similar to the starting forsterite, comcom-positions in equilibrium with the haplobasaltic melt at experimental con-ditions and intermediate ones. The starting forsterite is char-acterized by a molar ratio Mg/Si of about 1.99, and negligi-ble levels of CaO and Al2O3 (< 0.02 wt%). The population similar to the composition of starting forsterite has CaO and Al2O3 concentrations lower than 0.05 wt% and corresponds to the inner parts of forsterite cylinders, from the interface on the dissolution side to the initial forsterite–melt interface revealed by the alignment of Au–Pd droplets (Figs. 3, 7, 8a). The equilibrium forsterite composition is best represented by the small forsterite grains in experiments such as A4, which have an average Mg/Si ratio of 1.98 and concentrations of
Fig. 8 a Diagram CaO vs. Al2O3 showing the composition of forst-erite in experiments A4 and B6. “Equil. (new cryst.)” corresponds to CaO and Al2O3 concentrations in equilibrium with the haploba-salt used here, according to partition coefficients in the literature (Libourel 1999; Pack and Palme 2003). b Diagram MgO vs Al2O3
showing glass compositions in experiments A4 and B6. The location of analyses is shown in Figs. 3 and 7. Quench crystallization of forst-erite at the end of the experiments led to glass compositions locally strongly depleted in MgO and enriched in Al2O3 (see also Fig. 9)
513 514 515 516 517 518 519 520 521 522 523 524 525 526 527 528 529 530 531 532 533 534 535 536 537 538 539 540 541 542 543 544 545 546 547 548 549 550 551 552 553 554 555 556 557 558 559 560 561 562 563 564 565 566 567 568 569 570 571 572 573 574
Author Proof
UN
C
ORRECTED
PR
OOF
CaO and Al2O3 equal to ~ 0.30 and 0.15 wt%, respectively (Table 2). These relatively large concentrations are typical of forsterite in equilibrium with basaltic melts at high tem-peratures (Libourel 1999). For Al2O3, the data in sample A4 yield a forsterite/liquid partition coefficient of ~ 0.01, consistent with values of 0.003–0.02 reported by (Pack and Palme 2003) (Fig. 8a). The layers of forsterite overgrown on the initial cylinders and the large, euhedral forsterite crystals are also in equilibrium with the haplobasaltic melt.
The intermediate population of forsterite compositions is associated with the pillars in the dissolution zones, with CaO concentrations approaching the equilibrium defined above and low aluminum contents (< 0.10 wt%; Fig. 8a). In fact, there is a gradient from the inner parts of the pillars, which have very low levels of CaO and Al2O3 (down to 0.12 wt% and 0.03 wt%, respectively; Table 2) to the rims in contact with haplobasalt, which contain significant concentrations of these two oxides, especially CaO (Fig. S5). The low levels of CaO and Al2O3 in the inner parts of the pillars are a strong argument for an origin of this special texture by dissolu-tion. The enrichment in CaO and Al2O3 in the outer parts is presumably due to a process of reequilibration with the surrounding melt, with CaO diffusing faster than Al2O3 in the forsterite crystalline lattice. The effect of solid-state dif-fusion can also be observed along profiles performed across the Au–Pd droplet alignments (Fig. 9a); the CaO concen-tration profiles measured in B6 and A4 experiments show different slopes that are consistent with the run durations. The dissolution side of forsterite cylinders is also likely to be affected by calcium diffusion up to ~ 80 μm from the melt.
Glass compositions analyzed in experiments A4 and B6 are shown in Fig. 8b. The interpretation of glass composi-tions is complicated by the late crystallization of forsterite during the quench, which results in a strong depletion of MgO (down to 14 wt%) and enrichment in CaO and Al2O3 (Fig. 8b). In fact, MgO depletion is observed over a thick-ness of several tens of micrometer wherever the glass is in contact with forsterite and is particularly visible in tubes on the precipitation side and in gulfs close to pillars on the dis-solution side of forsterite cylinders (e.g., Fig. 7d–e). Putting aside the compositions analyzed close to forsterite, the glass contains in average ≈ 19.1 wt% MgO and 17.8 wt% Al2O3 in sample A4, and ≈ 16.8 wt% MgO and 19.5 wt% Al2O3 in sample B6 (Table 1). Glass B6 is close to the starting glass (16.4 wt% MgO and 19.4 wt% Al2O3) whereas glass A4 is strongly enriched in MgO and depleted in Al2O3 in comparison to the starting glass, indicating bulk forsterite dissolution during this experiment. The difference in glass compositions between A4 and B6 is due to the difference in temperature: 1400 °C in run B6 vs. 1425 °C in run A4. Accordingly, the average MgO content in melt increases by 2–2.5 wt% for a temperature increase of 25 °C, that is, a variation of 0.08–0.1 wt% MgO/ °C.
The melt inclusions of experiments A2, A4 and B1 are texturally homogeneous with no crystals discerned but chemical mapping reveals a heterogeneous distribution of calcium or magnesium (Figs. 6d, 7d). Chemical gradients in glass inclusions are due to crystallization of the host forster-ite during the quench. Even the cores of the glass inclusions yield compositions depleted in MgO (8.5–14 wt%; Table 1) in comparison to the compositions measured far from any forsterite. Accordingly, they do not reflect equilibrium con-ditions. Based on the compositions of forsterite, equilibrium glass composition, and glass in the melt inclusion of experi-ment A4 (Fig. 7a), we estimate that about 24 wt% of the melt inclusion crystallized during the quench, forming a layer of forsterite a couple of microns thick along the walls.
Rates of dissolution and growth
The growth rate (vGrowth, m/s) of the cylinders was deter-mined from the maximum thickness of the growth layer (beyond the Au–Pd sputtering line) divided by run duration (Fig. 10). Similarly, the growth rate of euhedral crystals was calculated by dividing the mean size of the largest crystals
Fig. 9 a Chemical profiles (CaO) of forsterite in A4 and B6 vs.
dis-tance from the face of the cylinder at the beginning of the experiment (marked by Au–Pd sputtering). b Chemical profiles (MgO) in the glass in experiments A4 and B6 vs. distance. The concentration of the starting glass is indicated. See Figs. 3 and 7 for the location of the chemical profiles 575 576 577 578 579 580 581 582 583 584 585 586 587 588 589 590 591 592 593 594 595 596 597 598 599 600 601 602 603 604 605 606 607 608 609 610 611 612 613 614 615 616 617 618 619 620 621 622 623 624 625 626 627 628 629 630 631 632 633 634 635 636 637 638 639 640 641 642 643 644 645 646 647
Author Proof
UN
C
ORRECTED
PR
OOF
by time. To estimate the dissolution rate, we computed the thickness of the dissolution layer as the initial cylinder thick-ness plus the thickthick-ness of the growth layer minus the final cylinder thickness. The thickness of dissolved forsterite can always be closely confirmed by measuring the distance between the final position of the cylinder surface and its ini-tial position marked by the kinks of the capsule wall due to shrinkage, assuming no displacement of the cylinder. In type B experiments, only the upper cylinder was characterized so, because it gives access to both dissolution and growth. The growth rates and dissolution rates range from 5.0 × 10⁻¹⁰ to 1.2 × 10⁻⁹ m/s (Table 4; Fig. 10). The growth rate of large, euhedral forsterite ranges from 2 × 10⁻¹⁰ to 7 × 10⁻¹⁰ m/s.
Discussion
Thermal migration as a technique to study growth
and dissolution of crystals in silicate liquids
We were able to produce regular growth or dissolution layers reaching thicknesses up to 400 μm by placing monocrys-talline cylinders of forsterite into a haplobasaltic melt in a temperature gradient. Of the two experimental configura-tions tested (Fig. 2a, b), type B involving a layer of melt sandwiched between two forsterite cylinders is by far the more suitable for a quantitative study (Fig. 1). The main advantage is that the transport step of the dissolution/pre-cipitation process is straightforward in comparison to type A experiments, in which the dissolved forsterite components have to find their way between the cylinder wall and the cap-sule. A potential improvement for the future would be to use forsterite cylinders whose faces correspond to natural faces of olivine phenocrysts. Our experiments show, however, that
similar growth and dissolution textures develop on starting surfaces with different crystallographic orientations. Sput-tering a thin layer of Au–Pd over the cylinder faces is of great help to locate the initial forsterite–melt interfaces and to quantify the thickness of the growth layers. Since the same textures are observed in experiments with and without sputtering, the thin layer of gold–palladium does not seem to disturb the dissolution/precipitation processes as long as experiments are run at temperature above the melting point of Au–Pd.
As discussed in “Introduction”, thermal migration encompasses two diffusion potentials that operate simulta-neously: saturation gradient chemical diffusion and Soret diffusion. To evaluate the relative importance of these two components, we computed separately the variations of melt composition arising from Soret effect and saturation gra-dient. Using the Soret coefficients for SiO2, Al2O3, MgO, CaO and Na2O determined experimentally for a MORB composition (Lesher and Walker 1988; Walker and Agee 1988), the composition of melt in experiment B6 (16.81 wt% MgO; Table 1), and considering two points separated by 1 °C, we obtain a variation of MgO equal to 0.45 × 10⁻³ in molar fraction (or a variation of 0.03 wt% MgO). This is almost three times smaller than the variation of MgO due to saturation: 1.19 × 10⁻³ in mole fraction per °C (based on the difference in liquid compositions in the experiments at 1400 and 1425 °C, B6 and A4, respectively). Accordingly, the dominant process in our thermal migration experiments is saturation gradient chemical diffusion, but Soret effect is not negligible.
The total flux, J (in moles per unit area per unit time), associated with thermal migration is (Lesher and Walker 1988; Walker and Agee 1988)
.
where the first term on the right-hand side is the flux arising from saturation gradient chemical diffusion, and the second term is the flux arising from the temperature gradi-ent alone. Parameters are as follows: D (cm2/s), chemical diffusivity; D’ (cm2/s/ °C), thermal diffusion coefficient; c (mol/cm3), solute concentration; z (cm), position along the diffusion axis; T (°C), temperature. Introducing the Soret coefficient σ = D′/D (°C−1), Eq. (1) can be rewritten:
where [dc/dT]Liq is the variation of concentration with tem-perature along the liquidus. Equation (2) shows that the flux
J is directly proportional to the temperature gradient and is constant as long as the saturation relations and temperature remain unchanged (Lesher and Walker 1988; Walker and Agee 1988). (1) J = −Dd c d z − D ′cd T d z, (2) J = −DdcdTLiq + 𝜎cdTdz,
Fig. 10 Growth and dissolution rates of the forsterite cylinder plotted
as a function of temperature gradient. The growth rate of large, euhe-dral forsterite crystals is also shown
648 649 650 651 652 653 654 655 656 657 658 659 660 661 662 663 664 665 666 667 668 669 670 671 672 673 674 675 676 677 678 679 680 681 682 683 684 685 686 687 688 689 690 691 692 693 694 695 696 697 698 699 700 701 702 703 704 705 706 707 708 709 710 711 712 713 714 715 716 717 718 719 720 721 722 723 724 725 726 727
Author Proof
UN
C
ORRECTED
PR
OOF
In our experimental configuration (Fig. 1), there is a direct relationship between the upward flux of MgO by thermal migration, JMgO, and the growth rate of the upper forsterite cylinder:
where vGrowth is the growth rate (cm/s) and VFo is the molar volume of forsterite (≈ 46 cm3/mol in our experimental con-ditions; (Li et al. 2007)). Thus, if as expected, the flux is time independent, then the growth rate of forsterite remains constant during a thermal migration experiment. Using the relation c = mρ/M, where m is the mass fraction of an oxide,
M its molar mass, and ρ is the liquid density (assumed con-stant: 2.7 g/cm3), we can recombine (1) and (3) into
For experiment B6, we have vGrowth = 9.4 × 10⁻⁸ cm/s,
mMgO = 0.1681, dmMgO/dz = − 0.05 cm−1 (Fig. 9b), dT/ dz = − 58 °C/cm (Table 4); the Soret coefficient σMgO is equal to 0.00239 (Lesher and Walker 1988; Walker and Agee 1988). Thus, we obtain a chemical diffusivity DMgO equal to 7.8 × 10⁻⁷ cm2/s, which is in good agreement with the chemical diffusivity estimated from previous thermal migration experiments run at conditions close to ours: D ≈ 10−6 cm2/s (Walker et al. 1988).
Dissolution and growth of forsterite
in a temperature gradient
The eight experiments of this study yielded qualitatively similar dissolution and growth textures: a planar or slightly wavy forsterite–melt interface, residual pillars (mostly in type A experiments), and rounded cylinder edges in dis-solution areas; fingered forsterite–melt interfaces with melt tubes and melt inclusions in the growth areas. We, therefore, conclude that these textures are independent of temperature over the small range investigated (1400–1425 °C; Table 3), forsterite over glass ratio (in the range 0.25–0.83; Table 3), and run duration (no qualitative difference between experi-ments A2 and A4 conducted for 176 and 48 h, respectively). Concerning the dissolution textures, the smooth melt–crystal interfaces and rounded cylinder edges produced here are similar to textures described in previous experi-mental work (Zhang et al. 1989; Donaldson 1990; Soulié et al. 2017). The pillars represent, however, an original texture undocumented in the literature to our knowledge, and do not follow the rule that olivine dissolution produces almost perfect planar interfaces (Zhang et al. 1989; Chen and Zhang 2008). We suggest the following scenario. At the beginning of the experiment, the upper face of the cylinder (3) vGrowth= 1 2JMgOVFo, (4) 2 vGrowth VFo = − DMgO𝜌 MMgO (dm MgO dz + 𝜎MgOmMgO dT dz ) .
was at the level of the tops of the pillars. Because of its higher temperature relative to the upper part of the capsule, it began to dissolve and recede. With time, the original face retreated several hundred micrometers except in areas that were somehow protected from dissolution and that gave rise to the vertical pillars. As the most characteristic pillars are found in runs A2 and A4, the presence of suspended crys-tals above the forsterite cylinder is presumably the reason why some areas have remained immune to dissolution. As a matter of fact, a number of pillars are capped by a small for-sterite grain (at the center of Fig. 6b, or on the right side of Fig. 7b), and thus resemble the so-called fairy chimneys. In contrast, type B experiments, in which there were no crystals in suspension above the forsterite cylinder, show dissolution surfaces almost perfectly planar with only rare pillars or no pillars at all.
Most pillars are robust structures: their length increases with time (by dissolution of the neighboring forsterite) since they are best developed in the longest duration experiment (A2). Some pillars may, however, become unstable with time. For instance, there are a few short pillars in Fig. 6b that may be in the process of resorption. At this stage, our experimental database is not sufficient to establish any sys-tematic relationship between the width or the spacing of the pillars and the experimental parameters (time, temperature, crystal orientation).
Melt composition on the dissolution
and precipitation sides of forsterite cylinders
During the experiments, the melt in contact with forsterite is anticipated to be slightly enriched in MgO and depleted in CaO and Al2O3 (in comparison to the average melt com-position) on the dissolution side of forsterite cylinders, and slightly depleted in MgO and enriched in CaO and Al2O3 on the precipitation side. We do not have access to the equi-librium glass composition at the contact with forsterite due to the effect of quench crystallization. To circumvent this difficulty, we acquired three EPMA profiles in experiment B6 (FF’, GG’, and HH’; Fig. 3a and Online supplementary Table). Profile GG’ is a nearly horizontal profile in the melt layer between the two forsterite cylinders, and is rather flat (Fig. 9b). Profiles FF’ and HH’ are vertical and extend from a zone of forsterite growth to a zone of forsterite dissolu-tion. If we ignore the effect of quench crystallization (well visible for instance close to F), we observe that the MgO content in the glass increases very slightly with a gradient of about 0.5–0.6 wt% MgO per mm from the growth side to the dissolution side (Fig. 9b). Due to the effect of quench crystallization, it is not possible to know the exact MgO levels at the contact with the two forsterite cylinders, but the difference in MgO between the dissolution and growth sides is of the order of 0.35 wt%. Considering a variation of 0.08 728 729 730 731 732 733 734 735 736 737 738 739 740 741 742 743 744 745 746 747 748 749 750 751 752 753 754 755 756 757 758 759 760 761 762 763 764 765 766 767 768 769 770 771 772 773 774 775 776 777 778 779 780 781 782 783 784 785 786 787 788 789 790 791 792 793 794 795 796 797 798 799 800 801 802 803 804 805 806 807 808 809 810 811 812 813 814 815 816 817 818 819 820 821 822 823 824