HAL Id: inserm-03193473
https://www.hal.inserm.fr/inserm-03193473
Submitted on 8 Apr 2021
HAL is a multi-disciplinary open access
archive for the deposit and dissemination of
sci-entific research documents, whether they are
pub-lished or not. The documents may come from
teaching and research institutions in France or
abroad, or from public or private research centers.
L’archive ouverte pluridisciplinaire HAL, est
destinée au dépôt et à la diffusion de documents
scientifiques de niveau recherche, publiés ou non,
émanant des établissements d’enseignement et de
recherche français ou étrangers, des laboratoires
publics ou privés.
pathogenic variants
Daniel Barnes, Matti Rookus, Lesley Mcguffog, Goska Leslie, Thea Mooij, Joe
Dennis, Nasim Mavaddat, Julian Adlard, Munaza Ahmed, Kristiina
Aittomäki, et al.
To cite this version:
Daniel Barnes, Matti Rookus, Lesley Mcguffog, Goska Leslie, Thea Mooij, et al.. Polygenic risk scores
and breast and epithelial ovarian cancer risks for carriers of BRCA1 and BRCA2 pathogenic variants.
Genetics in Medicine, Nature Publishing Group, 2020, 22 (10), pp.1653-1666.
�10.1038/s41436-020-0862-x�. �inserm-03193473�
Polygenic risk scores and breast and epithelial ovarian cancer
risks for carriers of
BRCA1 and BRCA2 pathogenic variants
A full list of authors and their affiliations appears at the end of the paper.
Purpose: We assessed the associations between population-based polygenic risk scores (PRS) for breast (BC) or epithelial ovarian cancer (EOC) with cancer risks for BRCA1 and BRCA2 pathogenic variant carriers.
Methods: Retrospective cohort data on 18,935 BRCA1 and 12,339 BRCA2 female pathogenic variant carriers of European ancestry were available. Three versions of a 313 single-nucleotide poly-morphism (SNP) BC PRS were evaluated based on whether they predict overall, estrogen receptor (ER)–negative, or ER-positive BC, and two PRS for overall or high-grade serous EOC. Associations were validated in a prospective cohort.
Results: The ER-negative PRS showed the strongest association with BC risk for BRCA1 carriers (hazard ratio [HR] per standard deviation= 1.29 [95% CI 1.25–1.33], P = 3×10−72). For BRCA2, the strongest association was with overall BC PRS (HR= 1.31 [95% CI 1.27–1.36], P = 7×10−50). HR estimates decreased significantly with
age and there was evidence for differences in associations by predicted variant effects on protein expression. The HR estimates were smaller than general population estimates. The high-grade serous PRS yielded the strongest associations with EOC risk for BRCA1 (HR = 1.32 [95% CI 1.25–1.40], P = 3×10⁻²²) and BRCA2 (HR= 1.44 [95% CI 1.30–1.60], P = 4×10⁻¹²) carriers. The associations in the prospective cohort were similar.
Conclusion: Population-based PRS are strongly associated with BC and EOC risks for BRCA1/2 carriers and predict substantial absolute risk differences for women at PRS distribution extremes. Genetics in Medicine (2020) 22:1653–1666; https://doi.org/10.1038/s41436-020-0862-x
Key words: BRCA1/2; breast cancer; ovarian cancer; PRS; genetics
INTRODUCTION
Pathogenic variants in BRCA1 and BRCA2 are associated with
high risk of developing breast and ovarian cancers.1,2A recent
study of BRCA1/2 carriers estimated the average risk of developing breast cancer by age 80 years to be 72% for BRCA1
and 69% for BRCA2 carriers.2Corresponding ovarian cancer
risks were 44% for BRCA1 and 17% for BRCA2 carriers. This and previous studies have demonstrated that cancer risks for BRCA1/2 carriers increase with an increasing number of
affected first- or second-degree relatives,2 suggesting genetic
or other familial factors modify cancer risks for BRCA1/2 carriers. Consistent with this observation, common breast and ovarian cancer susceptibility single-nucleotide polymorph-isms (SNPs), identified through genome-wide association studies (GWAS) in the general population, have been shown to modify breast and ovarian cancer risks for BRCA1/2
carriers.3–7
Polygenic risk scores (PRS) based on the combined effects of disease-associated SNPs, can lead to significant levels of breast and ovarian cancer risk stratification in the
general population.8,9 It has also been demonstrated that
PRS can result in large absolute risk differences of developing
these cancers for BRCA1/2 carriers.10The largest study to date
was a retrospective cohort study of 23,463 carriers using a
PRS based on up to 88 breast cancer susceptibility SNPs and a PRS based on up to 17 ovarian cancer susceptibility
SNPs.10
Recent population-based GWAS identified an additional 72
breast and 12 ovarian cancer susceptibility SNPs.6,7,11 Based
on these data, PRS have been constructed that include SNPs associated at both genome-wide and sub-genome-wide significance levels. The best performing PRS for breast cancer
includes 313 SNPs.12
It is therefore important to understand how the most recently developed breast and ovarian cancer PRS modify cancer risks for BRCA1/2 carriers, as this information will be necessary for implementation studies to evaluate how their application influences cancer risk management for women with pathogenic variants in these genes. In this study, we used the largest sample of women with pathogenic
BRCA1/2 variants currently available to assess the
associations between the most recently developed PRS with cancer risks for BRCA1/2 carriers. We evaluated how these PRS associations vary with age, cancer family history, and BRCA1/2 gene variant characteristics. We further validated the associations for the first time in a prospective cohort of carriers and investigated implications for cancer risk prediction.
Submitted 27 November 2019; revised 28 May 2020; accepted: 29 May 2020 Published online: 15 July 2020
Correspondence: Daniel R. Barnes (drb54@medschl.cam.ac.uk)
MATERIALS AND METHODS
Retrospective cohort study participants
Study participants were enrolled through 63 studies from 29 countries contributing to the Consortium of Investigators of
Modifiers of BRCA1/2 (CIMBA).13Eligibility was restricted to
women who were ≥18 years old at recruitment and carried a
pathogenic BRCA1/2 variant. CIMBA collected information on year of birth, variant description, age at study recruitment and last follow-up, age at breast and ovarian cancer (including invasive ovarian, fallopian tube, or peritoneal) diagnosis, age/ date at bilateral prophylactic mastectomy, and number of first-and second-degree relatives with breast or ovarian cancer. Related individuals were tracked through a unique family identifier. The majority of study participants were recruited through cancer genetics clinics and enrolled in regional or national research studies. Variants were categorized according to their predicted or known effect on cellular protein expression: class I included loss-of-function pathogenic variants expected to result in unstable or no protein; class II included variants likely
to yield stable mutant proteins.14Breast cancer pathology data
were available from pathology reviews, tumor registry records, medical records or pathology records, and from tissue
microarray immunohistochemical staining.15
The genotyping, quality control and imputation processes
have been described in detail previously6,7 (brief description
provided in supplement). The present study was restricted to carriers of BRCA1/2 pathogenic variants of European ancestry,
determined using genetic data and multidimensional scaling.6,7
Breast cancer PRS
The methods for calculating the PRS are described in the Supplementary material. We evaluated three versions of the published breast cancer PRS based on the same 313 SNPs, with different weights optimized to predict the risk of overall
(PRSBC), ER-negative (PRSER-), or ER-positive (PRSER+)
breast cancer12(Table S1).
The breast cancer PRS were standardized using the standard deviations (SDs) of the corresponding PRS in population-based controls. Therefore, the estimated hazard ratios (HRs) from this study are directly comparable with odds ratios
(ORs) estimated from population-based data.12
Epithelial ovarian cancer PRS
We constructed ovarian cancer PRS based on ovarian cancer
susceptibility SNPs identified through GWAS.7 Two ovarian
cancer PRS were constructed: one for all invasive epithelial
ovarian cancer (EOC) using 30 SNPs (PRSEOC); and one for
predicting high-grade serous (HGS) EOC using 22 SNPs
(PRSHGS) (Supplementary material, Table S2). HGS is the
predominant EOC histotype in BRCA1/2 tumors.16
The PRS SDs in unaffected women in our sample were used
to standardize PRSEOCand PRSHGS.
Associations between PRS and breast cancer risk
Associations between PRS and breast cancer risk for BRCA1/2 carriers were assessed using the CIMBA retrospective cohort.
Study participants were censored at the first of (1) breast cancer diagnosis, (2) ovarian cancer diagnosis, (3) risk-reducing bilateral mastectomy, (4) last follow-up, or (5) age 80 years. Participants with a first breast cancer diagnosis were considered affected. To account for nonrandom sampling with respect to disease status, associations were evaluated
using weighted Cox regression.17,18 This involved assigning
age- and disease-specific sampling weights, such that observed weighted age-specific incidences agreed with established incidences for BRCA1/2 pathogenic variant carriers
(Supple-mentary material).19
We assessed the associations between three breast cancer PRS with the risk of overall breast cancer, and separately with ER-positive or ER-negative breast cancer risk. Models were stratified by country and Ashkenazi Jewish ancestry and were adjusted for birth cohort and the first four ancestry informative principal components calculated separately by genotyping array (Supplementary material). We fitted models adjusting for family history of breast cancer in first- and second-degree relatives to determine whether cancer family history was a confounder of PRS associations. Family history was coded as no family history, or one relative, or two or more relatives diagnosed with breast cancer. Robust variances were calculated to account for the inclusion of related individuals by clustering on family membership. All models were fitted separately in BRCA1 and BRCA2 carriers.
We fitted separate models in which the PRS was assumed to be (1) continuous and (2) categorical based on PRS percentiles determined by the PRS distribution in unaffected carriers. We tested for variation in the association of the PRS by age by fitting Cox regression models in which the PRS was a time-varying covariate, with age as the time scale, that included a PRS main effect and a PRS-by-age interaction term. Heterogeneity in the associations across countries was assessed by fitting models with a PRS–country interaction term. A likelihood ratio test (LRT) was used to assess statistical significance of interaction terms by comparing the models with the interaction against a model without the interaction term (Supplementary material). Similarly, LRTs were used to compare the fit of nested models.
Previous studies have demonstrated that cancer risks for BRCA1/2 carriers vary by pathogenic variant location or
functional effect.2,20To investigate whether the PRS
associa-tions varied by BRCA1/2-variant location, we fitted models that included a PRS by location interaction. Variants were grouped into regions by nucleotide position on the basis of previously reported differences in breast or ovarian cancer risks. BRCA1 variants were grouped in three regions (5’ to
c.2281, c.2282 to c.4071, and c.4072 to 3’).20,21
The BRCA2 ovarian cancer cluster region (OCCR) was used to define the
variant location groups.20,22 Two BRCA2 OCCR definitions
were used:“narrow” (5’ to c.3846, c.3847 to c.6275, c.6276 to
3’) and “wide” (5’ to c.2831, c.2832 to c.6401, c.6402 to 3’). We
also investigated variation in PRS associations by the predicted variant effect on protein stability/expression (class I versus class II, defined above).
123456789
To assess the associations with ER-specific breast cancer risk, a similar censoring process was used except the event of interest was diagnosis of either ER-positive or ER-negative breast cancer. Affected carriers with the alternative ER status to the outcome of interest were censored at that diagnosis. Carriers with missing ER status were excluded from the analysis.
Associations with epithelial ovarian cancer risk
The associations with EOC risk were evaluated following a similar process. However, women were censored at bilateral risk-reducing salpingo-oophorectomy (RRSO) rather than bilateral mastectomy. Carriers with a first ovarian cancer diagnosis were assumed to be affected in this analysis. We also fitted models that adjusted for family history of ovarian cancer in first- and second-degree relatives, coded as no family history, or one relative, or two or more relatives diagnosed with the disease.
The discriminatory ability of each PRS was assessed by
Harrell’s C-statistic23 stratified by country and Ashkenazi
Jewish ancestry and adjusted for birth cohort and principal
components.24 Standard errors were estimated using 1000
bootstrap replications.
Validation in prospective cohorts
The PRS associations were further evaluated using prospective cohort data. The prospective cohort included pathogenic variant carriers from the BRCA1 and BRCA2 Cohort
Consortium (BBCC)2 and CIMBA13 who were unaffected at
recruitment (informed consent and baseline questionnaire). The BBCC included data from the International BRCA1/2 Carrier Cohort Study (IBCCS), Breast Cancer Family Registry (BCFR), and the Kathleen Cunningham Foundation Con-sortium for Research into Familial Breast Cancer (kConFab)
(details in Supplementary material).2 Only women of
European ancestry were included in the analysis. All prospective cohort participants were genotyped as part of the CIMBA effort described above. However, prospective analyses considered only the prospective follow-up period from the time at recruitment of each participant into the study. Thus, the analysis time considered in the prospective and retrospective analyses were completely distinct. Associa-tions were evaluated using Cox regression, separately for BRCA1 and BRCA2 carriers. The censoring process and analysis are described in detail in the Supplementary material. Predicted age-specific cancer risks by PRS
Retrospective analysis HR estimates were used to predict age-specific absolute risks of developing breast and ovarian cancer
by PRS percentiles following a previously published method.25
To ensure consistency with known cancer risks for BRCA1/2 carriers, average age-specific cancer incidences were constrained over PRS percentile categories to agree with external estimates
of cancer incidences for carriers2(Supplementary material). We
also calculated absolute breast cancer risks for carriers in the absence or presence of cancer family history and by BRCA2
variant location, assuming external average cancer incidences by
family history and variant location.2 The absolute risks were
used to calculate 10-year cancer risks at each age by different PRS percentiles (Supplementary material).
Ethics statement
All study participants provided written informed consent and participated in research or clinical studies at the host institute under ethically approved protocols. The studies and their approving institutes are listed as a separate online Supple-ment (Ethics StateSupple-ment).
All statistical tests were two-sided. Retrospective and prospective cohort analyses were performed using R 3.5.1. Age-varying PRS and discrimination analyses were conducted using Stata 13.1 (Supplementary material).
RESULTS
The CIMBA retrospective cohort consisted of 18,935 BRCA1 carriers (9473 diagnosed with breast and 2068 with ovarian cancer) and 12,339 BRCA2 carriers (6332 with breast and 718 with ovarian cancer, Table S3).
The SNPs included in the PRS were well imputed on both genotyping platforms (Supplementary material, Figs. S1, S2, Tables S1, S2). The average PRS were larger for women diagnosed with cancer, compared with unaffected carriers (Table S3), but the PRS SDs were similar in unaffected and affected carriers (Table S3).
Associations with breast cancer risk
Table 1 shows the associations between PRSBC, PRSER-, and
PRSER+and overall breast cancer risk for carriers using the
CIMBA retrospective cohort data. PRSER- yielded the
strongest association for BRCA1 carriers (per SD HR = 1.29,
95% CI= 1.25–1.33, P = 3×10−72). For BRCA2 carriers, the
strongest associations were found for PRSBC (per SD HR=
1.31, 95% CI= 1.27–1.36, P = 7×10−50) and PRSER+(per SD
HR= 1.31, 95% CI = 1.26–1.36, P = 6×10−49). Adjusting for
breast cancer family history yielded similar associations between the PRS and breast cancer risk to those observed in
the unadjusted models (Table 1). Family history was
significantly associated with risk in all models.
The PRSER- and PRSBC were used for subsequent BRCA1
and BRCA2 carrier analyses, respectively. There was no statistically significant evidence of heterogeneity in the
country-specific HR estimates (BRCA1 PLRT= 0.26, BRCA2
PLRT= 0.64; Fig. S3). The estimated HRs for each PRS
percentile category (Table 2) were consistent with the HRs
predicted under models with the continuous PRS (estimated above), but were attenuated compared to the HRs expected
under the population-based PRS distributions (Fig. 1a, b).
Models estimating PRS percentile-specific associations did not fit significantly better than models in which PRS were
continuous (BRCA1 carriers PLRT= 0.18; BRCA2 carriers
PLRT= 0.99). The HRs for the breast cancer association
decreased with age (Table 2; PRS-by-age interaction
P = 9.40×10⁻⁵). The HRs for the PRS associations with breast
cancer risk did not differ by variant location (Table2: BRCA1
PLRT= 0.17; BRCA2 PLRT≥ 0.27). However, the associations
differed by the predicted effect of the gene variant on protein stability/expression: the HRs for the PRS associations with breast cancer risk were larger for carriers with class II (stable mutant proteins) versus class I (unstable/no protein) variants
(Table 2, BRCA1: class I HR = 1.26 [95% CI = 1.22–1.30],
class II HR= 1.38 [1.30–1.46], Pdifference= 0.011; BRCA2:
class I HR= 1.30 [95% CI = 1.25–1.35], class II HR = 1.72
[95% CI= 1.44–2.06], Pdifference= 0.003).
Under the age-varying PRS models, the C-statistic for
PRSER- was 0.60 (95% CI= 0.59–0.61) for BRCA1 carriers,
and for the PRSBC for BRCA2 carriers 0.65 (95% CI =
0.63–0.67). Under models that did not include the age-varying
PRS, the estimated C-statistics were 0.58 (95% CI=
0.57–0.59) and 0.60 (95% CI = 0.59–0.62) for BRCA1 and
BRCA2 carriers, respectively.
Associations with ER-specific breast cancer risk
The strongest PRS associations with ER-negative disease were
observed for PRSER-for both BRCA1 (per SD HR = 1.23, 95%
CI= 1.18–1.28, P = 2×10⁻²⁷) and BRCA2 (HR = 1.31, 95%
CI= 1.21–1.43, P = 1×10⁻¹⁰) carriers (Table 1). The PRSBC
and PRSER+ showed the strongest associations with
ER-positive disease for BRCA1 and BRCA2 carriers with similar
HR estimates for PRSBC and PRSER+ (Table 1). The
associations remained similar after adjusting for family
history of breast cancer (Table 1).
Associations with epithelial ovarian cancer risk
The 30-SNP PRSEOC was strongly associated with EOC
risk for BRCA1 (per SD HR = 1.31, 95% CI = 1.24–1.39,
P = 1×10⁻²¹) and BRCA2 (per SD HR = 1.43, 95% CI =
1.29–1.59, P = 2×10⁻¹¹) carriers (Table 1). The 22-SNP
PRSHGS, based only on SNPs showing associations with
high-grade serous EOC, showed similar associations (Table1,
BRCA1 HR = 1.32, 95% CI = 1.25–1.40, P = 3×10⁻²²; BRCA2
HR= 1.44, 95% CI = 1.30–1.60, P = 4×10⁻¹²). Adjusting for
family history of ovarian cancer yielded similar associations to
unadjusted models (Table1).
PRSHGS was used for downstream analyses for BRCA1 and
BRCA2 carriers. There was no evidence of heterogeneity in the
PRSHGS associations across countries (Fig. S3: BRCA1 PLRT=
0.08; BRCA2 PLRT= 0.97). For both BRCA1 and BRCA2 carriers
the estimated HRs by PRS percentile categories (Table2) were
consistent with those expected under the theoretical
population-based PRS distributions (Fig.1c, d). There was no evidence that
the PRSHGS association with EOC risk varied by age (BRCA1
P = 0.35; BRCA2 P = 0.14). The associations between PRSHGS
and EOC risk varied by BRCA1 variant location (PLRT=
8.7×10⁻³), with a larger HR for variants in the central region of
BRCA1 (central region HR = 1.50, 95% CI = 1.35–1.66; 5’ to
c.2281 region HR= 1.30, 95% CI = 1.18–1.42; c.4072 to 3’
region HR= 1.21, 95% CI = 1.10–1.33). There was little
evidence to support differences in the associations by BRCA2
variant location (Table2). There was no evidence of differences
in the associations by the BRCA1 variant predicted effect on
protein expression (Pdifference= 0.85).
The C-statistics for PRSHGSwere estimated to be 0.604 (95%
CI= 0.582–0.626) for BRCA1 and 0.667 (95% CI =
0.636–0.699) for BRCA2 carriers.
Prospective cohort associations
The breast cancer prospective cohort included 2088 BRCA1 carriers with 297 incident cases and 1757 BRCA2 carriers Table 1 PRS associations with breast and ovarian cancer risks forBRCA1 and BRCA2 pathogenic variant carriers using the CIMBA retrospective cohort data.
BRCA1 carriers BRCA2 carriers
No FHaadjustment FH adjusted No FH adjustment FH adjusted
Outcome PRS Unaffected/
affected
HR (95% CI) P HR (95% CI) P Unaffected/
affected HR (95% CI) P HR (95% CI) P Breast cancer BC 9462/ 9473 1.20 (1.17–1.23) 1.15×10 −39 1.20 (1.17–1.23) 9.54×10 −40 6007/ 6332 1.31 (1.27–1.36) 7.11×10 −50 1.31 (1.26–1.36) 6.54×10 −48 ER- 1.29 (1.25–1.33) 3.03×10 −72 1.29 (1.25–1.33) 1.02×10 −71 1.23 (1.19–1.28) 4.06×10 −29 1.23 (1.18–1.27) 6.72×10 −28 ER+ 1.17 (1.14–1.20) 6.93×10 −29 1.17 (1.14–1.20) 5.50×10 −29 1.31 (1.26–1.36) 6.12×10 −49 1.30 (1.26–1.35) 5.10×10 −47 ER-negative breast cancer BC 10,138/ 3263 1.09 (1.05–1.13) 3.69×10 −6 1.09 (1.05–1.13) 4.44×10 −6 8049/ 703 1.20 (1.11–1.30) 4.90×10 −6 1.19 (1.10–1.29) 1.91×10 −5 ER- 1.23 (1.18–1.28) 2.39×10 −27 1.23 (1.18–1.27) 1.08×10 −26 1.31 (1.21–1.43) 1.15×10 −10 1.29 (1.19–1.41) 9.98×10 −10 ER+ 1.06 (1.02–1.10) 4.58×10 −3 1.06 (1.02–1.10) 4.93×10 −3 1.17 (1.08–1.26) 1.36×10 −4 1.15 (1.07–1.25) 3.91×10 −4 ER-positive breast cancer BC 12,376/ 1025 1.44 (1.35–1.53) 3.88×10 −28 1.44 (1.35–1.54) 1.25×10 −27 6440/ 2312 1.37 (1.31–1.44) 2.95×10 −40 1.36 (1.30–1.43) 6.28×10 −38 ER- 1.29 (1.21–1.38) 2.94×10 −15 1.29 (1.21–1.37) 9.25×10 −15 1.22 (1.16–1.28) 1.93×10 −15 1.21 (1.15–1.27) 1.54×10 −14 ER+ 1.44 (1.35–1.54) 3.94×10 −28 1.45 (1.35–1.54) 1.12×10 −27 1.38 (1.32–1.45) 1.88×10 −42 1.37 (1.31–1.44) 5.99×10 −40
Ovarian cancer EOC 16,867/ 2068 1.31
(1.24–1.39) 1.49×10 −21 1.31 (1.24–1.39) 2.36×10 −21 11,621/ 718 1.43 (1.29–1.59) 1.81×10 −11 1.42 (1.28–1.58) 3.40×10 −11 HGS 1.32 (1.25–1.40) 3.01×10 −22 1.32 (1.25–1.40) 5.18×10 −22 1.44 (1.30–1.60) 4.34×10 −12 1.43 (1.29–1.59) 7.54×10 −12
BC breast cancer, CI confidence interval, CIMBA Consortium of Investigators of Modifiers of BRCA1/2, ER- estrogen receptor negative, ER+ estrogen receptor positive, EOC epithelial ovarian cancer, FH family history, HGS high-grade serous, HR hazard ratio, PRSpolygenic risk score.
Rows in bold represent the best performing PRS for each particular outcome.
Table 2 Categorical PRS, age-varying and pathogenic variant characteristic specific PRS associations with cancer risks for BRCA1 and BRCA2 carriers, using data from the CIMBA retrospective cohort. Breas t cancer Ova rian cancer BRC A1 carriers: PR S ER-BRCA2 car riers: PRS BC BR CA1 carriers : PRS HGS BRCA2 carriers : PRS HGS Mo del Catego ry HR (95 % CI) P PLRT HR (95% CI) P PLRT HR (95 % CI) P PLRT HR (95% CI) P PLRT Cat egorical PRS per centiles (%) 0– 5 0.59 (0.50 –0.70) 0.52 (0.42 –0.6 4) 0.6 8 (0.50 –0.92) 0.4 0 (0.20 –0.79) 5– 10 0.69 (0.59 –0.80) 0.60 (0.49 –0.7 3) 0.8 0 (0.59 –1.09) 0.4 7 (0.24 –0.91) 10 –20 0.77 (0.69 –0.86) 0.69 (0.59 –0.8 0) 1.0 1 (0.81 –1.26) 0.5 3 (0.33 –0.85) 20 –40 0.91 (0.84 –1.00) 0.82 (0.73 –0.9 2) 0.9 6 (0.80 –1.15) 0.8 3 (0.60 –1.14) 40 –60 1.00 [reference ] 1.00 [reference ] 1.0 0 [reference ] 1.0 0 [reference ] 60 –80 1.12 (1.03 –1.21) 1.05 (0.94 –1.1 8) 1.1 6 (0.97 –1.39) 0.9 7 (0.71 –1.33) 80 –90 1.38 (1.25 –1.53) 1.21 (1.06 –1.3 8) 1.5 7 (1.28 –1.91) 1.3 8 (0.95 –2.00) 90 –95 1.55 (1.37 –1.75) 1.44 (1.21 –1.7 1) 1.8 6 (1.44 –2.41) 1.3 6 (0.86 –2.15) 95 –100 1.61 (1.43 –1.82) 1.69 (1.45 –1.9 8) 2.2 4 (1.76 –2.84) 2.0 3 (1.31 –3.15) Age-varying PRS a: model inc luding a ma in PRS effect and a PRS × age inte raction term PRS 1.517 (1.35 9– 1.694) 1.04×1 0 − 13 0.017 1.721 (1.498 –1.9 77) 1.75×10 − 14 2.27 ×10 − 3 1.5 07 (1.12 5– 2.020) 6.02×1 0 − 3 0.4 1 2.1 83 (1.26 3– 3.774) 5.17 ×10 − 3 0.4 4 PRS × age 0.996 (0.99 3– 0.999) 3.27×1 0 − 3 0.994 (0.991 –0.9 97) 9.40×10 − 5 0.9 97 (0.99 1– 1.003) 0.35 0.9 92 (0.98 2– 1.003) 0.14 Gene pat hogenic varia nt class Class I 1.26 (1.22 –1.30) 0.011 b 5.29×10 − 3 1.30 (1.25 –1.3 5) 3.20×10 − 3b 0.04 6 1.3 3 (1.24 –1.43) 0.85 b 0.8 5 N /A c Class II 1.38 (1.30 –1.46) 1.72 (1.44 –2.0 6) 1.3 2 (1.18 –1.47) BRC A1 pat hogenic varia nt location c.2282 -c.4071 1.25 (1.19 –1.31) 0.17 N/A 1.5 0 (1.35 –1.66) 8.7 3×10 − 3 N/ A 5’ to c.22 81 1.28 (1.22 –1.34) 1.3 0 (1.18 –1.42) c.4072 to 3′ 1.34 (1.28 –1.41) 1.2 1 (1.10 –1.33) BRC A2 pat hogenic varia nt location (na rrow) c.3847 -c.6275 N/A 1.30 (1.23 –1.3 8) 0.27 N/A 1.4 8 (1.24 –1.76) 0.9 6 5’ to c.38 46 1.26 (1.17 –1.3 4) 1.4 1 (1.17 –1.69) c.6276 to 3′ 1.37 (1.29 –1.4 6) 1.4 3 (1.20 –1.70) BRC A2 pat hogenic varia nt location (wid e) c.2831 -c.6401 N/A 1.29 (1.23 –1.3 6) 0.33 N/A 1.4 8 (1.26 –1.75) 0.9 0 5’ to c.28 30 1.26 (1.17 –1.3 7) 1.3 7 (1.13 –1.68) c.6402 to 3′ 1.37 (1.29 –1.4 6) 1.4 3 (1.20 –1.71) Class I pathogenic variant refers to loss-of-function pathogenic variants expected to result in unstable or no protein; class II pathogenic variant refers to pathogenic variants likely to yield stable mutant proteins. P value for the Wald test statistic unless otherwise stated.LRT compares the models with an interaction term against the model without the interaction term. BC breast cancer, CI confidence interval, CIMBA Consortium of Investigators of Modifiers of BRCA1/2 ,ER-estrogen receptor negative, HGS high-grade serous, HR hazard ratio, LRT likelihood ratio test, N/A not applicable. aAge in years. bP value for the difference in HR for class I carriers vs. the HR for class II carriers. cNumber of affected class II carriers was too small to make meaningful inference.
with 215 incident cases (Table S4). The PRSER- was
associated with breast cancer risk for BRCA1 carriers (per
SD HR= 1.28, 95% CI = 1.14–1.44, P = 4.4×10⁻⁵). For
BRCA2 carriers, PRSBC was associated with breast cancer
risk with a per SD HR= 1.36 (95% CI = 1.17–1.57, P =
4.3×10⁻⁵) (Table3).
The ovarian cancer prospective cohort comprised 3152 BRCA1 carriers with 108 incident cases and 2495 BRCA2
carriers with 56 incident cases (Table S4). The PRSHGSwas
associated with EOC risk for both BRCA1 (HR = 1.28, 95%
CI= 1.06–1.55, P = 0.011) and BRCA2 (HR = 1.45, 95%
CI= 1.13–1.86, P = 0.003) carriers (Table3).
BRCA1 carriers: ER–negative PRS
a b c d HR (95% CI) PRS percentile 0−5 5−10 10−20 20−40 40−60 60−80 80−90 90−95 95−100 0.4 0.6 0.8 1.0 1.2 1.4 1.6 1.8 2.0 BRCA1 carriers: HGS PRS HR (95% CI) PRS percentile 0−5 5−10 10−20 20−40 40−60 60−80 80−90 90−95 95−100 0.2 0.4 0.6 0.8 1.0 1.2 1.4 1.6 1.8 2.0 3.0 4.0
BRCA2 carriers: Overall PRS
HR (95% CI) PRS percentile 0−5 5−10 10−20 20−40 40−60 60−80 80−90 90−95 95−100 0.4 0.6 0.8 1.0 1.2 1.4 1.6 1.8 2.0 Estimated HR (95% CI)
Predicted HR under population−based PRS Estimated HR under continuous PRS model
BRCA2 carriers: HGS PRS HR (95% CI) PRS percentile 0−5 5−10 10−20 20−40 40−60 60−80 80−90 90−95 95−100 0.2 0.4 0.6 0.8 1.0 1.2 1.4 1.6 1.8 2.0 3.0 4.0 Estimated HR (95% CI) Theoretical PRS HR
Estimated HR under continuous PRS model
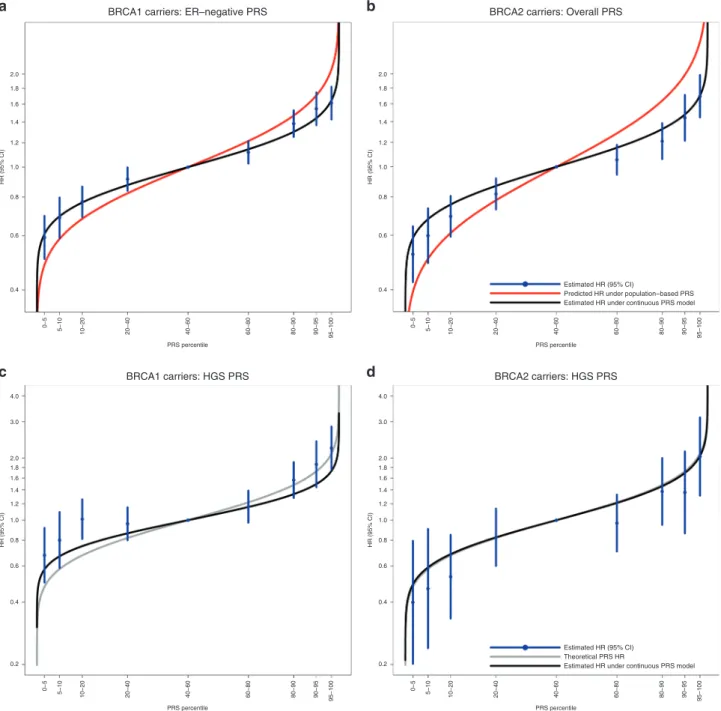
Fig. 1 Associations with specific polygenic risk score (PRS) percentiles. The PRS percentile thresholds were determined in the sets of unaffected carriers for the disease under assessment. Table2shows the estimated hazard ratios (HRs). The black curve represents the expected HRs assuming the per standard deviation HR estimates inBRCA1 and BRCA2 carriers based on the continuous PRS models (Table1). (a) PRSER-percentile-specific associations with breast cancer risk forBRCA1 carriers. The red curve represents the expected HRs over the PRS percentile distribution, assuming the per SD odds ratio (OR) estimate from the population-based validation studies from Mavaddat et al.12(OR= 1.45 per PRSER-standard deviation). (b) PRSBCpercentile-specific associations with breast cancer risk forBRCA2 carriers. The red curve represents the expected HRs over the PRS percentile distribution, assuming the per SD OR estimate from the population-based validation studies from Mavaddat et al.12(OR= 1.61 per PRSBCstandard deviation). (c) PRS
HGSpercentile-specific associations with ovarian cancer risk forBRCA1 carriers. (d) PRSHGSpercentile-specific associations with ovarian cancer risk forBRCA2 carriers. The gray curve (c and d only) represents the theoretical HRs across the PRS distribution, calculated by assuming external single-nucleotide polymorphism (SNP) effect sizes and allele frequencies for SNPs contributing to the PRS.CI confidence interval, ER estrogen receptor, HGS high-grade serous.
Absolute risks of cancer by PRS percentiles
We estimated age-specific and 10-year absolute risks of developing breast and ovarian cancers across different PRS
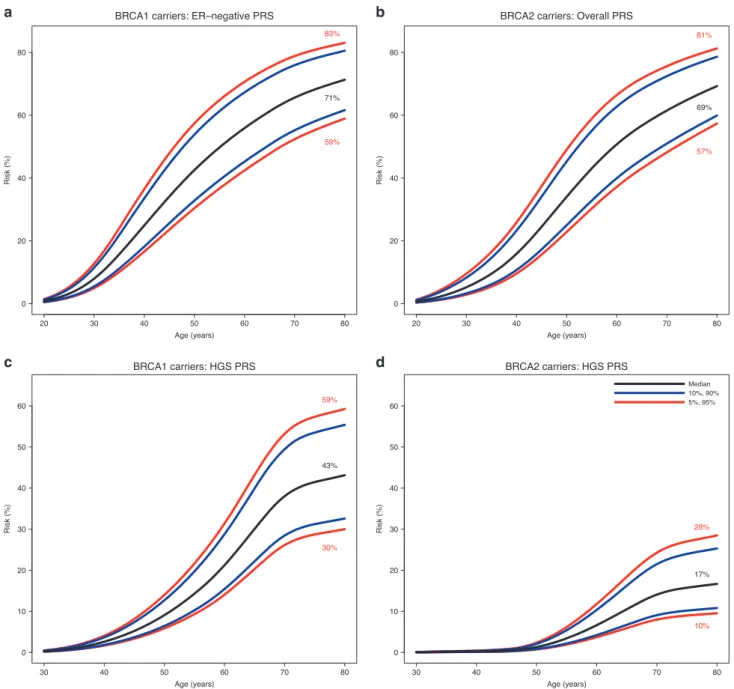
percentiles (Figs. 2 and S4). BRCA1 carriers at the 5th and
95th percentiles of the PRSER-distribution were predicted to
have breast cancer risks to age 80 years of 59% and 83%, respectively. The corresponding risks for BRCA2 carriers
based on PRSBC were 57% and 81%. Although PRS
associations were not altered by family history adjustment in the models, and there was no significant evidence of interaction between PRS and variant location, both of these factors remain significant predictors of breast cancer risk (in addition to PRS). Therefore, family history and variant location can be considered jointly with the PRS to predict cancer risks for BRCA1/2 carriers (Figs. S5–S9). For example, breast cancer risk to age 80 years for BRCA2 carriers with no family history at the 5th and 95th percentiles of the PRS were predicted to be 43% and 67%, respectively, compared with 62% and 85% for those with a family history. The risks of developing ovarian cancer by age 80 years were 30% and 59% for BRCA1 carriers at the 5th and 95th percentiles of the
PRSHGS distribution. The corresponding risks for BRCA2
carriers were 10% and 28%, respectively.
DISCUSSION
We investigated the associations between a recently reported PRS for breast cancer, based on 313 SNPs, and a PRS for EOC, based on 30 SNPs, with cancer risks for BRCA1 and BRCA2 carriers. The associations were evaluated in a large retrospective cohort and separately in a prospective cohort of BRCA1/2 carriers.
The results demonstrate that the PRS developed using population-based data are also associated with breast and ovarian cancer risk for women with BRCA1/2 pathogenic variants. The PRS developed for predicting ER-negative breast cancer showed the strongest association with breast cancer risk for BRCA1 carriers, while for BRCA2 carriers the PRS developed for predicting overall breast cancer risk performed best. The associations were unchanged after adjusting for cancer family history and were similar between the retro-spective and proretro-spective studies. There was evidence that the magnitude of the PRS associations decreased with increasing age for BRCA1 and BRCA2 carriers. There was evidence for differences in associations by the predicted effects of variants on protein stability/expression, with the breast cancer PRS
having a larger effect for carriers of variants predicted to yield a stable protein. For ovarian cancer, the PRS developed for predicting overall or HGS EOC demonstrated similar evidence of association with EOC risk, for both BRCA1 and BRCA2 carriers. The results are consistent with findings from a previous CIMBA study, based on fewer samples and fewer SNPs, which demonstrated that PRS can lead to large differences in absolute risks of developing breast and ovarian
cancers for female BRCA1/2 carriers.10
The estimated HR associations for the PRS with breast cancer risk from this study were smaller than the estimated ORs from the population-based study in which they were
derived.12This difference is unlikely to be an overestimation
of the ORs in the general population (“winner’s curse”26),
because the effect sizes were estimated in prospective studies that were independent of the data used in their
develop-ment.12,27 Adjustment for family history, a potential
con-founder in this study, did not influence the associations. Therefore, these most likely represent real differences, in which PRS modify breast cancer risk for BRCA1/2 carriers to a smaller relative extent than the general population. This meaningful attenuation must be considered when using population-based PRS to predict breast cancer risk for BRCA1/2 carriers and should be incorporated into breast
cancer risk prediction models.28
The departure from the multiplicative model for the joint effects of PRS (or some subset of SNPs) and BRCA1/2 pathogenic variants might simply reflect the high absolute risks for BRCA1/2 carriers. That is, women with the highest polygenic risk are likely to develop breast cancer at a young age, so that the relative risk associated with the PRS will diminish with age. It is interesting that the decreasing age effect appeared stronger for carriers than the general population, while the relative risk below age 50 years was
more comparable with that seen in the general population.12
We found that the breast cancer HRs were significantly elevated for carriers of variants that are predicted to generate a stable mutant protein (class II variants). These elevated HRs were similar to the corresponding ORs for association
between the PRS and ER-negative (OR= 1.47) and
ER-positive (OR= 1.74) breast cancer reported in the general
population.12The vast majority of individuals in the general
population would be expected to be noncarriers with intact BRCA1/2 protein expression in at-risk tissues, so this observation suggests that some SNPs in the PRS may exert Table 3 Associations of the best performing PRS in the prospective cohort ofBRCA1 and BRCA2 carriers.
Outcome PRS Number of women at risk Incident cancers HR (95% CI) P
Breast cancer BRCA1 carriers ER- 2088 297 1.28 (1.14–1.44) 4.44×10⁻⁵
BRCA2 carriers BC 1757 215 1.36 (1.17–1.57) 4.26×10⁻⁵
Ovarian cancer BRCA1 carriers HGS 3152 108 1.28 (1.06–1.55) 1.08×10⁻²
BRCA2 carriers HGS 2495 56 1.45 (1.13–1.86) 3.29×10⁻³
Number of women at risk is the number of pathogenic variant carriers unaffected at baseline. Incident cancers is the number of women who developed breast/ovarian cancer during the follow-up period.
their effect on proteins that interact with stable wildtype or mutant BRCA1 or BRCA2 protein.
We used the specific PRS to assess associations with ER-positive and ER-negative breast cancer for BRCA1/2 carriers. As expected, the PRS developed for ER-positive breast cancer in the general population was the most predictive of ER-positive breast cancer risk for both BRCA1 and BRCA2 carriers, and the PRS developed for ER-negative breast cancer was the most predictive of ER-negative breast cancer for both BRCA1 and BRCA2 carriers, in line with known differences in
ER expression between BRCA1- and BRCA2-related
tumors.29,30These results suggest that further risk prediction
improvements can be achieved by estimating the risk of developing ER-specific breast cancer for BRCA1/2 carriers.
Unlike the breast cancer PRS, no systematic evaluation of EOC PRS has been reported in the general population. We therefore included only SNPs identified through GWAS for EOC and its histotypes, using the reported effect sizes as PRS weights. We found that a PRS constructed on the basis of the associations between SNPs and HGS EOC was the most predictive for both BRCA1 and BRCA2 carriers, in line with the fact that the majority of tumors in both BRCA1 and
20 30 40 50 60 70 80 0 20 40 60 80
BRCA1 carriers: ER–negative PRS
a b c d Age (years) Risk (%) 83% 59% 71% 30 40 50 60 70 80 0 10 20 30 40 50 60 BRCA1 carriers: HGS PRS Age (years) Risk (%) 59% 30% 43% 20 30 40 50 60 70 80 0 20 40 60 80
BRCA2 carriers: Overall PRS
Age (years) Risk (%) 81% 57% 69% 30 40 50 60 70 80 0 10 20 30 40 50 60 BRCA2 carriers: HGS PRS Age (years) Risk (%) Median 10%, 90% 5%, 95% 28% 10% 17%
Fig. 2 Predicted absolute risks of developing breast and ovarian cancer by polygenic risk score (PRS) percentile. Risks were calculated assuming the retrospective cohort hazard ratio (HR) estimates (Tables1,2). (a) Predicted absolute risks of developing breast cancer forBRCA1 carriers by percentiles of the PRSER-. (b) Predicted absolute risks of developing breast cancer forBRCA2 carriers by percentiles of the PRSBC. (c) Predicted absolute risks of developing ovarian cancer forBRCA1 carriers by the percentiles of the PRSHGS. (d) Predicted absolute risks of developing ovarian cancer forBRCA2 carriers by percentiles of the PRSHGS.ER estrogen receptor, HGS high-grade serous.
BRCA2 carriers are HGS.15The estimated HR for PRSHGSwas
larger for BRCA2 carriers compared with the BRCA1 carrier HR estimate. This pattern had been observed previously, based on a smaller sample size and fewer SNPs, but the difference between the HRs observed here is smaller than that
reported previously.10
Predicted absolute risks for BRCA1 carriers at the 5th and 95th PRS percentiles at age 50 years varied from 31% to 58% for breast, and from 5% to 13% for ovarian cancer. By age 80 years, they varied from 59% to 83% for breast and from 30% to 59% for ovarian cancer. The corresponding absolute risks for BRCA2 carriers by age 50 years ranged from 23% to 49% and by age 80 years from 57% to 81% for breast cancer. The ovarian cancer risks by age 80 years varied from 10% to 28%. We also observed differences in the 10-year age-specific risks of cancer for different PRS distribution percentiles (Fig. S4). For example, the estimated 10-year risk of developing breast cancer at age 40 years was 17% and 34% for BRCA1 carriers at the 5th and 95th percentiles of the PRS for ER-negative breast cancer, respectively. We found no significant attenuation of the PRS associations when adjusting for family history, and no evidence of interaction between PRS and pathogenic variant location. However, family history and variant location
are both associated with cancer risk for BRCA1/2 carriers.2,20–
22Taken together, the results suggest that when family history
and PRS are considered jointly, or when variant location and PRS are considered jointly, both factors influence the risk of developing breast cancer for BRCA1/2 carriers. As a consequence, the differences in absolute risk become larger when the PRS is considered together with family history or variant location (Figs. S5–S9) and demonstrate that the PRS should be considered in combination with other risk factors to provide comprehensive cancer risks for BRCA1/2 carriers.
Strengths of this study include the large cohort sample sizes of BRCA1/2 carriers and use of independent prospective cohort data to validate PRS associations with cancer risks. The similarity in association estimates between the retrospective and prospective analyses suggests that retrospective estimates have not been strongly influenced by potential biases (e.g., survival bias). As the PRS analyzed in this study were originally developed and validated in population-based studies, the associations reported here represent independent evaluations of the PRS in BRCA1/2 carriers. The analyses were also adjusted for cancer family history, hence associations are unlikely to be biased due to confounding.
Limitations of this study include the fact that tumor ER status information was missing on a substantial proportion of the study population. Therefore, we were unable to assess associations with ER-specific breast cancer in the entire sample of BRCA1/2 carriers. The use of PRS developed in the general population means that if there are BRCA1- or
BRCA2-specific modifier SNPs,4,5 these may not have been included
in the PRS. Therefore, alternative approaches should also investigate developing PRS using data directly from BRCA1 and BRCA2 carriers, although much larger sample sizes will be required. We did not present confidence intervals for the
predicted PRS-specific absolute risks of breast or ovarian cancer, and the absolute PRS-specific risks by variant location and family history. These predictions critically depend on external cancer incidence estimates for BRCA1/2 pathogenic
variant carriers,2 which themselves are uncertain and
there-fore should only be used as a general guide. Future studies should aim to factor in uncertainty in the predicted risks based on all parameters. In addition, the PRS-specific absolute cancer risks overall and by family history or pathogenic variant location should be validated in much larger prospec-tive studies of unaffected carriers. Finally, the present analyses were limited to carriers of European ancestry. Hence the results presented may not be applicable to BRCA1/2 carriers of Asian, African, and other non-European ancestries.
PRS are now being used in risk-stratified screening trials
and other implementation studies in the general population.31
They are commercially available and have been incorporated
in comprehensive cancer risk prediction models.28,32 The
findings of this study indicate that these PRS, in combination with established risk modifiers (e.g. family history and pathogenic variant characteristics) can be used to provide more personalized cancer risk predictions for carriers, which may assist clinical management decisions. It is therefore important to undertake relevant implementation studies to determine the optimal way of incorporating these PRS into genetic counseling and risk management, and to assess whether PRS on their own or in combination with other risk factors influence the short- or long-term clinical management decisions that female BRCA1/2 carriers make. Furthermore, the available risk models incorporating the effects of BRCA1/2
pathogenic variants28,32and PRS should be validated in large
prospective studies of carriers. SUPPLEMENTARY INFORMATION
The online version of this article ( https://doi.org/10.1038/s41436-020-0862-x) contains supplementary material, which is available to authorized users.
ACKNOWLEDGEMENTS
Full acknowledgements and funding details can be found in the Supplementary material. The following consortia and studies contributed to this research and are listed as authors: The Genetic Modifiers of BRCA1 and BRCA2 (GEMO) Study Collaborators: Pascaline Berthet, Chrystelle Colas, Marie-Agnès Collonge-Rame, Capucine Delnatte, Laurence Faivre, Paul Gesta, Sophie Giraud, Christine Lasset, Fabienne Lesueur, Véronique Mari, Noura Mebirouk, Emmanuelle Mouret-Fourme, Hélène Schuster, Dominique Stoppa-Lyonnet. Epidemiological Study of Familial Breast Cancer (EMBRACE) Collaborators: Julian Adlard, Munaza Ahmed, Antonis Antoniou, Daniel Barrowdale, Paul Brennan, Carole Brewer, Jackie Cook, Rosemarie Davidson, Douglas Easton, Ros Eeles, D. Gareth Evans, Debra Frost, Helen Hanson, Louise Izatt, Kai-ren Ong, Lucy Side, Aoife O’Shaugh-nessy-Kirwan, Marc Tischkowitz, Lisa Walker. Kathleen Cuning-ham Foundation Consortium for research into Familial Breast cancer (kConFab) Investigators: Georgia
Chenevix-Trench, Kelly-Anne Phillips, Amanda Spurdle. Hereditary Breast and Ovarian Cancer Research Group Netherlands (HEBON) Investigators: Marinus Blok, Peter Devilee, Frans Hogervorst, Maartje Hooning, Marco Koudijs, Arjen Mensenkamp, Hanne Meijers-Heijboer, Matti Rookus, Klaartje van Engelen. French National BRCA1 and BRCA2 mutations carrier cohort (GENEPSO) Investigators: Nadine Andrieu, Catherine Noguès. The Consortium of Investigators of Modifiers ofBRCA1 and BRCA2 (CIMBA): All authors are members of CIMBA.
DISCLOSURE
G.P. has received honoraria from Novartis, Amgen, Roche, Pfizer, and AstraZeneca. The other authors declare no conflicts of interest.
Publisher’s note Springer Nature remains neutral with regard to jurisdictional claims in published maps and institutional affiliations.
REFERENCES
1. Antoniou A, Pharoah PDP, Narod S, et al. Average risks of breast and ovarian cancer associated with BRCA1 or BRCA2 mutations detected in case Series unselected for family history: a combined analysis of 22 studies. Am J Hum Genet. 2003;72:1117–1130.
2. Kuchenbaecker KB, Hopper JL, Barnes DR, et al. Risks of breast, ovarian, and contralateral breast cancer for BRCA1 and BRCA2 mutation carriers. JAMA. 2017;317:2402–2416.
3. Antoniou AC, Spurdle AB, Sinilnikova OM, et al. Common breast cancer-predisposition alleles are associated with breast cancer risk in BRCA1 and BRCA2 mutation carriers. Am J Hum Genet. 2008;82:937–948. 4. Couch FJ, Wang X, McGuffog L, et al. Genome-wide association study in
BRCA1 mutation carriers identifies novel loci associated with breast and ovarian cancer risk. PLoS Genet. 2013;9:e1003212.
5. Gaudet MM, Kuchenbaecker KB, Vijai J, et al. Identification of a BRCA2-specific modifier locus at 6p24 related to breast cancer risk. PLoS Genet. 2013;9:e1003173.
6. Milne RL, Kuchenbaecker KB, Michailidou K, et al. Identification of ten variants associated with risk of estrogen-receptor-negative breast cancer. Nat Genet. 2017;49:1767–1778.
7. Phelan CM, Kuchenbaecker KB, Tyrer JP, et al. Identification of 12 new susceptibility loci for different histotypes of epithelial ovarian cancer. Nat Genet. 2017;49:680–691.
8. Mavaddat N, Pharoah PDP, Michailidou K, et al. Prediction of breast cancer risk based on profiling with common genetic variants. J Natl Cancer Inst. 2015;107:djv036.
9. Yang X, Leslie G, Gentry-Maharaj A, et al. Evaluation of polygenic risk scores for ovarian cancer risk prediction in a prospective cohort study. J Med Genet. 2018;55:546–554.
10. Kuchenbaecker KB, McGuffog L, Barrowdale D, et al. Evaluation of polygenic risk scores for breast and ovarian cancer risk prediction in BRCA1 and BRCA2 mutation carriers. J Natl Cancer Inst. 2017;109: djw302.
11. Michailidou K, Lindström S, Dennis J, et al. Association analysis identifies 65 new breast cancer risk loci. Nature. 2017;551:92–94.
12. Mavaddat N, Michailidou K, Dennis J, et al. Polygenic risk scores for prediction of breast cancer and breast cancer subtypes. Am J Hum Genet. 2019;104:21–34.
13. Chenevix-Trench G, Milne RL, Antoniou AC, et al. An international initiative to identify genetic modifiers of cancer risk in BRCA1 and BRCA2 mutation carriers: the Consortium of Investigators of Modifiers of BRCA1 and BRCA2 (CIMBA). Breast Cancer Res. 2007;9:104.
14. Antoniou AC, Sinilnikova OM, Simard J, et al. RAD51 135G–>C modifies breast cancer risk among BRCA2 mutation carriers: results from a combined analysis of 19 studies. Am J Hum Genet. 2007;81:1186–1200.
15. Mavaddat N, Barrowdale D, Andrulis IL, et al. Pathology of breast and ovarian cancers among BRCA1 and BRCA2 mutation carriers: results from the Consortium of Investigators of Modifiers of BRCA1/2 (CIMBA). Cancer Epidemiol Biomarkers Prev. 2012;21:134–147.
16. Lakhani SR, Manek S, Penault-Llorca F, et al. Pathology of ovarian cancers in BRCA1 and BRCA2 carriers. Clin Cancer Res. 2004;10:2473–2481. 17. Antoniou AC, Goldgar DE, Andrieu N, et al. A weighted cohort approach
for analysing factors modifying disease risks in carriers of high-risk susceptibility genes. Genet Epidemiol. 2005;29:1–11.
18. Barnes DR, Lee A, Investigators E, kConFab I, Easton DF, Antoniou AC. Evaluation of association methods for analysing modifiers of disease risk in carriers of high-risk mutations. Genet Epidemiol. 2012;36:274–291. 19. Antoniou AC, Cunningham AP, Peto J, et al. The BOADICEA model of
genetic susceptibility to breast and ovarian cancers: updates and extensions. Br J Cancer. 2008;98:1457–1466.
20. Rebbeck TR, Mitra N, Wan F, et al. Association of type and location of BRCA1 and BRCA2 mutations with risk of breast and ovarian cancer. JAMA. 2015;313:1347–1361.
21. Thompson D, Easton D, Breast Cancer Linkage Consortium. Variation in BRCA1 cancer risks by mutation position. Cancer Epidemiol Biomarkers Prev. 2002;11:329–336.
22. Thompson D, Easton D, Breast Cancer Linkage Consortium. Variation in cancer risks, by mutation position, in BRCA2 mutation carriers. Am J Hum Genet. 2001;68:410–419.
23. Harrell FE. Evaluating the yield of medical tests. JAMA. 1982;247:2543–2546.
24. White IR, Rapsomaniki E, Emerging Risk Factors Collaboration Covariate-adjusted measures of discrimination for survival data. Biom J.2015;57:592–613.
25. Antoniou AC, Beesley J, McGuffog L, et al. Common breast cancer susceptibility alleles and the risk of breast cancer for BRCA1 and BRCA2 mutation carriers: implications for risk prediction. Cancer Res. 2010;70:9742–9754.
26. Xiao R, Boehnke M. Quantifying and correcting for the winner’s curse in genetic association studies. Genet Epidemiol. 2009;33:453–462. 27. Läll K, Lepamets M, Palover M, et al. Polygenic prediction of breast
cancer: comparison of genetic predictors and implications for risk stratification. BMC Cancer. 2019;19:557.
28. Lee A, Mavaddat N, Wilcox AN, et al. BOADICEA: a comprehensive breast cancer risk prediction model incorporating genetic and nongenetic risk factors. Genet Med. 2019;1708–1718.
29. Mavaddat N, Barrowdale D, Andrulis IL, et al. Pathology of breast and ovarian cancers among BRCA1 and BRCA2 mutation carriers: results from the Consortium of Investigators of Modifiers of BRCA1/2 (CIMBA). Cancer Epidemiol Biomarkers Prev. 2012;21:134–147.
30. Lee AJ, Cunningham AP, Kuchenbaecker KB, et al. BOADICEA breast cancer risk prediction model: updates to cancer incidences, tumour pathology and web interface. Br J Cancer. 2014;110:535–545. 31. Antoniou A, Anton-Culver H, Borowsky A, et al. A response to
“Personalised medicine and population health: breast and ovarian cancer”. Hum Genet. 2019;138:287–289.
32. IBIS. IBIS breast cancer risk evaluation tool. 2017.http://www.ems-trials. org/riskevaluator/.
Open Access This article is licensed under a Creative Commons Attribution 4.0 International License, which permits use, sharing, adaptation, distribution and reproduction in any medium or format, as long as you give appropriate credit to the original author(s) and the source, provide a link to the Creative Commons license, and indicate if changes were made. The images or other third party material in this article are included in the article’s Creative Commons license, unless indicated otherwise in a credit line to the material. If material is not included in the article’s Creative Commons license and your intended use is not permitted by statutory regulation or exceeds the permitted use, you will need to obtain permission directly from the copyright holder. To view a copy of this license, visithttp://creativecommons.org/licenses/ by/4.0/.
Daniel R. Barnes, PhD
1, Matti A. Rookus, PhD
2, Lesley McGuffog
1, Goska Leslie, MEng
1,
Thea M. Mooij, MSc
2, Joe Dennis, MSc
1, Nasim Mavaddat, PhD
1, Julian Adlard, MD
3,
Munaza Ahmed, MD(Res), FRCP
4, Kristiina Aittomäki, MD, PhD
5, Nadine Andrieu, PhD
6,7,8,9,
Irene L. Andrulis, PhD
10,11, Norbert Arnold, PhD
12,13, Banu K. Arun, MD
14, Jacopo Azzollini, MD
15,
Judith Balmaña, MD, PhD
16,17, Rosa B. Barkardottir, CandSci
18,19, Daniel Barrowdale, BSc
1,
Javier Benitez, PhD
20,21, Pascaline Berthet, MD
22, Katarzyna Bia
łkowska, MSc
23,
Amie M. Blanco, MS
24, Marinus J. Blok, PhD
25, Bernardo Bonanni, MD
26,
Susanne E. Boonen, MD, PhD
27, Åke Borg, PhD
28, Aniko Bozsik, PhD
29, Angela R. Bradbury, MD
30,
Paul Brennan, MBBS, FRCP
31, Carole Brewer, MD
32, Joan Brunet, MD, PhD
33, Saundra S. Buys, MD
34,
Trinidad Caldés, MD
35, Maria A. Caligo, PhD
36, Ian Campbell, PhD
37,38,
Lise Lotte Christensen, MSc, PhD
39, Wendy K. Chung, MD, PhD
40, Kathleen B. M. Claes, PhD
41,
Chrystelle Colas, MD, PhD
42, GEMO Study Collaborators, EMBRACE Collaborators,
Marie-Agnès Collonge-Rame, MD
43, Jackie Cook, MD
50, Mary B. Daly, MD, PhD
62,
Rosemarie Davidson, MD
51, Miguel de la Hoya, PhD
35, Robin de Putter, MD
41,
Capucine Delnatte, MD
44, Peter Devilee, PhD
63,64, Orland Diez, PhD
65,66, Yuan Chun Ding, PhD
67,
Susan M. Domchek, MD
68, Cecilia M. Dorfling, MSc
69, Martine Dumont, PhD
70, Ros Eeles, MD, PhD
52,
Bent Ejlertsen, MD
71, Christoph Engel, MD
72, D. Gareth Evans, MD, PhD
53,54,
Laurence Faivre, MD, PhD
45,73, Lenka Foretova, MD, PhD
74, Florentia Fostira, PhD
75,
Michael Friedlander, MD, PhD
76, Eitan Friedman, MD, PhD
77,78, Debra Frost, ONC
1,
Patricia A. Ganz, MD
79, Judy Garber, MD, MPH
80, Andrea Gehrig, MD
81, Anne-Marie Gerdes, MD
82,
Paul Gesta, MD
83, Sophie Giraud, MD, PhD
46, Gord Glendon, MSc
10, Andrew K. Godwin, PhD
84,
David E. Goldgar, PhD
85, Anna González-Neira, PhD
21, Mark H. Greene, MD
86,
Daphne Gschwantler-Kaulich, MD
87, Eric Hahnen, PhD
88,89, Ute Hamann, PhD
90,
Helen Hanson, MD, FRCP
91, Julia Hentschel, PhD
92, Frans B. L. Hogervorst, PhD
93,
Maartje J. Hooning, PhD
94, Judit Horvath, MD, PhD
95, Chunling Hu, MD, PhD
96,
Peter J. Hulick, MD
97,98, Evgeny N. Imyanitov, MD
99, kConFab Investigators, HEBON Investigators,
GENEPSO Investigators, Claudine Isaacs, MD
108, Louise Izatt, PhD
55, Angel Izquierdo, MD, MPH
33,
Anna Jakubowska, PhD
23,109, Paul A. James, MBBS, PhD
38,110, Ramunas Janavicius, MD, PhD
111,112,
Esther M. John, PhD
113, Vijai Joseph, PhD
114, Beth Y. Karlan, MD
115,116, Karin Kast, MD
117,
Marco Koudijs, PhD
103, Torben A. Kruse, PhD
118, Ava Kwong, MD
119,120,121, Yael Laitman, MD
77,
Christine Lasset, MD, PhD
47,122, Conxi Lazaro, PhD
33, Jenny Lester, MPH
115,116,
Fabienne Lesueur, PhD
6,7,8,9, Annelie Liljegren, MD, PhD
123, Jennifer T. Loud, DNP, CRNP
86,
Jan Lubi
ński, MD, PhD
23, Phuong L. Mai, MD, MS
124, Siranoush Manoukian, MD
15,
Véronique Mari, MD
48, Noura Mebirouk, PhD
6,7,8,9, Hanne E. J. Meijers-Heijboer, PhD
105,
Alfons Meindl, PhD
125, Arjen R. Mensenkamp, PhD
104, Austin Miller, PhD
126,
Marco Montagna, PhD
127, Emmanuelle Mouret-Fourme, MD
42, Semanti Mukherjee, PhD
128,
Anna Marie Mulligan, MBBCh
129,130, Katherine L. Nathanson, PhD
68, Susan L. Neuhausen, PhD
67,
Heli Nevanlinna, PhD
131, Dieter Niederacher, PhD
132, Finn Cilius Nielsen, MD
133,
Liene Nikitina-Zake, MD, PhD
134, Catherine Noguès, MD
107, Edith Olah, PhD, DSc
29,
Olufunmilayo I. Olopade, MD
135, Kai-ren Ong, MD
56, Aoife O
’Shaughnessy-Kirwan, PhD
58,
Ana Osorio, PhD
20,21, Claus-Eric Ott, MD
136, Laura Papi, MD, PhD
137, Sue K. Park, MD, PhD
138,139,140,
Michael T. Parsons, PhD
100, Inge Sokilde Pedersen, PhD
141,142,143, Bernard Peissel, MD
15,
Ana Peixoto, MSc
144, Paolo Peterlongo, PhD
145, Georg Pfeiler, MD
146,
Kelly-Anne Phillips, MD
37,38,101,102, Karolina Prajzendanc, MSc
23, Miquel Angel Pujana, PhD
147,
Paolo Radice, PhD
148, Juliane Ramser, PhD
149, Susan J. Ramus, PhD
150,151,152, Johanna Rantala, PhD
153,
Gad Rennert, MD, PhD
154, Harvey A. Risch, MD, PhD
155, Mark Robson, MD
128,
Karina Rønlund, MD, PhD
156, Ritu Salani, MD, MBA
157, Hélène Schuster, MD
49,158,159,
Leigha Senter, MS
160, Payal D. Shah, MD
30, Priyanka Sharma, MD
161, Lucy E. Side, MD
57,
Christian F. Singer, MD, MPH
146, Thomas P. Slavin, MD
162, Penny Soucy, PhD
70,
Melissa C. Southey, PhD
163,164,165, Amanda B. Spurdle, PhD
100, Doris Steinemann, PhD
166,
Zoe Steinsnyder, BS
128, Dominique Stoppa-Lyonnet, MD, PhD
42,167,168, Christian Sutter, PhD
169,
Yen Yen Tan, PhD
, Manuel R. Teixeira, MD, PhD
, Soo Hwang Teo, PhD
,
Darcy L. Thull, MS
173, Marc Tischkowitz, MD, PhD
59,60, Silvia Tognazzo, MSc
127,
Amanda E. Toland, PhD
174, Alison H. Trainer, MBBS, PhD
110,175, Nadine Tung, MD
176,
Klaartje van Engelen, MD
106, Elizabeth J. van Rensburg, PhD
69, Ana Vega, PhD
177,178,179,
Jeroen Vierstraete, MSc
41, Gabriel Wagner, MSc
146, Lisa Walker, PhD
61,
Shan Wang-Gohrke, MD, PhD
180, Barbara Wappenschmidt, MD
88,89, Jeffrey N. Weitzel, MD
162,
Siddhartha Yadav, MBBS
181, Xin Yang, PhD
1, Drakoulis Yannoukakos, PhD
75, Dario Zimbalatti, MD
15,
Kenneth Offit, MD, MPH
114,128, Mads Thomassen, PhD
118, Fergus J. Couch, PhD
96,
Rita K. Schmutzler, MD
88,89,182, Jacques Simard, PhD
70, Douglas F. Easton, PhD
1,183,
Georgia Chenevix-Trench, PhD
100and Antonis C. Antoniou, PhD
1, on behalf of the Consortium of
Investigators of Modifiers of BRCA and BRCA2
1
Centre for Cancer Genetic Epidemiology, Department of Public Health and Primary Care, University of Cambridge, Cambridge, UK;2The Netherlands Cancer Institute, Department of Epidemiology (PSOE), Amsterdam, The Netherlands;3Chapel Allerton Hospital, Yorkshire Regional
Genetics Service, Leeds, UK;4Great Ormond Street Hospital for Children NHS Trust, North East Thames Regional Genetics Service, London, UK; 5University of Helsinki, Department of Clinical Genetics, Helsinki University Hospital, Helsinki, Finland;6Inserm U900, Genetic Epidemiology of
Cancer team, Paris, France;7Institut Curie, Paris, France;8Mines ParisTech, Fontainebleau, France;9Department of Life & Health Sciences, PSL
University, Paris, France;10Lunenfeld-Tanenbaum Research Institute of Mount Sinai Hospital, Fred A. Litwin Center for Cancer Genetics,
Toronto, ON, Canada;11University of Toronto, Department of Molecular Genetics, Toronto, ON, Canada;12University Hospital of
Schleswig-Holstein, Campus Kiel, Christian-Albrechts University Kiel, Department of Gynaecology and Obstetrics, Kiel, Germany;13University Hospital of
Schleswig-Holstein, Campus Kiel, Christian-Albrechts University Kiel, Institute of Clinical Molecular Biology, Kiel, Germany;14University of Texas
MD Anderson Cancer Center, Department of Breast Medical Oncology, Houston, TX, USA;15Fondazione IRCCS Istituto Nazionale dei Tumori di
Milano, Unit of Medical Genetics, Department of Medical Oncology and Hematology, Milan, Italy;16Vall d’Hebron Institute of Oncology, High Risk and Cancer Prevention Group, Barcelona, Spain;17University Hospital of Vall d’Hebron, Department of Medical Oncology, Barcelona, Spain;18Landspitali University Hospital, Department of Pathology, Reykjavik, Iceland;19University of Iceland, BMC (Biomedical Centre), Faculty of Medicine, Reykjavik, Iceland;20Centro de Investigación en Red de Enfermedades Raras (CIBERER), Madrid, Spain;21Spanish National Cancer Research Centre (CNIO), Human Cancer Genetics Programme, Madrid, Spain;22Centre François Baclesse, Département de Biopathologie, Caen, France;23Pomeranian Medical University, Department of Genetics and Pathology, Szczecin, Poland;24University of California San Francisco, Cancer Genetics and Prevention Program, San Francisco, CA, USA;25Maastricht University Medical Center, Department of Clinical Genetics, Maastricht, The Netherlands;26IEO, European Institute of Oncology IRCCS, Division of Cancer Prevention and Genetics, Milan, Italy;
27Zealand University Hospital, Clinical Genetic Unit, Department of Paediatrics, Roskilde, Denmark;28Lund University, Division of Oncology and
Pathology, Department of Clinical Sciences Lund, Lund, Sweden;29National Institute of Oncology, Department of Molecular Genetics,
Budapest, Hungary;30Perelman School of Medicine at the University of Pennsylvania, Department of Medicine, Abramson Cancer Center,
Philadelphia, PA, USA;31Institute of Genetic Medicine, International Centre for Life, Northern Genetic Service, Newcastle upon Tyne, UK; 32Royal Devon & Exeter Hospital, Department of Clinical Genetics, Exeter, UK;33ONCOBELL-IDIBELL-IDIBGI-IGTP, Catalan Institute of Oncology,
CIBERONC, Hereditary Cancer Program, Barcelona, Spain;34Huntsman Cancer Institute, Department of Medicine, Salt Lake City, UT, USA; 35CIBERONC, Hospital Clinico San Carlos, IdISSC (Instituto de Investigación Sanitaria del Hospital Clínico San Carlos), Molecular Oncology
Laboratory, Madrid, Spain;36University Hospital, SOD Genetica Molecolare, Pisa, Italy;37Peter MacCallum Cancer Center, Melbourne, VIC,
Australia;38The University of Melbourne, Sir Peter MacCallum Department of Oncology, Melbourne, VIC, Australia;39Aarhus University
Hospital, Department of Clinical Medicine,, Aarhus, Denmark;40Columbia University, Departments of Pediatrics and Medicine, New York, NY, USA;41Ghent University, Centre for Medical Genetics, Ghent, Belgium;42Institut Curie, Service de Génétique, Paris, France;43CHU de Besançon, Service de Génétique, Besançon, France;44CHU Nantes, Laboratoire de genetique moleculaire, Nantes, France;45Centre Georges-François Leclerc, Unité d’oncogénétique, Centre de Lutte Contre le Cancer, Dijon, France;46Hospices Civils de Lyon, Department of Genetics, Bron, France;47Centre Léon Bérard, Unité de Prévention et d’Epidémiologie Génétique, Lyon, France;48Centre Antoine Lacassagne, Département d’Hématologie-Oncologie Médicale, Nice, France;49Unité d’Oncogénétique Centre de Lutte contre le Cancer Paul Strauss, Strasbourg, France;50Sheffield Children’s Hospital, Sheffield Clinical Genetics Service, Sheffield, UK;51Queen Elizabeth University Hospitals, Department of Clinical Genetics, Glasgow, UK;52The Institute of Cancer Research and Royal Marsden NHS Foundation Trust, Oncogenetics Team, London, UK;53The University of Manchester, Manchester Academic Health Science Centre, Manchester Universities Foundation Trust, St. Mary’s Hospital, Genomic Medicine, Division of Evolution and Genomic Sciences, Manchester, UK;54Manchester Academic Health Science
Centre, Manchester Universities Foundation Trust, St. Mary’s Hospital, Genomic Medicine, North West Genomics hub, Manchester, UK;55Guy’s
and St Thomas’ NHS Foundation Trust, Clinical Genetics, London, UK;56Birmingham Women’s Hospital Healthcare NHS Trust, West Midlands
Regional Genetics Service, Birmingham, UK;57Princess Anne Hospital, Southampton, UK;58Cambridge University Hospitals NHS Foundation
Trust, East Anglian Medical Genetics Service, Cambridge, UK;59McGill University, Program in Cancer Genetics, Departments of Human
Genetics and Oncology, Montréal, QC, Canada;60University of Cambridge, Department of Medical Genetics, National Institute for Health
Research Cambridge Biomedical Research Centre, Cambridge, UK;61Oxford University Hospitals, Oxford Centre for Genomic Medicine, Oxford,
UK;62Fox Chase Cancer Center, Department of Clinical Genetics, Philadelphia, PA, USA;63Leiden University Medical Center, Department of
Pathology, Leiden, The Netherlands;64Leiden University Medical Center, Department of Human Genetics, Leiden, The Netherlands;65Vall
dHebron Institute of Oncology (VHIO), Oncogenetics Group, Barcelona, Spain;66University Hospital Vall dHebron, Clinical and Molecular Genetics Area, Barcelona, Spain;67Beckman Research Institute of City of Hope, Department of Population Sciences, Duarte, CA, USA;
68
University of Pennsylvania, Basser Center for BRCA, Abramson Cancer Center, Philadelphia, PA, USA;69University of Pretoria, Department of Genetics, Arcadia, South Africa;70Centre Hospitalier Universitaire de Québec– Université Laval Research Center, Genomics Center,, Québec City, QC, Canada;71Rigshospitalet, Copenhagen University Hospital, Department of Oncology, Copenhagen, Denmark;72University of Leipzig, Institute for Medical Informatics, Statistics and Epidemiology, Leipzig, Germany;73DHU Dijon, Centre de Génétique, Dijon, France;74Masaryk