Comparison of the structure and flexural
properties of Moso, Guadua and Tre Gai bamboo
The MIT Faculty has made this article openly available.
Please share
how this access benefits you. Your story matters.
Citation
Dixon, P.G. et al. “Comparison of the Structure and Flexural
Properties of Moso, Guadua and Tre Gai Bamboo.” Construction and
Building Materials 90 (August 2015): 11–17 © 2015 Elsevier Ltd
As Published
http://dx.doi.org/10.1016/j.conbuildmat.2015.04.042
Publisher
Elsevier
Version
Author's final manuscript
Citable link
http://hdl.handle.net/1721.1/110974
Terms of Use
Creative Commons Attribution-NonCommercial-NoDerivs License
Comparison of the structure and flexural properties
of Moso, Guadua and Tre Gai bamboo
Dixon PG┼, Ahvenainen P*, Aijazi AN┼, Chen SH┼, Lin S┼, Augusciak PK┼, Borrega M, Svedström K* and Gibson LJ┼•
┼ Department of Materials Science and Engineering, Massachusetts Institute of Technology,
77 Massachusetts Ave, Cambridge, MA, 02139, USA
* Department of Physics, University of Helsinki, PO Box 64, 00014 Helsinki, Finland
Department of Forest Products Technology, Aalto University, PO Box 16300, 00076 Aalto, Finland
• Corresponding author, email: ljgibson@mit.edu, phone: 1-617-253-7107, postal address: Massachusetts
Institute of Technology, 77 Massachusetts Ave, Bldg. 8-135, Cambridge, MA, 02139, USA
Abstract
Bamboo is an underutilized resource widely available in countries with rapidly developing economies. Structural bamboo products, analogous to wood products, allow flexibility in the shape and dimensions of bamboo structural members. Here, the ultrastructure, microstructure, cell wall properties and flexural properties of three species of bamboo (Moso, Guadua and Tre Gai) are compared. At a given density, the axial modulus of elasticity of Guadua is higher than that of Moso or Tre Gai, which are similar; ultrastructural results suggest that Guadua has a higher solid cell wall stiffness. At a given density, their moduli of rupture are similar.
1 Introduction
Structural bamboo products (SBP), such as oriented strand board, plywood and glue-laminated beams, offer the potential for increased use of bamboo in engineered structures, especially in countries with rapidly developing economies. Bamboo is a renewable, sustainable material with a yield of biomass per hectare competitive with wood (Vogtländer et al., 2010). Recently, there has been increased interest in the design and application of SBP.
Bamboos are members of the grass family (Poaceae). Their structure consists of vascular bundles (vessels supported by fibers) embedded in matrix of parenchyma cells; from an engineering perspective, they can be considered to be fiber reinforced composites. Bamboo is a graded material; the volume fraction of the structural fibers increases both longitudinally, up the height of the culm and radially, from the inside to the outside, across the culm wall (Grosser and Liese, 1971; Liese, 1987).
In this study, three species of "timber" bamboo are investigated: Phyllostachys pubescens Mazel (referred to as Moso), Guadua angustifolia Kunth (referred to as Guadua), and Bambusa stenostachya Hackel (referred to as Tre Gai). "Timber" refers to their large size and woody nature which makes them appropriate for harvesting and processing into SBP.
Moso bamboo is a temperate bamboo species, which grows primarily in China. Currently, it is the most economically important timber bamboo globally (Ding et al., 2007; Fu, 2001, 2000). In China, Moso bamboo is often used in scaffolding, in small structures and in goods such as furniture and crafts. Engineered Moso bamboo products, particularly flooring, are an important export (Ding et al., 2007; Fu, 2001, 2000). Guadua is a neotropical bamboo with a range from southern Mexico to northern Argentina. It is the most economically important species that grows in the western hemisphere (Young and Judd, 1992). It especially flourishes in Ecuador and Colombia, where it is an important resource (Van Der Lugt, 2005; Young and Judd, 1992). Guadua is often used in traditional construction and crafts in rural areas (Kleinn and Morales-Hidalgo, 2006; Klop et al., 2003; Young and Judd, 1992). The SBP sector for Guadua in this region currently lags behind that of Moso in China, but ongoing work is expanding and
improving the sector (Klop et al., 2003; Van Der Lugt, 2005). Finally, Tre Gai is a paleotropical species, distributed primarily in Vietnam, where it is a prominent resource, utilized both in traditional small structures and in the paper industry (Le et al., 1999).
A number of studies have investigated the effect of the density gradient on the mechanical properties of bamboo. Since Moso bamboo is the most important species commercially, most studies of mechanical properties of bamboo have been done on Moso. Nogata and Takahashi, Amada et al., and Shao et al. are a few to study axial tensile properties with respect to this gradient, by testing tensile specimens from slices at different locations in Moso culms (Amada et al., 1997; Amada and Untao, 2001; Nogata and Takahashi, 1995; Shao et al., 2010). These studies consistently find that the axial Young's modulus ranges from around 5 to 25 GPa. The axial tensile strengths from these studies are less consistent, but the majority of data fall in the 100 to 400 MPa range (Amada et al., 1997; Amada and Untao, 2001; Nogata and Takahashi, 1995; Shao et al., 2010). Lo et al. investigate axial compressive strength using full cylindrical sections of Moso bamboo culms with varying longitudinal position and fiber volume fraction, finding a range of 45 to 65 MPa (Lo et al., 2008). Yu and their colleagues performed a study of the mechanical properties of the cell wall of Moso bamboo, using nanoindentation and microtension tests on single fibers, determining a reduced modulus ca. 20 GPa from indentation and axial Young’s modulus ca. 33 GPa (Yu et al., 2011).
There is also a significant body of work on Guadua which focuses primarily on end products. A few of the products investigated include Guadua glulam (Correal et al., 2014) and hydrothermally densified Guadua materials (Archila-Santos et al., 2014). In addition, the properties of native Guadua culm material have also been studied. In a work similar to that of Lo et al. on Moso bamboo (Lo et al., 2008), Correal and Arbelaez explore the effects of height and age on the mechanical properties of Guadua using large sections of culms (Correal D and Arbeláez C, 2010); they find the average axial modulus of elasticity in compression and bending is around 17 GPa.
There are fewer studies of Tre Gai. Richard and Harries investigate the effect of the radial density gradient on the tensile strength of Tre Gai, finding a range of about 100 to 200 MPa from the
inner to outer regions of the culm wall, respectively (Richard and Harries, 2015). Harries and colleagues have also investigated the fracture and creep characteristics of this species (Gottron et al., 2014; Mitch et al., 2010).
In this study, the bending properties in the axial direction of small clear (internode) specimens of these three timber bamboo species are studied. Specimens are taken at different locations (radial positions and, to some extent, heights) in the culm, in an effort to compare the properties at various densities. The microstructures of the species are investigated using scanning electron microscopy, and the ultrastructure of the solid cell walls is probed with chemical analysis and X-ray scattering in order to understand differences in mechanical properties between the three species.
2 Materials
Longitudinal sections of round culms of the three species of bamboo were obtained from importers: Moso bamboo from Bamboo Craftsman Company (Portland, OR), Guadua bamboo from KoolBamboo (Miami, FL), and Tre Gai bamboo from amaZulu (Clermont, FL). For the Guadua and Tre Gai species, three longitudinal sections were obtained from the bottom to middle sections of the entire culm height (as noted by the importers) of three separate culms for each species. For the Moso bamboo, material from only a single culm was tested in this study; data from six culms (two each from 1, 3, and 5 year age groups) available in the literature, was used for comparison (Li, 2004). The average height of the Guadua culm sections used in this study was 6 m; that of the Tre Gai was 2.4 m and the height of the single Moso culm section tested in this study was 3 m.
All materials were treated with boric acid/borates to increase resistance to biological attack prior to importation. The ages of these materials are uncertain, but according to the importers all culms were 3 to 6 years old when harvested, suggesting that the materials are from relatively mature culms at an age appropriate for harvesting.
The moisture contents (MC) of the culms tested in this study were determined by placing six beams of each bamboo pole in an oven at 103˚C for 24 hours: the moisture content of the Moso was about 4%, Guadua 6%, and Tre Gai 6%. The MC of the Moso bamboo tested by Li was reported at about
10%, somewhat higher than that of the Moso culm tested in this study (Li, 2004).
3 Methods
3.1 Microscopy
Uncoated bamboo specimens from different internodes of one culm section of each species were imaged using a JEOL JSM-6610LV scanning electron microscope, in low vacuum mode. Specimens were imaged in both backscatter and secondary modes. Surfaces were prepared by grinding on a Struers
Rotopol-1 model polishing wheel with progressively finer silicon carbide papers: 800-grit, 1200-grit, 2400-grit, and 4000-grit. Cross-sectional images of the entire culm wall were created by stitching individual images. The fiber volume fraction with respect to position in the culm wall was then obtained manually with image analysis using Image J, an open-source image analysis software package developed at the National Institutes of Health.
3.2 Bending
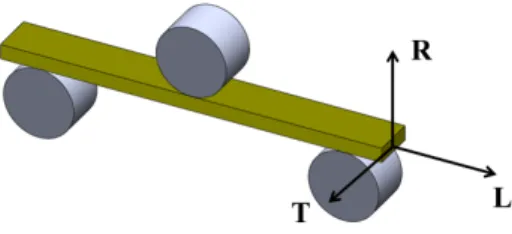
Small beams were cut at various longitudinal (bottom, middle, and top of the sections) and radial (inside, middle, and outside of the culm wall) positions from all the culm materials. The inner terminal and outer epidermal layers were removed. The length, width, thickness and mass of each specimen were recorded and the density calculated. Specimens dimensions fell into the following ranges: length (along the axial direction) 100-160 mm, width (along the tangential direction) 5-20 mm, and thickness (along the radial direction) 1-6 mm. Span was set such that the span to depth ratio was no less than 20. A schematic of the test orientation is shown in Figure 1. The beams were tested with inner surface face down, i.e. with the lower density side in tension. Note that the thicknesses of Moso specimens from Li's study were not reported, but are likely larger than the range given for the specimens, as in the Li study, specimens were prepared by sanding away the inner and outer layers (Li, 2004). The flexural test specimens’ small sizes and low MC must be considered when viewing the results with respect to bamboo structural members. Specimens were tested in three-point bending in an Instron model 4201, at a speed of 1mm/min, with the central deflection measured by a linear variable differential transducer and load measured by 500 N load cell. All of the Guadua and Tre Gai flexural tests were performed as part of this study. Some of the
Moso flexural tests were previously reported by Dixon and Gibson (2014) while the remainder are from the literature (Li, 2004). The modulus of elasticity (MOE) was calculated from the slope of the middle 80% of the linear elastic portion of the load-deflection curve (r2 > 0.99 for all fits) and the modulus of rupture (MOR) was calculated from the peak load.
3.3 Nanoindentation
Nanoindentation was performed on the solid fibers with a Hysitron TriboIndenter with a Berkovich tip and dynamic mechanical analysis transducer. Indent separation was 10 to 25 µm. A maximum load of 500 µN was used. Specimens from one culm section of each species (the same culm as was used for microscopy) were tested from different internodes, and fiber areas from the inside, middle, and outside of the culm wall thickness were tested. Oliver-Pharr analysis of the unloading curve was performed to determine reduced moduli (Oliver and Pharr, 1992).
3.4 Chemical Composition
The materials used in the analyses consisted of the full culm wall material from an internode from one culm section of each species (same culm used for microscopy and nanoindentation). Internodes were chosen for each species, in an attempt to minimize differences in densities and fiber volume fractions. No ash analysis was performed. The extractives content was obtained by acetone extraction for 6 h in a Soxhlet apparatus. The extracted bamboo samples were then used to determine the carbohydrates and lignin composition according to the analytical method NREL/TP-510-42618 issued by the US National Renewable Energy Laboratory (Sluiter et al., 2008). Monosaccharides were determined by high
performance anion exchange chromatography with pulse amperometric detection in a Dionex ICS-3000 system. Acid-insoluble (Klason) lignin was determined gravimetrically and acid-soluble lignin (ASL) was determined in a Shimadzu UV-2550 spectrophotometer at a wavelength of 205 nm. Duplicates were run for total carbohydrates, lignin, and extractives contents.
3.5 X-Ray Scattering Measurements
The relative sample crystallinities and the microfibril angle (MFA) distributions of the samples were determined from wide-angle X-ray scattering (WAXS) measurements of radial slices (tangential
thicknesses ranging from 1.4 to 1.8 mm). Three duplicates from an internode of a single culm section (the same internode and culm section combination used for chemical analysis) of each bamboo species were measured with perpendicular transmission geometry for 30 min per sample.
Two-dimensional WAXS patterns were measured with the MAR345 image plate detector and analyzed in MATLAB. Copper Kα1 wavelength (1.541 Å) was selected with a monochromator and a
totally reflecting mirror. Data were corrected for air scattering, read-out noise, polarization from the sample and the monochromator, and detector geometry (flat panel) prior to integration over azimuthal angles (crystallinity) or selected scattering angles (orientation, i.e. MFA) that was followed by the angle-dependent absorption correction.
To separate the contribution of crystalline cellulose in order to determine the MFA distribution, a background representing the scattering from the amorphous parts was determined from the average scattering intensity in two scattering angle regions: 2θ = 12…14° and 2θ = 24.5…26°. To minimize the overlap of scattering peaks only two 40-degree azimuthal regions were used. These were selected to be perpendicular to the line containing the strongest of cellulose reflections in these scattering angles (200, 110 and ). The average intensities of these regions were used to calculate a linear background for the scattering angles of 22 to 24° that were used to produce the MFA distribution corresponding to the azimuthal intensity profile of the cellulose Iβ reflection 200.
Because the bamboo cell wall is a multilayer structure where the microfibril orientation varies in layers (Crow and Murphy, 2000; Parameswaran and Liese, 1980), it could not be expected to be able to separate each contribution. Rather the MFA distribution was characterized by subtracting a linear background from the azimuthal profiles and fitting Gaussian peak pairs to the data, similar to the method in Peura et al., 2008 and Y. Wang et al., 2012 and the results correspond to the total contribution of all the cell wall layers. Two peak pairs were fitted within -30° to +30° of the sharp peak (corresponding to the preferred orientation) and one peak pair was fitted to +30…+90° (and symmetrically to -30°…-90°). These peaks were characterized by parameters called the average MFA, the standard deviation of the MFA and the T-parameter determined with the method of Cave, 1966. The latter method considers only
the peak at 0° and as such does not represent well the MFA distribution for the samples, but using the T-parameter, the current study’s results can be compared with the literature values (with <MFA> = 0.6 T; Yu, 2007; Wang, 2010).
The crystallinity was obtained by fitting the data integrated azimuthally 180° at scattering angles 13 to 48° with a linear superposition of 15 strongest reflections of cellulose Iβ (Nishiyama et al., 2002) and a scattering intensity curve of sulphate-lignin for modelling the amorphous parts. Due to low ambient humidity (15%), low sample MC (4 to 6%) and small MC differences between the species, no water background correction was done to the data. The crystallinity was calculated from the area of the amorphous background relative to the sample intensity as
48 0 13 48 0 13
2
1
1
2
amorph amorph sample sampleI
d
I
dq
C
I
dq
I
d
(1)Because no single measurement geometry can produce crystallinity values that are independent of the sample texture (Paakkari et al., 1988), the obtained values should be considered to represent only relative differences between the samples. It should be noted that only those samples that have a similar kind of texture (i.e. the MFA distribution) can be compared reliably with each other.
4 Results and Discussion
4.1 Microscopy
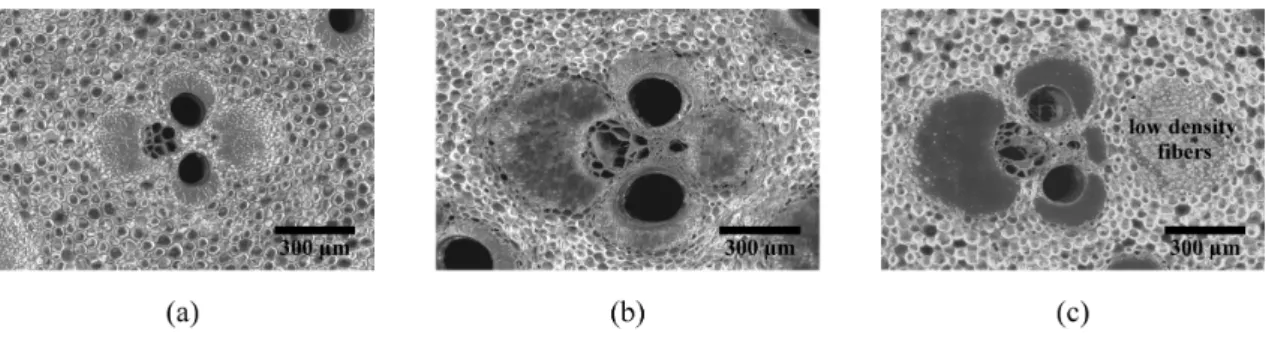
Figure 2(a-c) depicts low vacuum secondary mode micrographs of vascular bundles from the
middle of the culm wall of each species. In the vascular bundles of Moso and Guadua bamboo, the fibers are all extremely dense while in those of Tre Gai, there are also some lower density fibers.
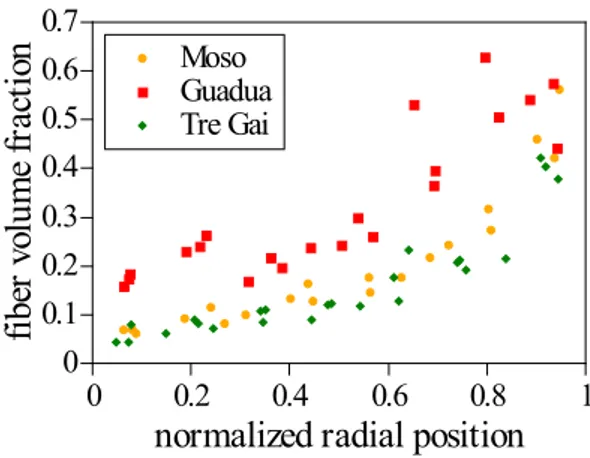
Figure 3 shows the fiber volume fraction plotted against the normalized radial position; the fiber
volume fraction includes only the extremely dense fibers. The normalized radial quantity is the distance from the inner edge of the culm wall divided by the total culm wall thickness. The Moso and Tre Gai have similar volume fractions of fibers, and similar variations across the culm wall, while the Guadua has
generally a higher fiber volume fraction but similar distribution. The average fiber volume fraction obtained for each species are 0.20 for Moso, 0.33 for Guadua, and 0.16 for Tre Gai.
4.2 Flexural tests
Figure 4 depicts a typical load deflection curve, showing initial linear elasticity, a peak stress,
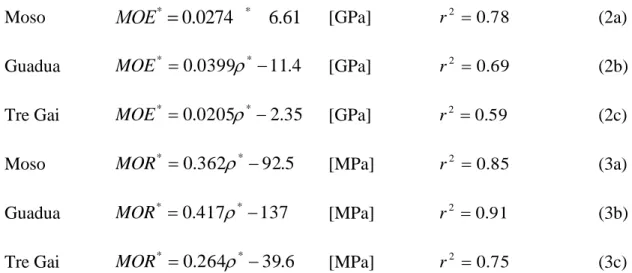
and subsequent failure. Figure 5 shows the axial MOE and MOR as a function of density. The
longitudinal mechanical properties of wood tend to vary linearly with density (Gibson and Ashby, 1997; Wangaard, 1950), and linear descriptions for bamboo are used. The best fit linear equations of the flexural properties with respect to density are:
Moso
MOE
*=
0.0274
r
*-
6.61
[GPa]
r2 0.78(2a)
Guadua
MOE
*
0
.
0399
*
11
.
4
[GPa]
r2 0.69(2b)
Tre Gai
MOE
*
0
.
0205
*
2
.
35
[GPa]
r2 0.59(2c)
Moso
MOR
*
0
.
362
*
92
.
5
[MPa]
2 0.85r
(3a)
Guadua
MOR
*
0
.
417
*
137
[MPa]
2 0.91r
(3b)
Tre Gai
MOR
*
0
.
264
*
39
.
6
[MPa]
r2 0.75(3c)
Note the Moso relationships were obtained using the two combined data sets of Dixon and Gibson (2014) and Li (2004).The MOE values of the Moso and Tre Gai bamboos and their variations with density are similar. Most of the densities tested for these species are in the range of 400 to 850 kg/m3 with associated range of MOE from 5 to 20 GPa (Fig 5a). This range of MOE is consistent with that of Young’s modulus from tensile tests of Moso (Amada and Untao, 2001; Nogata and Takahashi, 1995; Shao et al., 2010). The range of densities of the Guadua specimens, roughly 500 to 1000 kg/m3, was higher than that of the Moso and Tre Gai specimens. At a given density, the Guadua has a higher MOE than the Moso and Tre Gai; this, combined with the higher densities of the Guadua, gives rise to a higher range of values of MOE, from 10 to 35 GPa, for most of the data (Fig. 5a). Moso bamboo has the lowest scatter in MOE with
respect to density, in spite of the difference in moisture content between the specimens tested in this study and those from the literature (Li, 2004). This is a surprising result given that the MOE of bamboo
increases with decreasing moisture content. Using a standard correction for moisture content, extending its lower bound from 5% to 4% moisture content (JG/T 199, 2007), the MOE for Li's data was estimated if it was at 4% moisture content, consistent with the Moso specimens in this study. This increases Li's reported MOE by 9%. Then assuming no shrinkage from 10% to 4%, the densities of Li’s specimens can be reduced based on the moisture content. These adjustments change eqn (2a) to
MOE*0.0296
*6.56 [GPa] r2 0.74 (4) There is no statistical difference between the data of Dixon and Gibson (2014) and that of Li (2004), corrected for moisture content, at an α-level of 0.05. The largest scatter is observed in the Tre Gai values.The higher density range of Guadua is consistent with its higher volume fraction of fibers (Figs.
3, 5). The explanation of the higher MOE values for Guadua at given density compared with those of
Moso and Tre Gai, especially apparent at high densities, is not quite as clear. One would expect that the higher fiber volume fraction would be linked to a higher MOE and higher density, by the same rule of mixtures, and thus the MOE values at a given density would be similar. A possible explanation is that the species may have different solid cell wall properties, with Guadua having a higher solid cell wall (fiber) MOE. This is discussed further below.
Like the axial MOE, the axial MOR of each species shows a linear relationship with density (Fig
5b). All three species show similar MOR values at a given density. The densities of the three species
overlap in the range of 400 to 900 kg/m3, with associated MOR values of about 50 to 250 MPa. The MOR data have less scatter than the MOE data, both within and among individual species. The scatter among species appears no greater than that within the individual species. A single linear MOR – density relationship describes all the results well:
Moso, Guadua, Tre Gai
MOR
*
0
.
353
*
87
.
0
[MPa]
r
2=
0.88
(5)
This is a surprising result, given the MOE of the Guadua is higher than that of the other two species.However, in a similar work comparing Moso and Guadua using larger beams with approximately half of the full culm wall, de Vos obtains similar results: Guadua is substantially stiffer than Moso, but not stronger (de Vos, 2010). Elastic modulus reflects the average deformation over the entire specimen, while failure may depend on a characteristic flaw that occurs independent of the species. The bamboo microstructure may give rise to similarly sized flaws in the beams with a characteristic failure mechanism, causing all species to fail at similar stresses at given density, as suggested by Janssen (1981). On a finer level, the solid cell walls of the three species could have different elastic moduli, but similar strengths, as the weakest link of the cell wall, which is likely similar in all three species (same chemical constituents and similar bonding), would likely govern failure.
Assuming the solid cell wall density of bamboo to be the same as that of wood, which is
commonly taken as 1500 kg/m3 (Gibson and Ashby, 1997; Wangaard, 1950), the solid cell wall properties of bamboo can be estimated by extrapolating the best fit equations to this density. Due to the large scatter and correspondingly low r2 values in the Guadua and Tre Gai MOE – density fits there is some
uncertainty in the extrapolated value; however, the extrapolations serve comparison purposes. The extrapolated solid cell wall MOE values are 34.5 GPa for Moso (37.8 GPa, correcting the Li (2004) data for moisture content, eqn 3), 48.5 GPa for Guadua and 28.4 GPa for Tre Gai. The extrapolated solid cell wall MOR values are 451 MPa for Moso, 489 MPa for Guadua and 356 MPa for Tre Gai. The
extrapolated MOE value of Moso is quite similar to that of wood, 35 GPa, (Gibson and Ashby, 1997) and direct measurements of the axial Young’s modulus of Moso bamboo fibers which gave average values in the 30 to 35 GPa range (Yan-hui et al., 2012; Yu et al., 2011). The Tre Gai solid cell wall MOE is lower than that of Moso and wood, whereas the MOE of Guadua is higher than the MOE of wood. The extrapolated solid cell wall MORs of Moso and Guadua are similar, while that of Tre Gai is lower.
It is worth noting that extrapolating flexural properties is slightly problematic. The MOE is not a true Young’s modulus as shear deformation occurs (Bodig and Jane, 1982). The span to depth ratio was kept large (> 20) in the current study’s tests to minimize this effect. The MOR is not a true strength value; bending is governed by both tension and compression, and MOR is calculated assuming elastic behavior
(Wangaard, 1950). Axial bending properties (MOE and MOR) are often tabulated for wood, due to their importance for structures and experimental simplicity. The properties are considered meaningful and consistent measures of stiffness and strength (Forest Products Service, 2010; Wangaard, 1950).
In addition to comparing extrapolated properties, the values can be compared directly. The MOE and MOR results in the 550 to 750 kg/m3 density range (which overlaps for all three species) can be compared with two sample t-tests and the Bonferroni correction. In comparing the density distributions of the species in this range, the smallest p-value obtained is 0.0859, found between Tre Gai and Guadua. Therefore differences in the density distributions are not statistically significant at common α-levels of 0.05 or 0.01. Thus densities in this range are similar enough to merit some comparison. The MOE p-values are as follows: between the Moso and Guadua p=4.2 * 10-9, between Tre Gai and Guadua p=0.0025, and between Tre Gai and Moso p=0.076. This analysis implies Guadua may have the stiffer plant tissue at a given density than the two others, which are similar. The smallest p-value found for the MOR is 0.81 (between Moso and Guadua), thus there is no statistical significance at typical α-levels.
4.3 Nanoscale: nanoindentation, chemical composition, X-ray scattering
Average reduced modulus and hardness from nanoindentation tests for each species are shown in
Table 1. Once again, the similarities between the Moso and the Tre Gai bamboos are apparent, while the
Guadua has higher values of reduced modulus and hardness. The Moso nanoindentation reduced modulus values obtained are on the lower end of literature values, which range from about 14 to 20 GPa (X. Wang et al., 2012; Yu et al., 2011, 2007). This difference may be attributed to the relatively simple sample preparation method used in the current work. For instance, this study’s nanoindentation specimens were prepared by embedding in atmosphere followed by wet polishing and subsequent drying, rather than microtoming of specimens embedded in resin in vacuum; the less damaged surfaces from microtoming and the drying from embedding in vacuum both tend to increase reduced modulus values. All the values of reduced moduli for all species are within the range obtained on wood fibers: 13 to 21 GPa (Gindl and Schöberl, 2004). It should be noted that since indentation produces a multiaxial stress state beneath the indenter, the reduced modulus is a measurement of a combination of the elastic constants of material. In
the case of highly anisotropic materials like wood and bamboo, evaluation of the elastic constants in a particular direction is difficult by indentation (Eder et al., 2013; Gamstedt et al., 2013; Gindl and Schöberl, 2004).
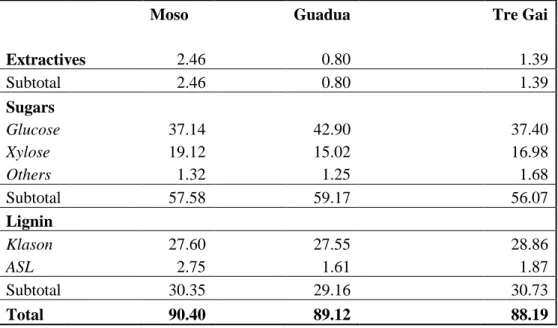
Table 2 gives the measured chemical composition of the species. Guadua has somewhat higher
glucose content compared with the Moso and Tre Gai species. Glucose corresponds to the cellulose (Fengel and Wegener, 2003) and crystalline cellulose gives rise to the outstanding mechanical properties of ligno-cellulosic materials (Gibson, 2012; Mishnaevsky and Qing, 2008). The results of the chemical analysis, coupled with those from nanoindentation, suggest that the mechanical properties of the solid cell wall of the fiber of Guadua may be higher than those of the other two species.
Only ca. 90% of the bamboo mass of each species was accounted for by the analysis. The ash content range for bamboo is reported to be between 0.75 and 2.87% (Jiang, 2007), and the ash content is likely to be artificially inflated by the borate treatments. Other unaccounted mass corresponds to acetyl and uronic acid groups bound to xylose units in the xylan (Fengel and Wegener, 2003). The remaining unaccounted mass could also be partially made up of extractives that were not removed by the acetone extraction, as the determined extractives content is low compared with the reported range of hot water extractives 5.0 to 12.5% in the literature (Jiang, 2007).
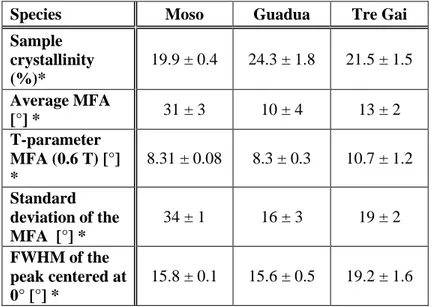
The MFA distributions of all the samples featured a sharp peak at 0° and a flat distribution of all the orientation angles, as is evident from the azimuthal intensity profiles (Fig. 6). The peak corresponds to a preferred orientation while the flat distribution shows that not all crystallites follow this preferred orientation. The T-method of Cave (1966) shows that the preferred orientation peak is slightly wider in Tre Gai than in Moso and Guadua (Table 3). The T-method MFA values are similar to others measured for bamboo, which have a range of 8 to 11˚ (Wang et al., 2010; Yan-hui et al., 2012; Yu et al., 2007). The impact of preferred orientation, based on the average MFA (Table 3) and the azimuthal profiles in Fig. 6, was strongest in Guadua and weakest in Moso. The azimuthal intensity profiles of the 004 reflection (data not shown) suggested similar trends as those shown in Fig. 6. However, the magnitude of the differences between the plant species was much smaller. This implies that the differences in the profiles shown in
Fig. 6 cannot be explained only with differences in the MFA distribution but that other factors, such as
the shape of the cells, might also affect the profile shape to some smaller degree.
The crystallinities of the samples (Table 3) did not show large differences between the bamboo species although the values matched the trend of glucose content shown in Table 2, suggesting that the higher sample crystallinity for Guadua could be due to the higher cellulose content rather than the higher crystallinity of cellulose. The relative sample crystallinity values (Table 3) can be compared to those of wood samples with similar MFA distributions that are measured using the same measurement geometry. Previous results on samples of oak wood from the Swedish warship Vasa (Svedström et al., 2012) showed similar crystallinity values while those of balsa (Ochroma pyramidale) (Borrega et al., 2015) were much higher. Small differences in the sample crystallinity values between the bamboo species can also be due to the differences in the orientation distribution of the cellulose microfibrils and might not be an
independent result.
Guadua has the highest reduced modulus and fiber hardness, highest cellulose content, highest crystallinity and strongest microfibril orientation of the three species, while Moso and Tre Gai have generally comparable values of these parameters. Together these results suggest that Guadua has the highest cell wall mechanical properties along the axial direction, and therefore should have the highest macroscopic mechanical properties in that direction. Macroscopic bending tests show Guadua to be stiffer at a given density and yield a higher extrapolated cell wall MOE, compared with Moso and Tre Gai species. However, these nanoscale characteristics could partially be influenced by the microscale: the higher cellulose content, crystallinity, and microfibril orientation of Guadua could be due to the higher volume fraction of fibers present in Guadua. The microstructural differences likely partially give rise to the differences seen in the nanoscale measurements. However, all measurements provide evidence that Guadua is stiffer in the axial direction than Moso and Tre Gai.
5 Conclusions
The structure and mechanical properties of bamboo are becoming increasingly relevant as sustainable construction alternatives are used more frequently in the modern world. This work examines
the properties of three common species of bamboo: Moso, Guadua and Tre Gai. The MOE and MOR values were analyzed using linear relationships with density. For all three species the MOR values could be better described using linear relations than the MOE values. The MOE of Guadua is higher than that of Moso and Tre Gai for a given density while the MOR values of all three species are found to be similar at a given density. This observation suggests the solid cell wall of Guadua is stiffer, a possibility further supported by nanoindentation, chemical analysis, and X-ray scattering measurements. From this initial study, Guadua’s higher MOE would suggest that of the three species studied, it is best suited in
deflection-limited structural applications. However, from this study the MOE of Moso has the least scatter with respect to density, possibly making it ideal in variability reduction approach. Interestingly, the MOR-density relationships for all three species are essentially the same, presenting interesting
possibilities for the strength prediction of SBP. However, larger scale (more culms, different species, and additional types of loading) testing programs are recommended to gain a better understanding of the mechanical differences between species of bamboo to determine the optimal material from a purely mechanical view.
Acknowledgements
This paper is based upon work supported by the National Science Foundation under OISE: 1258574. The views expressed in this paper are not endorsed by the National Science Foundation. The authors would like to thank Alan Schwartzman for training and assistance with the Hysitron TriboIndenter used in the nanoindentation tests.
References
Amada, S., Ichikawa, Y., Munekata, T., Nagase, Y., Shimizu, H., 1997. Fiber texture and mechanical graded structure of bamboo. Compos. Part B Eng. 28B, 13–20.
doi:10.1016/S1359-8368(96)00020-0
Amada, S., Untao, S., 2001. Fracture properties of bamboo. Compos. Part B Eng. 32, 451–459. Archila-Santos, H.F., Ansell, M.P., Walker, P., 2014. Elastic properties of thermo-hydro-mechanically
modified bamboo (Guadua angustifolia Kunth) measured in tension. Key Eng. Mater. 600, 111– 120. doi:10.4028/www.scientific.net/KEM.600.111
Company Inc., New York, NY.
Borrega, M., Ahvenainen, P., Serimaa, R., Gibson, L., 2015. Composition and structure of balsa
(Ochroma pyramidale) wood. Wood Sci. Technol. 49, 403-420. doi:10.1007/s00226-015-0700-5 Cave, I., 1966. Theory of X-ray measurement of microfibril angle in wood. Forest Prod. J. 16, 37–43. Correal D, J.F., Arbeláez C, J., 2010. Influence of age and height position on Colombian Guadua
angustifolia bamboo mechanical properties. Maderas Cienc. Tecnol. 12. doi:10.4067/S0718-221X2010000200005
Correal, J.F., Echeverry, J.S., Ramírez, F., Yamín, L.E., 2014. Experimental evaluation of physical and mechanical properties of Glued Laminated Guadua angustifolia Kunth. Constr. Build. Mater. 73, 105–112. doi:10.1016/j.conbuildmat.2014.09.056
Crow, E., Murphy, R.J., 2000. Microfibril orientation in differentiating and maturing fibre and
parenchyma cell walls in culms of bamboo (Phyllostachys viridi-glaucescens (Carr.) Riv. & Riv.). Bot. J. Linn. Soc. 134, 339–359.
De Vos, V., 2010. Bamboo for Exterior Joinery [BSc thesis]. International Timbertrade, Larenstein University.
Ding, X., Cai, H., Wu, Z., Chen, Y., Zhang, J., 2007. Systematic analysis on the quick development of bamboo industry in Zhejiang province: a case study for sucessful development approach of China’s booming bamboo industry. Chin. For. Sci. Technol. 6, 74–82.
Dixon, P.G., Gibson, L.J., 2014. The structure and mechanics of Moso bamboo material. J. R. Soc. Interface 11, 20140321–20140321. doi:10.1098/rsif.2014.0321
Eder, M., Arnould, O., Dunlop, J.W.C., Hornatowska, J., Salmén, L., 2013. Experimental micromechanical characterisation of wood cell walls. Wood Sci. Technol. 47, 163–182. doi:10.1007/s00226-012-0515-6
Fengel, D., Wegener, C., 2003. Wood: Chemistry, Ultrastructure, Reactions. Verlag, Munich. Forest Products Service, 2010. Wood Handbook. Forest Products Laboratory USDA, Madison,
Wisconsin.
Fu, J., 2001. Chinese moso bamboo: its importance. Bamboo 22, 5–7. Fu, J., 2000. Moso bamboo in China. Am. Bamboo Soc. Mag. 21, 12–17.
Gamstedt, E.K., Bader, T.K., Borst, K., 2013. Mixed numerical–experimental methods in wood micromechanics. Wood Sci. Technol. 47, 183–202. doi:10.1007/s00226-012-0519-2
Gibson, L.J., 2012. The hierarchical structure and mechanics of plant materials. J. R. Soc. Interface 9, 2749–2766. doi:10.1098/rsif.2012.0341
Gibson, L.J., Ashby, M.F., 1997. Cellular Solids: Structure and Properties, 2nd ed. Cambridge University Press, Cambridge, UK.
Gindl, W., Schöberl, T., 2004. The significance of the elastic modulus of wood cell walls obtained from nanoindentation measurements. Compos. Part Appl. Sci. Manuf. 35, 1345–1349.
doi:10.1016/j.compositesa.2004.04.002
Gottron, J., Harries, K.A., Xu, Q., 2014. Creep behaviour of bamboo. Constr. Build. Mater. 66, 79–88. doi:10.1016/j.conbuildmat.2014.05.024
Grosser, D., Liese, W., 1971. On the anatomy of Asian bamboos, with special reference to their vascular bundles. Wood Sci. Technol. 5, 290–312.
Janssen, J.J.A., 1981. Bamboo in Building Structures [Doctoral thesis]. Technische Hogeschool Eindhoven, Eindhoven, Netherlands.
Jiang, Z., 2007. Bamboo and Rattan in the World. China Forestry Publishing House, Beijing, China. Kleinn, C., Morales-Hidalgo, D., 2006. An inventory of Guadua (Guadua angustifolia) bamboo in the
Coffee Region of Colombia. Eur. J. For. Res. 125, 361–368.
Klop, A., Cardenas, E., Marlin, C., 2003. Bamboo production chain in Ecuador. J. Bamboo Rattan 2, 327–343.
Le, H.T., Hancock, J.F., Trinh, T.-T., Ho, P., 1999. Germplasm resources in Vietnam: major horticultural and industrial crops. HortScience 34, 175–180.
Li, X., 2004. Physical, chemical, and mechanical properties of bamboo and its utilization potential for fiberboard manufacturing [Masters thesis]. Louisiana State University, Baton Rougue, LA. Lo, T.Y., Cui, H.Z., Tang, P.W.C., Leung, H.C., 2008. Strength analysis of bamboo by microscopic
investigation of bamboo fibre. Constr. Build. Mater. 22, 1532–1535. doi:10.1016/j.conbuildmat.2007.03.031
Mishnaevsky, L., Qing, H., 2008. Micromechanical modelling of mechanical behaviour and strength of wood: State-of-the-art review. Comput. Mater. Sci. 44, 363–370.
doi:10.1016/j.commatsci.2008.03.043
Mitch, D., Harries, K.A., Sharma, B., 2010. Characterization of Splitting Behavior of Bamboo Culm. J. Mater. Civ. Eng. 22, 1195–1199. doi:10.1061/(ASCE)MT.1943-5533.0000120
Nishiyama, Y., Langan, P., Chanzy, H., 2002. Crystal Structure and Hydrogen-Bonding System in Cellulose Iβ from Synchrotron X-ray and Neutron Fiber Diffraction. J. Am. Chem. Soc. 124, 9074–9082. doi:10.1021/ja0257319
Nogata, F., Takahashi, H., 1995. Intelligent functionally graded material: bamboo. Compos. Eng. 5, 743– 751.
Oliver, W.C., Pharr, G.M., 1992. An improved technique for determining hardness and elastic modulus using load and displacement sensing indentation experiments. J. Mater. Res. 7, 1564–1583. Paakkari, T., Blomberg, M., Serimaa, R., Jarvinen, M., 1988. A texture correction for quantitative X-ray
powder diffraction analysis of cellulose. J. Appl. Crystallogr. 21, 393–397.
Parameswaran, N., Liese, W., 1980. Ultrastructural aspects of bamboo cells. Cellul. Chem. Technol. 14, 587–609.
People’s Republic of China Ministry of Construction, 2007. Testing method for physical and mechanical properties of bamboo used in building (No. JG/T 199 2007). People’s Republic of China Ministry of Construction.
Peura, M., Müller, M., Vainio, U., Sarén, M.-P., Saranpää, P., Serimaa, R., 2008. X-ray microdiffraction reveals the orientation of cellulose microfibrils and the size of cellulose crystallites in single Norway spruce tracheids. Trees 22, 49–61. doi:10.1007/s00468-007-0168-5
Richard, M.J., Harries, K.A., 2015. On inherent bending in tension tests of bamboo. Wood Sci. Technol. 49, 99–119. doi:10.1007/s00226-014-0681-9
Shao, Z.-P., Fang, C.-H., Huang, S.-X., Tian, G.-L., 2010. Tensile properties of Moso bamboo (Phyllostachys pubescens) and its components with respect to its fiber-reinforced composite structure. Wood Sci. Technol. 44, 655–666. doi:10.1007/s00226-009-0290-1
Sluiter, A., Hames, B., Ruiz, R., Scarlata, C., Sluiter, J., Templeton, D., Crocker, D., 2008. Determination of structural carbohydrates and lignin in biomass. Lab. Anal. Proced.
Svedström, K., Bjurhager, I., Kallonen, A., Peura, M., Serimaa, R., 2012. Structure of oak wood from the Swedish warship Vasa revealed by X-ray scattering and microtomography. Holzforschung 66. doi:10.1515/hf.2011.157
Van Der Lugt, P., 2005. The bamboo sector in Colombia and Ecuador: a state-of-the-art analysis of opportunities and constraints. J. Bamboo Rattan 4, 421–440.
Vogtländer, J., van der Lugt, P., Brezet, H., 2010. The sustainability of bamboo products for local and Western European applications. LCAs and land-use. J. Clean. Prod. 18, 1260–1269.
doi:10.1016/j.jclepro.2010.04.015
Wangaard, F.F., 1950. The Mechanical Properties of Wood. John Wiley & Sons, Inc., New York, NY. Wang, X.Q., Li, X.Z., Ren, H.Q., 2010. Variation of microfibril angle and density in moso bamboo
(Phyllostachys pubescens). J. Trop. For. Sci. 22.
Wang, X., Ren, H., Zhang, B., Fei, B., Burgert, I., 2012. Cell wall structure and formation of maturing fibres of moso bamboo (Phyllostachys pubescens) increase buckling resistance. J. R. Soc. Interface 9, 988–996. doi:10.1098/rsif.2011.0462
Wang, Y., Leppänen, K., Andersson, S., Serimaa, R., Ren, H., Fei, B., 2012. Studies on the nanostructure of the cell wall of bamboo using X-ray scattering. Wood Sci. Technol. 46, 317–332.
Yan-hui, H., Ben-hua Fei, Yan, Y., Rong-jun, Z., 2012. Plant age effect on mechanical properties of MOSO bamboo (Phyllostachys heterocycla var. Pubescens) single fibers. Wood Fiber Sci. 44, 196–201.
Young, S.M., Judd, W.S., 1992. Systematics of the Guadua angustifolia Complex (Poaceae: Bambusoideae). Ann. Mo. Bot. Gard. 79, 737. doi:10.2307/2399719
Yu, Y., Fei, B., Zhang, B., Yu, X., 2007. Cell-wall mechanical properties of bamboo investigated by in-situ imaging nanoindentation. Wood Fiber Sci. 39, 527–535.
Yu, Y., Tian, G., Wang, H., Fei, B., Wang, G., 2011. Mechanical characterization of single bamboo fibers with nanoindentation and microtensile technique. Holzforschung 65, 113–119.
Tables
Table 1 – Nanoindentation results
Reduced moduli [GPa] Hardness [MPa]
Moso 14.9 ± 2.3 289 ± 64
Guadua 19.7 ± 4.9 596 ± 202
Tre Gai 13.8 ± 2.7 287 ± 97
Values are mean + standard deviation. Moso results are the same as those reported in (Dixon and Gibson, 2014).
Table 2 – Chemical compositions (weight fractions)
Moso Guadua Tre Gai
Extractives 2.46 0.80 1.39 Subtotal 2.46 0.80 1.39 Sugars Glucose 37.14 42.90 37.40 Xylose 19.12 15.02 16.98 Others 1.32 1.25 1.68 Subtotal 57.58 59.17 56.07 Lignin Klason 27.60 27.55 28.86 ASL 2.75 1.61 1.87 Subtotal 30.35 29.16 30.73 Total 90.40 89.12 88.19
Table 3 – X-ray scattering results
* (mean ± standard deviation)
MFA = microfibril angle, FWHM = full width at half maximum
Species Moso Guadua Tre Gai Sample crystallinity (%)* 19.9 ± 0.4 24.3 ± 1.8 21.5 ± 1.5 Average MFA [°] * 31 ± 3 10 ± 4 13 ± 2 T-parameter MFA (0.6 T) [°] * 8.31 ± 0.08 8.3 ± 0.3 10.7 ± 1.2 Standard deviation of the MFA [°] * 34 ± 1 16 ± 3 19 ± 2 FWHM of the peak centered at 0° [°] * 15.8 ± 0.1 15.6 ± 0.5 19.2 ± 1.6
Figure 1 – Bending test specimen orientation, R – radial, L – longitudinal (axial),