Developing Global Inventory and Resupply Forecasting Policies
for the Vaccines Industry
By
Julia Stark
B.S. Mechanical Engineering, University of Michigan, Ann Arbor 2004
Submitted to the MIT Sloan School of Management and the Department of Mechanical
Engineering in Partial Fulfillment of the Requirements for the Degrees of MASSACHUSETTS INSTITUTE,
OF TECHNOLOGY
Master of Business Administration
and
JUN 15 2011
Master of Science in Mechanical Engineering
In conjunction with the Leaders for Global Operations Program at the
LIBRARIES
Massachusetts Institute of TechnologyJune 2011
ARCHIVES
@ 2011, Julia A. Stark. All Rights Reserved.
The author hereby grants MIT permission to reproduce and to distribute publicly copies of this thesis document in whole or in part in any medium now known or hereafter created.
Signature of AutV
May 6, 2011 Department of Mechanical Engineering,JT Sloan SrhnI of Management
Certified by
Donald Rosenfield, Thesis Supervisor Senior Lecturer, MIT Sloan School of Management Certified by
David Simchi-Levi, Thesis Supervisor Professor. Enaineering Svetame nivicinn and Civil Engineering Certified by
v uavia Hardt, Thesis Reader Professor, Department of Mechanical Engineering Accepted by
Debbie Bere man, Executive Director of MBA Program
rAI1rnin rrhnnI nf Anagement
Accepted by
David Hardt, Chaifnan, Committee on Graduate Students Professor, Department of Mechanical Engineering
This page intentionally left blank.
Developing Global inventory and Resupply Forecasting Policies
for the Vaccines Industry
by
Julia Stark
Submitted to the MIT Sloan School of Management and the Department of Mechanical Engineering on May 6, 2011 in Partial Fulfillment of the Requirements for the Degrees of Master
of Business Administration and Master of Science in Mechanical Engineering
ABSTRACT
Appropriate inventory management is important for many businesses throughout the world. For the vaccines industry, appropriate inventory policies impact both the business' profitability and people's lives. An optimal policy must consider challenges such as product expiration, country specific SKUs, and a challenging regulatory environment. This thesis discusses an inventory forecasting tool developed for
Novartis Vaccines that that can be used to determine appropriate inventory policies and forecast resupply needs.
Novartis Vaccines factories ship vaccines to Novartis operated warehouses throughout the world. The inventory at these warehouses is used to meet customer demand. Each country's warehouse is
responsible for managing its local inventory and forecasting orders to the manufacturing team. Changes to the forecast can lead to costly manufacturing rework and local stock-outs. Inappropriate inventory policies can lead to high inventory holding costs and product expiration leading to scrap.
The results of this project show that the best inventory and resupply planning methods differ for different types of vaccines in different markets. The tool developed looks at differences such as sales volume and seasonality, distribution methods and costs, product shelf life, and the transfer price to
provide an optimal inventory and resupply forecast. The tool was tested in four countries with several SKUs in each country and identified approximately 50,000 Euros in savings per country. If the tool was applied to all 25 countries and similar savings were seen in each country, the organization will save 1.25 Million Euros.
Thesis Supervisor: Donald Rosenfield
Title: Senior Lecturer, MIT Sloan School of Management Thesis Supervisor: David Simchi-Levi
Title: Professor, Engineering Systems Division and Civil Engineering
This page intentionally left blank.
Acknowledgements
I would like to thank Novartis Vaccines & Diagnostics for the opportunity to learn about the business
and participate on a project with such great impact. This project was largely successful because of the great people I was able to work with and learn from. My supervisor, George Clothier, constantly helped me scope the project, explore solutions, and test hypothesizes. Stuart Dickson, my project champion, was critical in helping me understand the importance of the Novartis Vaccines mission. Additionally, I would like to thank the Commercial Supply Chain team who made time in their busy schedules to help me understand the business and answer my questions. Special thanks to my colleagues Kristina
Mumber and Katia Thierry who provided me not only important business context but also welcomed me into their personal lives.
The MIT support I received was also incredible. Thank you to my advisors Don Rosenfield and David Simchi-Levi for their technical and management advice. Their help led to the comprehensive model and the overall success of this project. Additionally, thank you to LGO 2011 class which has made the last two years a spectacular experience.
Lastly, I would like to thank my friends, family, and husband for their support. Thank you to my Mom and Dad whose lessons have made me who I am today and to my husband, Brian, for putting up with my obsession for travel and encouraging me to move to Switzerland for this project.
This page intentionally left blank.
Table of Contents
ABSTRACT...3
ACKNOW LEDGEM ENTS ... 5
TABLE OF CONTENTS...7
LIST OF FIGURES... 9
LIST OF EQUATIONS ...--- 10
1. INTRODUCTION ... 11
1.1. NOVARTIS COMPANY OVERVIEW...- ... 11
1.2. NOVARTIS VACCINES AND DIAGNOSTICS ... 11
1.3. THESIS M OTIVATION...-...--... 12
1.4. PROJECT OBJECTIVE ...---.--... 13
1.5. RESEARCH M ETHODOLOGY ... 14...14
1.6. THESIS OUTLINE ...----.--... 14
2. INVENTORY AND RESUPPLY PLANNING MANAGEM ENT ... 16
2.1. GENERAL INVENTORY AND RESUPPLY CALCULATION M ETHODS ... 16
2.1.1. Safety Stock ... 16
2.1.2. Resupp ly Point ... 17
2.1.3. Resupply Quantity ... 17
2.2. CHALLENGES FOR THE VACCINES INDUSTRY ... 18
2.2.1. Shelf Life ... ... 18
2.2.2. Regulatory...18
2.2.3. Service Level ... 19
2.2.4. Product Type...19
2.2.5. Dem and Variations...19
2.3. NOVARTIS VACCINES M ETHODS...20
2.3.1. Sales and Operations Planning Process...20
2.3.2. Dem and Phase Current State Analysis ... 21
2.4. CHAPTER SUMMARY ...---... 23 3. M ODEL ...----.... . ---... 25 3.1. INTRODUCTION ...----... ---... 25 3.2. M ODEL CALCULATIONS ...---.-... .... - --...26 3.2.1. Safety Stock ... ... ... ... 26 3.2.2. Resupply Point... ---.. 30
3.2.3. Resup ply Quantity ... 31
3.2.4. Inventory...---...---....43 3.3. USERINTERFACE...-- - - - -... 43 3.3.1. Inputs...--..-... 43 3.3.2. Calculations ... ---. ---... 44 3.3.3. Results ...---.-... ---.-... 44 3.4. M ODEL USEFULNESS... ... ...-- - - . - ... 44
3.5. M ODEL AND TOOL LIMITATIONS ...---.-... 45
3.6. AREAS FOR IMPROVEMENT ... 47
3.7. SUMMARY ... 48
4. M ODEL VALIDATION... 49
4.1. M ETHODOLOGY... ... 49
4.2. LIMITATIONS OF OUR APPROACH ... 49
4.3. CASE STUDIES...49
4.3.1. Case 1: Long Shelf Life with M inim al Sales Fluctuation... 49
4.3.2. Case 2: Short Sellable Shelf Life ... 50
4.3.3. Case 3: Seasonal and M arket Trends... 51
4.4. SUMMARY ... 51
5. CONCLUSIONS AND RECOM M ENDATIONS ... 52
5.1. M ODEL REFINEMENT ... 52
5.2. ORGAN IZATIONAL ALIG NM E NT ... 52
5.3. TOOL USABILITY...53
5.4. POTENTIAL SAVINGS ... 53
5.5. IMPLEMENTATION...53
6. BIBLIOGRAPHY ... 55
7. APPENDIX A: THE NOVARTIS RESUPPLY PLANNING TOOL USER INTERFACE ... 56
7.1. INPUTS 1 ... 56
7.2. INPUTS 2 ... 57
7.3. INPUTS 3 ... 58
7.4. RESULTS...59
7.5. RESULTS DETAILS ... 59
8. APPENDIX B: VISUAL BASIC FOR APPLICATIONS CODE... 60
8.1. GO TO NEXT PLANNING PERIOD ... 60
8.2. SAVE A SCENARIO CODE ... 61
9. APPENDIX C: CASE STUDIES... 63
9.1. DATA FOR CASE 1: LONG SHELF LIFE W ITH M INIMAL SALES FLUCTUATION ... 63
9.2. DATA FOR CASE 2: SHORT SELLABLE SHE LF LIFE ... 66
9.3. DATA FOR CASE 3: SEASONAL AND M ARKET TRENDS ... 69
List of Figures
FIGURE 1. D ISTRIBUTION M ODEL ... 12
FIGURE 2. EXAMPLE OF HOW ONE COUNTRY MAY DEVELOP THEIR RESUPPLY PLAN ... 13
FIGURE 3. DEM AND AND SUPPLY PLANNING PROCESS ... 20
FIGURE 4. COUNTRIES OPERATING WITH A NOVARTIS BUSINESS UNIT ... 21
FIGURE 5. CURRENT STATE RESUPPLY PLANNING PROCESS BASED ON DEMAND AND CURRENT INVENTORY. ... 22
FIGURE 6. A BASIC EXAMPLE SHOW ING FORECASTED INVENTORY...26
FIGURE 7. RESUPPLY PLAN FOR EXAM PLE IN FIGURE 6...26
FIGURE 8. LOGIC FOR DETERMINING RESUPPLY QUANTITY ... 32
FIGURE 9. RECOMMENDED ORDER QUANTITY BASED ON TOTAL COSTS ... ... 33
FIGURE 10. SCENARIO A W HERE S, IS THE BEST ORDER QUANTITY ... ... 35
FIGURE 11. SCENARIO A WHERE EOQ2 IS THE BEST ORDER QUANTITY... ...36
FIGURE 12. SCENARIO A W HERE S2 IS THE BEST ORDER QUANTITY ... ... 36
FIGURE 13. SCENARIO A W HERE Si IS THE BEST ORDER QUANTITY ... 37
FIGURE 14. SCENARIO B WHERE E0Q IS THE BEST ORDER QUANTITY...37
FIGURE 15. SCENARIO C WHERE EOQ, IS THE BEST ORDER QUANTITY ... ... 38
FIGURE 16. LOGIC FOR DETERMINING QTC-."-.-. "-.---.---.-.--.---...39
FIGURE 17. LOGIC FOR DETERMINING QFREQUENCY-" " " -- "-.".-...42
FIGURE 18. DESCRIPTION OF INPUT TAB BACKGROUND COLORS ... ...44
List of Equations
EQUATION 1. ONE COUNTRY ORGANIZATION'S METHOD FOR FORECASTING INVENTORY...13
EQUATION 2. GENERALIZED SAFETY STOCK EQUATION...17
EQUATION 3. RESUPPLY POINT EQUATION ... 17
EQUATION 4. STANDARDIZED PAST SALES EQUATION ... 27
EQUATION 5. PAST SALES STANDARD DEVIATION STANDARDIZED TO MONTH J EQUATION... 28
EQUATION 6. SAFETY STOCK LEAD TIME EQUATION...29
EQUATION 7. LEAD TIME FACTOR EQUATION...29
EQUATION 8. SERVICE FACTOR EQUATION ... 29
EQUATION 9. SAFETY STOCK EQUATION ... 29
EQUATION 10. RESUPPLY POINT LEAD TIME EQUATION ... 30
EQUATION 11. LEAD TIME DEMAND EQUATION ... 30
EQUATION 12. RESUPPLY POINT EQUATION ... 30
EQUATION 13. RESUPPLY POINT WITH A SUPPLY BUFFER EQUATION... 31
EQUATION 14. RESUPPLY QUANTITY EVALUATION MONTH I... 32
EQUATION 15. TOTAL COSTS EQUATION...34
EQUATION 16. ECONOMIC ORDER QUANTITY EQUATION ... 34
EQUATION 17. SELLABLE SHELF LIF E EQUATION ... 40
EQUATION 18. FORECASTED SALES OVER THE SELLABLE SHELF LIFE EQUATION... ...40
EQUATION 19. RESUPPLY QUANTITY BASED ON SHELF LIFE EQUATION ... 40
EQUATION 20. INVENTORY EQUATION...43
1. Introduction
Novartis Vaccines' mission states "the only thing better than finding a cure for a disease is preventing illness in the first place" (1). To succeed in this mission, Novartis needs an end-to-end supply chain that is prepared to meet customer's needs. They must ensure that the right vaccine is in the right place at the right time to prevent the spread of illness and ultimately save lives. Unlike many other supply chains, the vaccine's industry faces several unique challenges. Two significant challenges are a difficult regulatory environment and a product with a limited shelf life. These two challenges guide the supply chain practices.
In the past, Novartis Vaccines has focused on improving the manufacturing supply chain: from raw materials to finished goods within the factory warehouses. To be an industry leader, they
must also focus their efforts on inventory throughout the world and make global strategic supply chain decisions.
1.1.Novartis Company Overview
Novartis is headquartered in Basel, Switzerland and employs approximately 100,000 associates in 140 countries. The company focuses on providing "...innovative products to prevent and cure diseases, to ease suffering and to enhance quality of life" (2). It's broad portfolio of products range from oncology pharmaceuticals to the influenza vaccine and has one of the most respected development pipelines (3). It is divided into four key areas (2):
* Pharmaceutics focusing on "innovative patent-protected medicines"
* Sandoz focusing on "affordable, high quality generic medicines and biosimilars"
* Consumer Health focusing on "strong, trustworthy brands for increasing knowledgeable consumers: OTC (Over-the-Counter), Animal Health and CIBA Vision"
* Vaccines and Diagnostics focused on "vaccines and diagnostic tools to protect against life-threatening diseases"
1.2.Novartis Vaccines and Diagnostics
Novartis Vaccines and Diagnostics was established in April 2006 when Novartis acquired Chiron. It is headquarter in Cambridge Massachusetts and in 2009 had net sales of $2.5 billion. The Vaccines business has a global presence, with manufacturing facilities in Germany, Italy, the
United Kingdom, India, and the United States. Novartis Vaccines supplies influenza, travel, and meningitis vaccines to nearly every continent (1).
1.3.Thesis Motivation
In the past several years, Novartis Vaccines has begun to switch from a third party distribution system to managing its own inventory in locations worldwide. They have warehouses in over 20 countries which are used to meet the needs of customers in that country. Figure 1 illustrates how vaccines move from the factory (manufacturing) to the local country warehouses to the end customer. Notice that product stored in one country cannot ship to another country's customers. This is because the product is often country specific. If customers in Country B want a vaccine that is in Country A, the product must return to the factory (or a 3rd party) where it is
relabeled and repackaged. At this point, it can ship to Country B's warehouse. This time consuming process prevents customers from receiving the right vaccine at the right time. As a result, each country warehouse needs inventory practices that are appropriate for their specific customer's needs. Country A Customers F7 FaSgo 7 Count Factory2
Figure 1. Distribution model
Each country's organization has a Commercial Operations team which is responsible for identifying and forecasting the local customer demand. These sales forecasts look at an 18-month time horizon and are re-evaluated and updated each 18-month. Using their sales forecast and information about the inventory they have in their local warehouse, they develop a resupply plan. The resupply plan is a request from the country's Commercial Operations
organization to the Manufacturing organization to provide a given quantity of vaccines in a given
week of the year. Figure 2 shows a simplified version of how a typical country organization may develop a resupply plan assuming it is currently December of 2010. In this example, forecasted inventory is calculated using Equation 1.
List of variables
1j =Forecasted inventory in month j
FSj = Forecasted sales for month j
Rj= Resupply plan for month
j
Calculate Inventory in month j+1'1+1 = Ij + Rj - FSj
Equation 1. One country organization's method for forecasting inventory
SKU ABC12345
FY2011 Jan-11 Feb-11 Mar-11 Apr-1I May-11I Jun-11 Jul-11 Aug-11I Sep-11 Oct-11 Nov-11 Dec-11
Sales forecast 2,000 2,500 3,000 4,000 4,500 7,500 8,000 8,000 8,000 6,000 3,000 2,000
Forecasted inventory 10,000 28,000 25,500 22,500 38,500 34,000 26,500 18,500 10,500 22,500 16,500 13,500
Resupply plan 20,000 20,000 20,000
FY2012 Jan-12 Feb-12 Mar-12 Apr-12 May-12 Jun-12
Sales forecast 2,500 3,000 3,000 5,000 5,500 8,000
Forecasted inventory 11,500 29,000 26,000 23,000 38,000 32,500
Resupply plan 20,000 20,000
Figure 2. Example of how one country may develop their resupply plan
Each country's Commercial Operations organization develops their resupply plan using different methods. Each unique method has various advantages and disadvantages; however, no method has been consistently successful. For example, non-optimal resupply planning methods have led to scrapping of inventory due to expiration of product, last minute requests for products from the manufacturing organization, and non-optimal inventory levels.
1.4.Project Objective
The goal of this research is to develop a standardized method that each country's Commercial Operations organization can use to determine the optimal resupply plan. This standardized method should help country organizations:
e Reduce excess inventory
e Reduce scrap and right-of-returns
e Reduce inventory and distribution costs
e Reduce last minute requests to the manufacturing organization
By improving the inventory and resupply planning methods used, the country organizations will
improve their profits and their ability to supply customers with the vaccines they need.
1.5.Research Methodology
The challenges faced by the vaccines industry are common among distribution organizations. Many companies have warehouses worldwide that supply local customers with goods. They must forecast sales and develop inventory and resupply methods that meet those sales needs. As a result, we can develop best practices for vaccines by understanding methods used
throughout other industries and modifying them to meet the unique challenges of the vaccines industry. To develop the optimal inventory and resupply planning methods, we had a five step process.
Step 1: We started by conducting a literature review. The information gathered in this process allowed us to benchmark other industries and identify potential methods.
Step 2: We interviewed stakeholders within the Novartis Vaccines organization focusing on people within manufacturing distribution and logistics, commercial operations sales force, and commercial operations resupply planners.
Step 3: We formed a small team of country resupply planners. This team represented the country organizations that would be a part of the initial pilot of the model and would provide valuable insight throughout the development of the model.
Step 4: We began the modeling process. Data was collected from both the manufacturing and commercial organizations. Frequent feedback from the pilot team was used to refine the model.
Step 5: We piloted the model in four countries. The data collected provided model validation and assessment for potential roll-out to the entire organization.
1.6.Thesis Outline
This document is organized into 5 chapters: 14 1 P a g e
* Chapter 1 provides an introduction to Novartis Vaccines and a brief description of the problem motivation and objective.
e Chapter 2 introduces inventory and resupply planning methods used throughout
industry. It explains the specific challenges faced by the vaccines industry and explains Novartis Vaccines' current methods for developing resupply plans.
e Chapter 3 describes the model and tool developed. It explains when the model is most useful as well as some of its limitations.
e Chapter 4 validates the model through the use of three case studies. * Chapter 5 closes the thesis with conclusions and recommendations.
2. Inventory and Resupply Planning Management
2.1. General Inventory and Resupply Calculation Methods
Inventory and resupply planning is based on several factors. The various methods used
throughout industry differ mainly by how a resupply is triggered and the size of the resupply (in most literature, resupply is referred to as an order but for purposes of this thesis, the term
resupply will be used). The most common policies are related to a few specific decision
variables: resupply point (RSP), review interval (R), resupply quantity (Q), and resupply level (L). In a R,L policy (review interval, resupply level), resupply is dependent on the review interval (R). The resupply quantity is determined by the quantity required to make current inventory equal the resupply level (L). If resupply is placed every review interval, this is called a base-stock
policy. This type of policy is applicable when there is periodic review of inventory and when the resupply quantity can be any value.
In a RSP,L policy (resupply point, resupply level), resupply is triggered by inventory reaching the resupply point (RSP). Similar to the R,L policy, the resupply quantity is determined by the quantity required to make current inventory equal the resupply level (L). This type of policy is applicable when there is a continuous review of inventory and resupply orders can be placed at any time. Additionally, it applies when the resupply quantity can be any value.
In a RSP,Q policy (resupply point, resupply quantity), resupply is triggered by inventory reaching the resupply point (RSP). The resupply quantity is determined by a set of factors that is
independent of current inventory levels. This type of policy applies when there is continuous review of inventory (4).
The method chosen for this research is a modified RSP,Q policy and the basic methods for determining RSP and Q are discussed below in Sections 2.1.1 thru 2.1.3.
2.1.1. Safety Stock
Safety stock is inventory kept to manage variability in demand. When variability in demand is high, a higher level of safety stock is maintained. When there is no variability in demand no safety stock is required. Equation 2 defines safety stock levels (5). It assumes that demand over different time intervals are independent.
List of Variables
Z = a value which corresponds to the desired inventory service level
GD = the standard deviation of demand during a single period T = lead time
Calculate Safety stock (SS)
SS = Z x O- X
NT
Equation 2. Generalized safety stock equation
2.1.2. Resupply Point
The resupply point is the inventory level which signals a resupply order. This value takes into account the consumption of the item during the lead time. The lead time is the time from when the order is placed until the order is received. Equation 3 defines the resupply point (5).
List of Variables
LTD = lead time demand. It is the future demand during the lead time
SS = safety stock
Calculate Resupply Point (RSP)
RSP = SS + LTD
Equation 3. Resupply point equation
2.1.3. Resupply Quantity
The resupply quantity is the number of units which should be forecasted when the resupply point is reached. Ideal resupply quantities are based on balancing inventory holding costs and order costs. This quantity is called the economic order quantity (EOQ) and is discussed further in Section 3.2.3.1.
2.2. Challenges for the Vaccines Industry
The general methods described in Section 2.1 apply to many industries including the vaccines industry. However, there are several challenges in the vaccines industry that must be understood in order to correctly apply and modify these methods.
2.2.1. Shelf Life
Similar to food, electronics, medical drugs, and human blood, vaccines are perishable and therefore have a shelf life (6). Perishable inventory policies can result in lower safety stock levels than normal inventory policies due to the cost associated with disposing of stock.
Additionally, resupply quantities are often lower than EOQ because they must consider the shelf life of the product (7). Infinite lifetime inventory policies can be applied in two scenarios: product shelf life is long or there is little variance in demand (8).
2.2.2. Regulatory
The regulatory environment for vaccines products impacts inventory and resupply policies. For example, each receiving country has different requirements for the product packaging such as languages, regulatory labels, ect. This impacts production; they must customize the product during the fill/finish process to meet the specific countries needs. Product customized for one country may not meet the regulatory requirements of another country. As a result, if demand changes, and the product is no longer required by the original country, the product may need to be re-packaged or scrapped. Therefore, it is critical the country specific demand does not change after the fill/finish process has begun. When there is demand in a specific country the resupply lead time associated with this fill/finish process must be considered so an order can be placed with sufficient time.
In additional to manufacturing fill/finish limitations, countries have various release protocols. When product arrives at the receiving country, it may require testing by the local regulatory agency. This process can take from 1 day to 3 months and can entail checks on verifying correct labeling, verifying that the cold chain was maintained, ect. As a result, this also significantly impacts the resupply lead time.
2.2.3. Service Level
Service level is a method used to measure the performance of a system. There are several definitions when considering the service level provided by inventory. Some common definitions include the probability that there will be no stock outs within an order cycle or a percent
demand that can be satisfied by stock (5).
The service level requirements in the vaccines industry are often higher than that in other industries because vaccines save lives. Due to this, the cost of not meeting demand is not only a monetary factor but also a social factor. This challenge leads to high safety stocks for many types of vaccines.
2.2.4. Product Type
Vaccines products can be divided into three major categories based on their inventory and resupply policies.
* Seasonal influenza vaccines (also referred to as seasonal flu vaccine) are vaccines that combat the three most common influenza viruses for the upcoming season (9). Each year, a new seasonal influenza vaccine is produced. As a result, last year's product is not sellable this year and must be scrapped.
e Emergency vaccines are those required for rare but serious illnesses. The regulatory
environment for these vaccines is often different than that for other vaccines. For example, for many vaccines in this category a single stock-keeping unit (SKU) can satisfy demand in all countries. As a result, inventory for every countries' demand can be pooled and product designated for one country's demand can be shifted to meet another country's demand quickly.
* All other vaccines are those that do not fall into the categories listed above. These types of vaccines include those for rabies, hepatitis, measles, mumps, polio, smallpox ect. Inventory for these vaccines face the challenges described in Section 2.2.1, 2.2.2, and 2.2.3. These types of vaccines are the focus of this research.
2.2.5. Demand Variations
Demand for vaccines in each country differs significantly based on several factors. Demand is significantly impacted by the protocols in each country. For example, one country may require that all school age children receive a specific set of vaccines while another country has no
requirements. Similarly, seasonal volume can vary. In the example above, the country that requires school age children to receive a specific set of vaccines will likely see a peak in demand right before the school season begins. These seasonality effects differ for each country and impact inventory and resupply policies.
2.3.
Novartis Vaccines Methods
2.3.1. Sales and Operations Planning Process
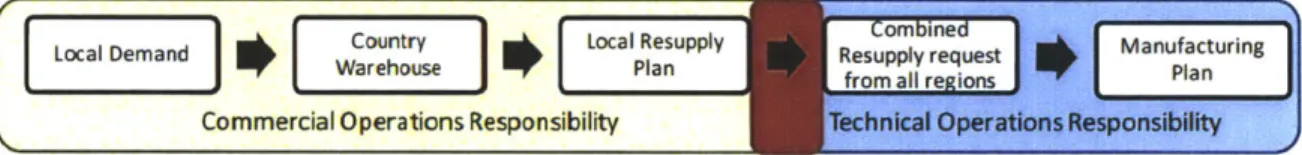
Country inventory and resupply planning at Novartis Vaccines is accomplished through a robust Sales and Operations Planning (S&OP) process which repeats monthly. During this process the commercial and technical operations organizations work together to determine how to balance supply with demand. Figure 3 depicts the demand and supply planning process. The interaction between demand and supply is shown in red.
m
I I Combined E'LI~d Locaoca
~.l
Country RoalResupply Resupp y Rsumpa requtesteupyrqst Imanufacturing~
Tt~ouJ lan rom all regions
Commercial Operations Responsibility
e
00 pens tFigure 3. Demand and supply planning process
There are four phases to the S&OP process:
1. Demand Phase: Each country and/or region is responsible for determining their needs from
the technical operations organization for the next 18 months. In order to determine this, they look at their expected sales in the local market. Additionally, when there are country warehouses, they use information about the local inventory. Using this information, commercial operations develops a resupply plan. This resupply plan is a forecast of their future orders. This resupply plan is communicated to the technical operations organization through the rolling forecast which is uploaded into SAP and is used during the next phase.
Improving this process is the focus of this research.
2. Supply Phase: Once the demand phase is complete, the technical operations team reviews the demand and develops a supply plan for each manufacturing site. Any situations where
manufacturing is unable to meet demand are identified.
3. Global S&OP Meeting Phase: All the supply plans are combined and presented. Any
discrepancies between the demand phase and the supply phase are discussed. Any issues that are not resolved will be escalated to the final phase.
4. Executive S&OP Phase: The supply plans are presented to the executive committee. Any issues that have not been resolved in the previous phases are resolve at this time. If necessary, the supply and rolling forecast are updated accordingly.
2.3.2. Demand Phase Current State Analysis
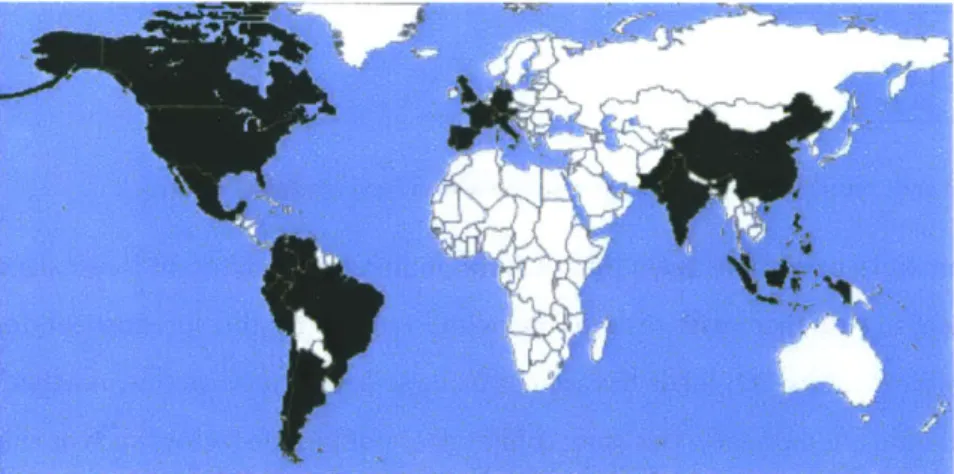
The demand phase is accomplished using different methods. Most countries commercial operations teams are responsible for developing their resupply forecast and entering this into the rolling forecast. Figure 4 depicts countries which operate with a Novartis business unit.
Figure 4. Countries operating with a Novartis business unit
In the countries colored in green, inventory is managed by a Novartis business unit and the country's commercial operations team is responsible for developing a resupply plan that is entered into the rolling forecast.
Since each commercial operations team in each country operates independently, each country's business unit used a different method to develop a resupply plan. In February 2010, there were three primary methods:
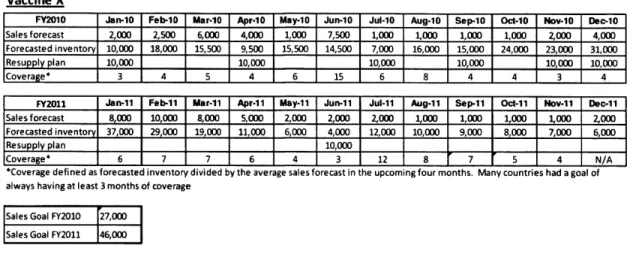
1. Based on demand and current inventory: This was the most common method used. The
sales and marketing team in the country forecast sales for each vaccine for the next 18 months. The resupply planner for the country enters these forecasted sales into an excel table which includes current inventory levels. The sales and marketing team, resupply
planner, and financial team then decide how large of resupply orders they wanted and the timing of these resupply orders. This represents the resupply plan. Once they develop the resupply plan, they enter the data into the rolling forecast for the technical operations team to view. Figure 5 shows an example of this method for a country.
Vaccine X
FY2010 Jan-10 Feb-10 Mar-10 Apr-10 May-10 Jun-10 Jul-10 Aug-10 Sep-10 Oct-10 Nov-10 Dec-10
Sales forecast 2,000 2,500 6,000 4,000 1,000 7,500 1,000 1,000 1,000 1,000 Z000 4,000
Forecasted inventory 10,000 18,000 15,500 9,500 15,500 14,500 7,000 16,000 15,000 24,000 23,000 31,000
Resupply plan 10,000 10,000 10,000 10,000 10,000 10,000
Coverage* 3 4 5 4 6 15 6 8 4 4 3 4
FY2012 Jan-11 Feb-11 Mar-11 Apr-11 May-11 Jun-1I Jul-11 Aug-i1 Sep-11 Oct-I1 Nov-11 Dec-11
Sales forecast 8,000 10,000 8,000 5,000 2,000 2,000 2,000 1,000 1,000 1,000 1,000 2,000
Forecasted invento 37,000 29 000 19,000 11,000 6,000 4,000 12,000 10,000 9,000 8,000 7,000 6,000
Resupply plan - 10,000
Coverage* 6 7 7 6 4 3 12 8 7 5 4 N/A
*Coverage defined as forecasted inventory divided by the average sales forecast in the upcoming four months. Many countries had a goal of always having at least 3 months of coverage
Sales Goal FY2010 27,000
Sales Goal FY2011 46,000
Figure 5. Current state resupply planning process based on demand and current inventory.
Each commercial operations team that uses this method has a different internally developed spreadsheet to help them with resupply planning. Frequently, this spreadsheet does not track expiration dates. This leads to vaccines being scrapped because they reached their
expiration date. Additionally, this spreadsheet does not include factors such as shipping costs, minimum resupply quantities, and lead times.
2. Based on demand, current inventory, and MRP: Rather than develop spreadsheets as shown in the "demand and current inventory" method, some commercial operations teams use MRP systems to help them do resupply planning. At Novartis, the MRP system utilizes the sales forecast and current inventory to develop a resupply plan. The resupply order is forecasted when inventory drops below a specific threshold. The resupply order size as well as the inventory threshold is set when the MRP system is implemented or when it is
manually updated.
This method has some advantages and disadvantages relative to the "demand and current inventory" method. Often, the resupply quantity that is set in the MRP system is
determined through a discussion with the technical operations team. This results in a resupply quantity that is reasonable; at least at the time it is implemented. The major
disadvantage of this method is that many commercial operations teams set the inventory threshold to a given value without considering how different vaccines require different inventory thresholds. Additionally, the values set in the MRP system are rarely reviewed. As a result, the values are often out-of-date and are no longer representative of best practice.
3. Based on demand only: Although uncommon, some commercial operations teams utilize
only their sales forecast to develop a resupply plan for each product. Instead of looking at current inventory, they utilize historical knowledge to determine when a resupply is required. They then enter this resupply plan into the rolling forecast.
This method has all the flaws that the "demand and current inventory" method has but has additional problems. Since there is no review of current inventory, inventory levels can be very high and a lot of capital can be tied up in inventory. Additionally, with no review of inventory, space can be an issue. These issues demonstrate that there are significant savings if the right inventory and resupply planning policies are established.
Each commercial operations team conducts resupply planning in a different way. There is limited sharing of best practices between the country commercial operations teams. A standard practice for developing resupply plans will benefit both commercial operations and technical operations. It will improve their ability to meet customer demand reliability at the lowest cost.
2.4. Chapter Summary
There are several methods that can be used to do resupply planning. A common method for resupply planning is based on determining the resupply point and resupply quantity. Although this method works well for many industries, it does not meet all the needs of the vaccines
industry. Vaccines products have shelf lives and are sold in highly regulated environments. They save lives and as a result need to have very high service levels. The demand for vaccines is
impacted by local regulations as well as seasonal fluctuations. Resupply planning must consider the type of vaccine: seasonal influenza vaccines, emergency vaccines, or all other types of vaccines. Since each of these types of vaccines requires different policies, the analysis presented in this paper is focused on the "other" category.
Novartis Vaccines has a robust Sales and Operations Planning process which repeats monthly. It has four stages: demand phase, supply phase, global S&OP phase, and executive S&OP phase. The focus of this analysis is on the demand phase. During the demand phase, each country develops a resupply plan for each SKU it orders looking at an 18-month horizon. This resupply plan is entered into the rolling forecast which technical operations use to plan manufacturing. Each country's commercial operations team uses a different method to do resupply planning and each method used has flaws. By improving resupply planning methods, customer demand will be met more reliability at a lower cost.
3. Model
3.1. Introduction
Country commercial operations teams need a model to help them improve their resupply planning. The model must consider the major supply chain factors for the vaccines industry and then recommend a resupply plan which can be entered into the rolling forecast.
The model is based on a modified resupply point and resupply quantity methodology, initially discussed in Section 2.1. Figure 6 depicts the generalized theory. In Figure 6 the safety stock is
100 doses, the resupply point is 140 units and the resupply quantity is 100 doses. Forecasted
in-country released inventory depletes every month when forecasted sales are made. When the forecasted in-country released inventory reaches the resupply point, a resupply is forecasted. Using Figure 6 as an example, the resupply plan should include 100 doses in months 2 and 7 (see Figure 7). This would be communicated to the technical operations team through the rolling forecast. The technical operations team would then develop a manufacturing and supply plan that would lead to 100 doses arriving at the country warehouse at the beginning of months 2 and 7. When the doses arrive, they are unreleased inventory. The warehouse performs steps such as quality inspections to release the inventory and make it available for sale. In the example shown in Figure 6, this in-country release process takes 2 months.
In-country releaseda I (-utr rv IeadU and un-releaised In -ountry
forecasted inventory forer aste~d inventory .- releaise time
Resupply quantity of 100 units 300 forecasted 250 - -200 - -0 4.. 150
Resupply Point - When oo
forecasted inventory is Resupply quantity of 100 units
projected to reach this / I is released in-country level, a resupply order
should be forecasted
0
0 2 4 6 8 10 12
Month
Safety Stock - planned inventory never drops below the safety stock. The purpose of safety stock is to satisfy variability in demand
Figure 6. A basic example showing forecasted inventory
Resuplply Plan
Month
I1 I2 I3 I4 I5 I
6
I7 I8 I9 I10
11i
Resupply 0 100 0 0 0 0 100 0 0 0 0
Figure 7. Resupply plan for example in Figure 6
Although Figure 6 depicts safety stock, resupply point, and resupply quantity as constant values this is a simplification and does not always apply. Due to the challenges in the vaccines industry described in Section 2.2, these values can change. As a result, the safety stock, resupply point, and resupply quantity must be calculated at some defined time interval. For Figure 6 above, the inventory is being monitored monthly (the review interview is monthly) and thus a monthly time interval is sufficient. The analysis from here on assumes that the appropriate time interval is monthly however this model can be adapted for any time interval
3.2. Model Calculations
3.2.1. Safety Stock
Safety stock is kept to manage uncertainty in demand. As demand uncertainty changes with time, the safety stock must also change. To forecast future safety stock requirements, we must
develop a method to understand the changes in demand uncertainty with time. To accomplish this, we define the following:
e Seasonality Factor (SEm): The Seasonality Factor is used to express predictable changes in sales that happen every year. m is the month of the year and ranges from 1 to 12 where 1 is January and 12 is December. For example, a vaccine's sales may increase by a factor of 2 every August and September. Thus, the SE8= SE9= 2. In this example, all other seasonality
factors equal 1.
* Market Dynamics Factor (MS;): The Market Dynamics Factor is used to express expected changes (growth or reduction) in market demand. j is the number of months from present.
For example, if it is January 2011 now and it is expected that sales will double in February 2011 and remain doubled, MSo=1 and MS1.=2.
Using these definitions, we calculate the standardized past sales for month j (PSS;). List of Variables
PS; = the past sales for month
j
SEm = the seasonality factor for month m
MSj = the market dynamics factor for month
j
Calculate standardized past sales (PSSj)
PS-PSSj = s
P
SEm x MS;Equation 4. Standardized past sales equation
Using the standardized past sales, we can calculate the standard deviation of standardized past sales (opss). We assume that opss for a given month is associated to changes in sales that result from SEm and MS and calculate the past sales standard deviation standardized to the month
j
(PSC). In this equation, we estimate the standard deviation of SEm and MSj to be the square rootof SEm and MSj respectively based on the assumption of independent time increments. List of Variables
opss = standard deviation of standardized past sales
MSj = the market dynamics factor for month
j
SEm = the seasonality factor for month m
Calculate past sales standard deviation standardized to month j (PSC;)
PSCj
=
Uess
xMSx
f5-Equation 5. Past sales standard deviation standardized to month j equation
In order to complete the calculation for safety stock, we must also calculate the safety stock lead time (SSLT), the lead time factor (LTF), and the service factor (SF).
List of Variables
RT = in-country release time
RP = review period. This is the frequency that the resupply plan and rolling forecast is updated. TF = the time fence. This is the time the organization can react to a change in the rolling forecast. For vaccines products, this is often the time it takes to make a generic product (ie
meningitis vaccines) be a specific SKU (meningitis vaccine for the United States).
SL = inventory service level. This is discussed further in Section 2.2.3 CNDF[X] = the cumulative normal distribution function of X
Calculate safety stock lead time (SSLT)
SSLT = RT + RP + TF
Equation 6. Safety stock lead time equation
Calculate lead time factor (LTF)
LTF = SSLT
Equation 7. Lead time factor equation
LTF in Equation 7 estimates the standard deviation of the SSLT to be the square root of SSLT. Calculate service factor (SF)
SF = CNDF[SL]
Equation 8. Service factor equation
Using the calculations above, we calculate the safety stock (SS;).
List of Variables
PSCj = past sales standard deviation standardized to the month j
LTF = lead time factor
SF = service factor
ESS = emergency safety stock. This value is set by the organization. Calculate safety stock (SSj)
SS = PSC xLTF xSF+ ESS
Equation 9. Safety stock equation
Using Equation 9 we can forecast the future required safety stock. This will be used to forecast the resupply point.
3.2.2. Resupply Point
The resupply point (RSPj) triggers a forecasted resupply. To calculate the resupply point, we must first calculate the resupply lead time (RLT) and the lead time demand (LTD;).
List of Variables
RT = in-country release time
RP = review period
FSj = forecasted sales for month j
SSj = safety stock for month
j
Calculate resupply point lead time (RLT)
RLT = RT + RP
Equation 10. Resupply point lead time equation
Calculate lead time demand (LTD;)
RLT+j
LTDj= FS;
I
Equation 11. Lead time demand equation
Calculate resupply point for month
j
(RSPj)RSP = SS; + LTD
Equation 12. Resupply point equation
Equation 12 calculates the resupply point assuming there is only variability in demand. This is a simplification of reality. Often, there is also variability in supply and this must be included when determining the safety stock and resupply point. If there is no data available on the variability of supply, we can increase the resupply point by a buffer equal to some number of months of demand. This will be the method used to calculate the resupply point with an additional supply buffer (RSPBj).
List of Variables
SB = months of supply buffer RSPj = resupply point for month j
Calculate resupply point with a supply buffer (RSPBS) SB+j
RSPB = RSP + FS;
I
Equation 13. Resupply point with a supply buffer equation
3.2.3. Resupply Quantity
The next critical step is determining what resupply quantity should be forecasted when the resupply point is reached. The resupply quantity is based on one of four calculation methods:
1. Total costs (QTc) - this method minimizes the ordering costs and inventory holding costs to
result in lowest total costs.
2. Shelf life (Qshelflife)- this method considers the forecasted sales (FSj) and the sellable shelf life
of the product to decrease the likelihood of scrapping product.
3. Minimum packaging quantity (QmpQ) - this method considers the limitations of
manufacturing and is the least number of a given SKU that can be supplied. 4. Resupply frequency (Qreq) - this method considers a desired order frequency.
It is important to note that methods two and three above assume each resupply has the same sellable shelf life. For example, a resupply forecasted in March 2011 will have 12 months of shelf life and a resupply forecasted in May 2011 will also have 12 months of sellable shelf life. Since these products will have different expiration dates, it implies that these two supplies are from different batches.
Method four above was developed to manage situations where recommended orders were more frequent than the organization desired. Qi.q is greater than QTc and decreases the resupply frequency. It is used when the corporation decides that resupply must occur at a frequency less than some maximum. QTc fails to meet this criteria when the organization has
underestimated the order and inventory costs. When ordering and inventory costs have been accurately accounted for Qfreq is not necessary.
Figure 8 shows the logic used to determine which method for calculating the resupply quantity is appropriate. This logic is used for each month which the resupply point is reached. For each month j, the logic is evaluated at i:
i =
i
+ RLT where RLT is the in-country release lead timeEquation 14. Resupply quantity evaluation month i
Equation 14 allows us to forecast a resupply in month j for release in month i that is the appropriate quantity for month i.
Figure 8. Logic for determining resupply quantity
The first step in the logic is to determine if Qrc is less than Qsheflife. This step determines if
product shelf life is a limiting factor that should impact the resupply quantity. The second step is to determine if QTc is greater than QmpQ. This step determines if the minimum packaging quantity may be a limiting factor. Step 3a evaluates if QTc is greater than forecasted sales in month i (FS,). If it is greater than one month of sales, a resupply quantity of QTc is
recommended. If Qrc is less than one month of forecasted sales, then Qreq is the resupply
quantity. This logic assumes a maximum resupply frequency of monthly; however, slight modifications to the logic can make it apply to any maximum resupply frequency.
Step 3b determines if Qsheiflife is greater than QmpQ. This step determines if Qhente is an
acceptable order quantity from the manufacturing organization. When Qshefiife is less than QmpQ,
the resupply quantity is QmPQ. When this occurs, we expect that some product will expire prior to being sold and thus will be scrapped.
3.2.3.1. Total Cost Resupply Quantity
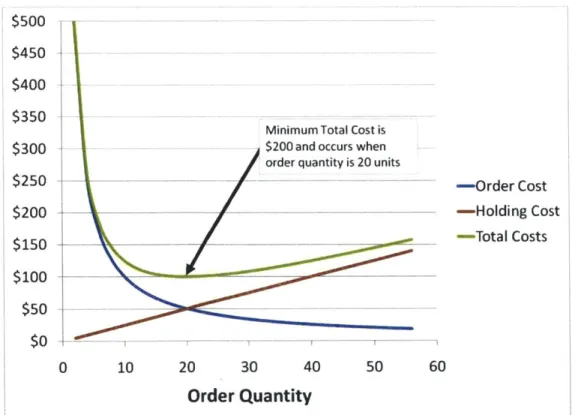
The standard method for calculating a resupply quantity is based on total costs. This method minimizes the total inventory holding and ordering costs. Ordering costs are fixed costs that are generally independent of the order quantity. Inventory holding costs are variable costs and they are correlated with the order quantity. Figure 9 shows an example of how holding and inventory costs impact the total cost and Equation 15 shows how these costs were calculated.
$500 $450 $400 $350 $300 $250 $200 $150 $100 $50 $0
Minimum Total Cost is $200 and occurs when order quantity is 20 units
-Order Cost -Holding Cost -Total Costs
0 10 20 30 40 50
Order Quantity
Figure 9. Recommended order quantity based on total costs
List of Variables
D = monthly demand of product (in Figure 9, D=100 units)
F = fixed cost per order (in Figure 9, F=$10)
C = cost per unit (in Figure 9, C=$100)
H =cost of capital (in Figure 9, H=5%)
Q = order quantity (in Figure 9, Q is on the X-axis and ranges from 0 to 55 units)
Calculate total costs (TC)
TC = OrderCost + HoldingCost
FxD HxCxQ
TC= +
Q
2
Equation 15. Total costs equation
If we minimize the total costs, we calculate the economic order quantity (EOQ) as shown in
Equation 16 (5).
2 x Monthly Demand x Fixed Order Cost
EOQ = F Monthly Holding Cost Per Unit
Equation 16. Economic order quantity equation
For vaccines products, order costs are significantly impacted by the cost of specialized shipping containers. In general, one of two sized shipping containers is used. Each shipping container has a fixed cost associated with renting and using the container for a set period of time. Additionally, the cost of shipping the container is independent of how full the
container is. As a result, there are two separate order costs depending on which shipping container is used. Additionally, each shipping container has a specified volume such that there is a maximum amount of product that fits in each type of container. This complication means additional analysis is required to determine the best resupply quantity.
We will assume that the two shipping container sizes are Si and S2 with order costs of K, and
K2 respectively. We will assume that Si< S2<2 X Si and that K1 < K2<2 X K1. As a result, there
are three scenarios which must be considered:
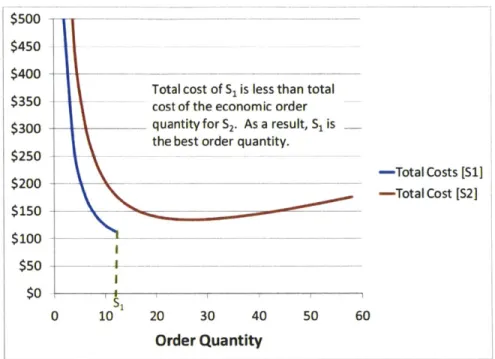
Scenario A. Si < EOQ - Shipping container 1's capacity (Si) is less than the economic order quantity for shipping container 1 (EQ1). This scenario can occur in 4 different ways.
This is depicted in Figure 10 thru Figure 13 .The recommended order quantity for this scenario can be S1, S2, or EOQ2 depending on the exact details.
$500
$450 $400
Total cost of Si is less than total $350 -cost of the economic order $300 quantity for S2. As a result, Sis
-the best order quantity. $250
-Total Costs [Si]
$200--Total Cost [S2] $150 $100 $50 4 -$0 S, 0 10 20 30 40 50 60
Order Quantity
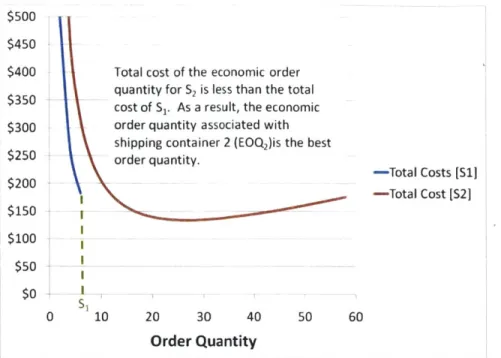
Figure 10. Scenario A where S, is the best order quantityTotal cost of the economic order quantity for S2 is less than the total cost of S1. As a result, the economic order quantity associated with shipping container 2 (EOQ2)is the best
order quantity. $500 $450 $400 $350 $300 $250 $200 $150 $100 $50 $0 0 10 20 30 40 50 60
Order Quantity
Figure 11. Scenario A where EOQ2 Is the best order quantity
Total cost of S2 is less than total cost of S1. As a result, S2 is the best order quantity.
-Total Costs [Si]
-Total Cost [S2]
-4---02
0 10 20 30 40 50 60
Order Quantity
Figure 12. Scenario A where S2 is the best order quantity36 1 P a g e -Total Costs [S11 -Total Cost [S21 $500 $450 $400 $350 $300 $250 $200 $150 $100 $50 $0
$500
$450
$400
$350 Total cost of Si is less than total
cost of S2. As a result, S, is the
$300 best order quantity.
$250 $200
~-Total
Costs [S1] -Tota Cost [S21 $150 $100 - -I I $50 0 10 20 30 40 50 60Order Quantity
Figure 13. Scenario A where S is the best order quantity
Scenario B. EOQ1 <S < EOQ2 - The economic order quantity for shipping container 1 (EOQ1) is less than shipping container 1's capacity (Si) and shipping container 1's (S1) capacity is less than the economic order quantity for shipping container 2 (EO2). This scenario is
depicted in Figure 14. The recommended order quantity for this scenario is EOQ1.
$500
$450 - Total cost of the economic order
$400 quantity for S, is less than the total
$350 -- cost of the economic order quantity S2
-As a result, the economic order
$300 quantity associated with shipping
container 1 (EOQ1)is the best order
$250 quantity.
-Total Costs [Si] -Total Cost [S2] $150 $100 $50II $0 EO0 1 Si EbQ2 0 10 20 30 40 50 60
Order Quantity
Figure 14. Scenario B where EOQ1is the best order quantity
Scenario C. Si < EOQ2 - Shipping container 1's capacity (Si) is less than the economic order quantity for shipping container 2 (EOQ 2). This scenario is depicted in Figure 15. The
recommended order quantity for this scenario is EOQ1.
Total cost of the economic order quantity for S, is less than the total cost of the economic order quantity S2-As a result, the economic order quantity associated with shipping container 1 (EOQi)is the best order
Iquantity. -- I I EOi Eb| S $500 $450 $400 $350 $300 $250 $200 $150 $100 $50 $0 -Tota Costs [S1] -Tota Cost [S2] 50 60
Figure 15. Scenario C where EOQ1 is the best order quantity
The analysis shown in Figure 10 thru Figure 15 is simplified into the decision diagram in Figure 16. This logic is used for each month which the resupply point is reached. For each month
j,
the logic is evaluated at i as discussed in Equation 14.38 1 P a g e
EOd EbQ2 S'
20 30 40
Order Quantity
List of Variables:
S,= Doses per smaller (or only) shipping container
S2= Doses per larger shipping container
K1 = Order costs for smaller (or only) shipping container
K2 = Order costs for larger shipping container
EOQ = Economic Order Quantity for smaller (or only) shipping
container
EOQ2 = Economic Order Quantity for larger shipping container
TCEOQ2
=
Total costs for EOQ2-TCS1 = Total costs for smaller (or only) shipping container
TCS2= Total costs for larger shipping container
Figure 16. Logic for determining QTc
3.2.3.2. Shelf life Resupply Quantity
Since vaccines products expire, it is important to consider a resupply quantity that reduces the likelihood of scrapping product. We must determine the sellable shelf life which is dependent on the shelf life of the product and the customer's shelf life requirements.
Equation 17 through Equation 19 calculate the sellable shelf life (SSL), the forecasted sales
over the sellable shelf life (A) and the resulting recommended resupply quantity based on
shelf life (Qshelffife).
List of Variables
DSL = average shelf life upon product arriving in-country SLC = remaining shelf life required by the customer
RT = in-country release time
FS, = forecasted sales for month i where i is calculated based on Equation 14.
PSC5 = past sales standard deviation standardized to month j (reference Equation 5)
ASS= average safety stock
Calculate sellable shelf life (SSL)
SSL = DSL - SLC - RT
Equation 17. Sellable shelf life equation
Calculate forecasted sales over the sellable shelf life (A)
SSL+i
A = FSn
Equation 18. Forecasted sales over the sellable shelf life equation
Calculate the resupply quantity based on shelf life (Qhelflfe)
Qshelf life = A - 2 x PSC; - ASS
Equation 19. Resupply quantity based on shelf life equation
Qsheffife is a conservative resupply quantity that reduces the likelihood of product expiring. It
takes the forecasted sales over the sellable shelf life (A) and decreases this quantity by two standard deviations of sales (PSC;). This reduces the resupply quantity enough such that if sales are two standard deviations lower than forecasted, the resupply quantity does not expire before it is sold. We also must subtract the average safety stock (ASS). If we did not
subtract the ASS, and if actual sales were two standard deviations below forecasted sales, we would have to scrap the safety stock. By creating a conservative estimate of Qshelflife, we
reduce the likelihood of scrapping product. This strategy does have one major
disadvantage. If sales are higher than forecasted, we will need to change the resupply plan to include another resupply order to prevent a stock-out.
3.2.3.3. Minimum Packaging Resupply Quantity
Many organizations require a minimum quantity be purchased at a given time. This is often referred to as the minimum order quantity. For vaccines products, this is often dependent on manufacturing process and is limited by the number of vaccines of a specific SKU that can be packaged efficiently at one time. As a result, the minimum packaging quantity (QMPQ) is determined by the organization and his highly dependent on the processes used within the organization.
3.2.3.4. Frequency Resupply Quantity
Although the three resupply quantities (QTc, Qshelflife, and QMPQ) are theoretically sufficient to
determine the ideal resupply quantities, practically, these may not be sufficient. Often, an organization does not want internal orders to occur faster than a specific frequency. As a
result, we use a resupply quantity based on frequency (Qfrequency).
Qfrequency is highly dependent on the organizations needs. For Novartis Vaccines, the
frequency was set to monthly - resupply should be provided at a maximum of once a month. Additionally, it was determined that the resupply quantity should optimize the use of the shipping containers whenever possible. We determined that full shipping containers should be used whenever the shipping container size is between one and three months of forecasted sales. As a result, the logic in Figure 17 is used to determine the appropriate
List of Variables
S1 = Doses per smaller (or only) shipping container
S2 = Doses per larger shipping container
sCC, = Shipping cost per smaller (or only) shipping container sCC2 = Shipping cost per larger shipping container
Fsj = forecasted sales for month i
Assumptions
This logic assumes you will always ship in either S, or S2 containers and never use a combination of both S, and S2. This assumption is made to prevent the creation of an optimization problem that would
disrupt performance of the model in excel.
Determines if a multiple of full container of size 1 is between 1 month and 3 months of demand
Determines least number of full shipping containers of size S, to satisfy 1 month of the forecasted sales in month i
Shipping in full containers results in shipping more than 3 months of forecasted sales. As a result, one
month of forecasted sales is the resupply quantity.
Determines if a multiple of full Determines least number of full
Mathematical symbol container of size 2 is between 1
shipping containers of size S2 to
means round up to month and 3 months of demand
satisfy 1 month of the forecast nearest integer
Figure 17. Logic for determining Qf,
3.2.3.5. Rounding Resupply Quantity
The calculations for the resupply quantity discussed in sections 3.2.3.1 through 3.2.3.4 have no rounding rules. Since vaccines come in boxes, it is often ideal to ship a full box rather than a partially filled box. Additionally, there may be benefits to shipping a full container or a full batch. As a result, users of the model enter percentages for when they would like their order rounded up or down to the nearest box, shipping container, and manufacturing batch. For example, say a box contains 100 doses and the resupply quantity determined based on the calculations in sections 3.2.3.1 through 3.2.3.4 indicates an order size of 1,122 doses. If the user enters into the model that the order sizes should be rounded down to the