HAL Id: hal-00295380
https://hal.archives-ouvertes.fr/hal-00295380
Submitted on 20 Jan 2004
HAL is a multi-disciplinary open access
archive for the deposit and dissemination of
sci-entific research documents, whether they are
pub-lished or not. The documents may come from
teaching and research institutions in France or
abroad, or from public or private research centers.
L’archive ouverte pluridisciplinaire HAL, est
destinée au dépôt et à la diffusion de documents
scientifiques de niveau recherche, publiés ou non,
émanant des établissements d’enseignement et de
recherche français ou étrangers, des laboratoires
publics ou privés.
R. von Kuhlmann, M. G. Lawrence, U. Pöschl, P. J. Crutzen
To cite this version:
R. von Kuhlmann, M. G. Lawrence, U. Pöschl, P. J. Crutzen. Sensitivities in global scale modeling
of isoprene. Atmospheric Chemistry and Physics, European Geosciences Union, 2004, 4 (1), pp.1-17.
�hal-00295380�
SRef-ID: 1680-7324/acp/2004-4-1
Chemistry
and Physics
Sensitivities in global scale modeling of isoprene
R. von Kuhlmann1, M. G. Lawrence1, U. P¨oschl2, and P. J. Crutzen1, 3 1Max-Planck-Institut f¨ur Chemie, Postfach 3060, 55020 Mainz, Germany 2Institut f¨ur Wasserchemie, Technische Universit¨at M¨unchen, M¨unchen, Germany 3Scripps Institution of Oceanography, UC San Diego, La Jolla, CA, USA
Received: 22 April 2003 – Published in Atmos. Chem. Phys. Discuss.: 18 June 2003 Revised: 27 November 2003 – Accepted: 23 December 2003 – Published: 20 January 2004
Abstract. A sensitivity study of the treatment of isoprene
and related parameters in 3D atmospheric models was con-ducted using the global model of tropospheric chemistry MATCH-MPIC. A total of twelve sensitivity scenarios which can be grouped into four thematic categories were per-formed. These four categories consist of simulations with different chemical mechanisms, different assumptions con-cerning the deposition characteristics of intermediate prod-ucts, assumptions concerning the nitrates from the oxida-tion of isoprene and variaoxida-tions of the source strengths. The largest differences in ozone compared to the reference sim-ulation occured when a different isoprene oxidation scheme was used (up to 30–60% or about 10 nmol/mol). The largest differences in the abundance of peroxyacetylnitrate (PAN) were found when the isoprene emission strength was reduced by 50% and in tests with increased or decreased efficiency of the deposition of intermediates. The deposition assumptions were also found to have a significant effect on the upper tro-pospheric HOx production. Different implicit assumptions
about the loss of intermediate products were identified as a major reason for the deviations among the tested isoprene oxidation schemes. The total tropospheric burden of O3
cal-culated in the sensitivity runs is increased compared to the background methane chemistry by 26±9 Tg(O3) from 273
to an average from the sensitivity runs of 299 Tg(O3). Thus,
there is a spread of ±35% of the overall effect of isoprene in the model among the tested scenarios. This range of uncer-tainty and the much larger local deviations found in the test runs suggest that the treatment of isoprene in global mod-els can only be seen as a first order estimate at present, and points towards specific processes in need of focused future work.
Correspondence to: R. von Kuhlmann
(kuhlmann@mpch-mainz.mpg.de)
1 Introduction
The chemistry of non-methane volatile organic compounds (NMVOC) is known to significantly affect the formation of ozone in large parts of the atmosphere and can strongly influ-ence the abundance of hydroxyl radical (OH) concentrations (Houweling et al., 1998; Wang et al., 1998; Poisson et al., 2000). However, little work has been made to assess the un-certainties associated with current model predictions of these effects.
Isoprene is among the most important NMVOC species in the atmosphere with estimated emissions of about 500 Tg(C)/yr amounting almost one half of the global total bio-genic emission strength of 1150 Tg(C)/yr (Guenther et al., 1995). Even in some industrialized regions its emissions can be comparable to anthropogenic hydrocarbon emissions (Lamb et al., 1993). An increasing importance of iso-prene in the future has been hypothesised by Shallcross and Monks (2000) due to increasing net primary productivity in a warmer climate. Recently, Sanderson et al. (2003) have calculated increasing emissions from 549 Tg(C)/yr (1990s) to 697 Tg(C)/yr in the 2090s including natural vegetation changes. Changes in land use due to anthropogenic activity can be another influential factor.
On the other hand Rosenstiel et al. (2003) recently found that isoprene emissions from an agriforest plantation de-creased under inde-creased CO2exposure.
The oxidation of NMVOCs in the atmosphere can involve hundreds of species and thousands of reactions (Madronich and Calvert, 1989; Poisson, 1997; Saunders et al., 1997). In addition to the incomplete knowledge about some de-tails of these degradation sequences an uncertainty is there-fore introduced through their representation by simplified reaction schemes suitable for three-dimensional chemistry-meteorology applications.
Traditionally, these uncertainties are assessed in box-model studies by comparing a complex reaction scheme with
Table 1. Isoprene related species in the MIM.
No. Name Description 1 C5H8 isoprene
2 ISO2 peroxy radicals from C5H8+ OH
3 ISOOH β-hydroxyhydroperoxides from ISO2+ HO2
4 ISON β-hydroxyalkylnitrates from ISO2+ NO and
alylnitrates from C5H8+ NO3
5 MACR methacrolein, methylvinylketone and other C4
carbonyls
6 MACRO2 peroxy radicals from MACR + OH
7 MACROOH hydroperoxides from MACRO2+ HO2 8 MPAN peroxymethacryloylnitrate and other higher
peroxyacylnitrates
9 HACET hydroxyacetone and other C3ketones
10 MGLY methylglyoxal and other C3aldehydes
11 CH3O3 peroxyacetyl radical
12 PAN peroxyacetylnitrate 13 CH3O3H peroxyacetic acid 14 CH2OOH acetic acid
15 NALD nitrooxyacetaldehyde 16 HCOOH formic acid
a simplified mechanism under different typical atmospheric conditions (e.g. P¨oschl et al., 2000; Liang and Jacobson, 2000; Geiger et al., 2003). Comparison to smog chamber results are also performed, but currently they do not cover low-NOx conditions encountered in remote clean
environ-ments. However, box-model studies cannot fully account for the complex non-linear interaction between chemical and physical processes such as mixing, transport or deposition occurring in the atmosphere. Thus, an overarching view of the uncertainties connected to the chemical and physi-cal properties of the NMVOC species is only possible with a 3D chemistry-transport model (CTM). On the other hand, the number of uncertain parameters becomes even larger in the 3D framework which make a subjective selection of test cases necessary.
In a box model study P¨oschl et al. (2000) compared one detailed and five condensed isoprene oxidation mechanisms with each other under various scenarios relevant to the atmo-sphere. The Mainz Isoprene Mechanism (MIM) developed in that study was designed to be in relatively close agreement to a detailed mechanism, the Master Chemical Mechanism (MCM, Jenkin et al., 1997; Saunders et al., 1997). However, large deviations were found between the other mechanisms, both relative to each other and to the MCM.
In this study we perform a sensitivity analysis of factors connected to modeling the effects of isoprene emissions us-ing a 3D CTM. This can be seen as an expansion upon the work of P¨oschl et al. (2000) in two ways. Firstly, selected condensed isoprene mechanisms also compared in that study have been implemented in the 3D model allowing to
investi-gate whether the effects found in the box model study are also relevant in the 3D context. Secondly, the global 3D model also allows the influence of non-chemical loss processes on the calculated results to be examined.
It is, however, not possible in the 3D model to directly as-sess the uncertainties in the explicit formulation of isoprene oxidation and thus our selection of three condensed isoprene oxidation schemes can be seen as a pragmatic way to get indications on the overall spread in global 3D simulations of isoprene chemistry. Also, sensitivity to the meteorolog-ical representations in the model will not be investigated in this study. Especially vertical mixing processes (boundary layer turbulence and convection) could significantly affect the long-range effects of isoprene and would be a valuable research task which, however, goes beyond the scope of this study.
In the next section a short overview of the 3D global model MATCH-MPIC used for this study is given and the setup of the sensitivity simulations is outlined. In Sect. 4 the se-lected sensitivity scenarios are described and motivated. The scenarios fall in four groups covering assumption about the chemical scheme, emission strengths, the fate of isoprene ni-trates and deposition of intermediates. In Sects. 5 to 8 the results from each of these groups is presented and discussed. A summary of the discussions and results is then given in Sect. 9.
2 Model setup
We use the global tropospheric chemistry model MATCH-MPIC (Model of Atmospheric Transport and Chemistry – Max-Planck-Institute for Chemistry version) in this sensi-tivity study. The model has been under development over several years (Rasch et al., 1997; Mahowald et al., 1997b,a; Lawrence et al., 1999). The most recent version which in-cludes the chemistry of non-methane hydrocarbons using a flexible set-up is presented in von Kuhlmann et al. (2003a) and it is also used to make chemical forcasts to aid in cam-paign flight planning (Lawrence et al., 2003).
The model is driven by 6-hourly basic meteorological pa-rameters (u,v-wind, latent and sensible heat flux, specific hu-midity, surface pressure, surface stress components) from NCEP (Kalnay et al., 1996). The sensitivity simulations are done at a resolution of about 5.6◦×5.6◦(T21 Gaussian grid) based on additional parameter fields which have been archived from a higher resolution (T63 or 1.9◦×1.9◦) run (“archived mode”) (see Rasch et al., 1997).
The model applies industrial emissions from the EDGAR database Version 2.0 (Olivier et al., 1996), biomass burning from Galanter et al. (2000), soil-NOxemission from Yienger
and Levy (1995). Lightning-NOxis parameterized based on
Price and Rind (1994) with a global emission strength of 5 Tg-N/yr. Biogenic isoprene emissions are based on monthly mean values from Guenther et al. (1995), but have been
Table 2. Comparison of observed isoprene mixing ratios (in nmol/mol) with model calculations for the high resolution run (T63) and at
the reduced resolution (T21). 24-hour means are marked with “24h”, otherwise daytime values are reported. Model values are monthly (24 hour) averages. In brackets maximum and minimum of single measurements.
Location Time Lat. Lon. Observations T63 T21 Reference
Canada, Egbert July 44 -79 0.5 0.3 0.4 Bottenheim and Shepherd (1995) , Kejimkujik July 45 -65 2.0 0.2 0.3 Bottenheim and Shepherd (1995) , Fraserdale Jul.-Aug. 50 -82 0.5-5 0.5 0.4 Jobson et al. (1994)
Niwot Ridge Aug.-Sept. 40 -105 0.6 (0.2-1.8) 0.2 0.1 Greenberg and Zimmerman (1984) Nov. 40 -105 0.1(0.03-0.2) 0.04 0.04 Greenberg and Zimmerman (1984) Georgian Rep. Summer 42 43 1.4 (max. 6) 0.2 0.2 Shaw et al. (1983)
Japan July, 24h 38 140 0.3 0.2 0.1 Yokouchi (1994) Nov, 24h 38 140 0.2 0.02 0.01 Yokouchi (1994) Alabama Jun.-Jul., 24h 32 -88 3.8 (1-7) 2.9 2.4 Montzka et al. (1993) Amazonia Jul. 2 -60 2.2 (1.2-3.2) 6.7 11.0 Rasmussen and Khalil (1988) Amazonia year-round 2 -60 2.4 (1.0-5.2) 6.1 9.0 Greenberg and Zimmerman (1984) Amazonia Jul.-Aug. -2 -60 2 (1.1-2.7) 6.4 14.5 Zimmerman et al. (1988)
Peru July -5 -77 3.3 10.3 15.6 Helmig et al. (1998) Venezuela, Buja Sept. 9 -62 3.3 3.8 3.0 Donoso et al. (1996) , Auyantepuy Apr., 24h 6 -62 1.6 1.9 3.1 Donoso et al. (1996) , Calabozo Sep.-Oct.,24h 9 -67 0.8 (0.2-3.1) 5.9 7.8 Holzinger et al. (2002) , Calabozo Mar.-Apr.,24h 9 -67 0.5 (0.1-1) 0.5 0.5 Holzinger et al. (2002) , Parupa Jan.-Feb. 6 -62 0.5 (0.1-1.2) 1.2 2.3 Holzinger et al. (2002) Surinam (PBL) Mar. 2-7 -54-58 3.5 (0.5-7) 2.8 2.5 Warneke et al. (2001)
reduced to a global emission strength of 350 Tg-C/yr. A di-urnal cycle is imposed by scaling to the cosine of the solar zenith angle with zero emissions during night. Dry deposi-tion is based on a resistance model (Ganzeveld and Lelieveld, 1995) using parameterizations of surface resistances from Wesely (1989) based on the Henry’s Law constants of each species. Wet deposition is also parameterized based on the solubilities and assuming equilibrium between gas and aque-ous phase (see Crutzen and Lawrence, 2000).
A short discussion stressing the most relevant points of the evaluation of the model using the full NMVOC scheme is given in the next section.
In all simulations only the “background” CH4-CO-NOx
-HOx chemistry system and isoprene chemistry is included.
A list of isoprene related species in our standard isoprene oxidation mechanism MIM (P¨oschl et al., 2000) is given in Table 1. Other non-methane hydrocarbons have been omitted in these runs in order to focus the tests explicitly on isoprene. It has been shown by Wang et al. (1998) that isoprene alone is responsible for a large fraction of the overall effects of all NMVOCs, especially in the tropics on which we focus here. Thus, the sensitivity runs are usefull to identify the most un-certain points in treating isoprene in global models. How-ever, it must be realized that anthropogenic VOC neglected would affect the sensitivities in the polluted northern extra-tropics. Moreover the highly uncertain emissions of other biogenic NMVOC emission (e.g. terpenes, sesquiterpenes) neglected in this study could affect the calculated sensitiv-ities. For reference the changes found in the different test cases will also be compared with the overall effect of adding isoprene chemistry to the background chemistry.
All simulations start on 2 March 1998, from a well spun-up model state. Only the monthly mean results for May are analyzed here. Thus, an additional spin-up period of 2 months is allowed for each simulation. The month May has been chosen because it is characterized by frequent rainfall over large parts of the tropical continents south of the ITCZ (wet season). During this season very little burning activity is occurring and thus the NOxconcentrations are relatively
low (Jacob and Wofsy, 1990). Under these conditions iso-prene chemistry is expected to be most uncertain, since the mechanisms are only tested with smog chamber data with NOx concentrations in the hundred nmol/mol to mmol/mol
range (e.g. Zaveri and Peters, 1999).
The discussion will focus on the effects in the tropics and especially over the Amazon rain forest, although global bud-get information is also presented from each run to show the global mean effect. It is noted, however, that the effects of isoprene and its uncertainties are probably not very large in May in the northern extra-tropics, since isoprene emissions maximize 2–3 months later.
3 Model performance
The model results of the full version (including other NMVOCs) have been extensively evaluated with ozone ob-servations in von Kuhlmann et al. (2003a), and the com-parison with a large suite of observations of ozone precur-sors (CO, NOx, NMVOCs, oxygenates etc.) is resented in
von Kuhlmann et al. (2003b). Since not all comparisons (which are also posted at http://www.mpch-mainz.mpg.de/
Table 3. Short descriptions and acronyms of the sensitivity simulations discussed in this section.
Case name Description
CH4 Only backgound CH4-CO-NOx-HOxchemistry.
BASE Base run with background and isoprene chemistry (no other NMVOCs). MOZART Isoprene chemistry from the MOZART model (Brasseur et al., 1998).
CBM Isoprene chemistry of the modified CBM-IV mechanism by Houweling et al. (1998).
LOWISOP Isoprene emissions reduced by 50% in the tropics (20◦S–20◦N). LOWSOIL Soil-NOxemissions reduced by 50% over forested areas in the tropics
(20◦S–20◦N).
LOWLTNG Production of NO from lightning reduced by 60% over the continental tropicial South America.
HIGHISON Doubled yield of isoprene nitrates from the ISO2+NO reaction.
INHNO3 Production of isoprene nitrates is channeled into HNO3.
NONACA Reaction products of the oxidation of the isoprene nitrates with OH are assumed to be lost from the atmosphere (thus product NACA is omitted). LOWDEP Deposition properties (dry+wet) of hydroxy-hydroperoxides from
isoprene assumed to be the same as for CH3OOH.
VLOWDEP Deposition of all intermediates of isoprene oxidation switched off. HIGHDEP Assumed loss of 70% of hydroxy-hydroperoxides from isoprene
(as in Brasseur et al., 1998).
∼kuhlmann/matcheval) could be discussed in those studies,
we provide some additional discussions in this section, fo-cusing on species (isoprene, NOy-species) and regions
(trop-ics, rainforest) that would have the strongest influence on our sensitivity simulations with different chemical schemes and can serve as motivation for the sensitivity runs with differ-ent emissions described in the next section. These can also help to judge if the changes introduced in those runs would improve or deteriorate the comparison.
For reference the surface distribution of isoprene from the BASE simulation in May is shown in Fig. 1 together with the calculated distribution of NOxin the boundary layer.
Com-parison of measurements of isoprene at single locations must be seen with caution due to the coarse model grid and small scale horizontal variations in its concentration. Nevertheless, the ensemble of model/measurement comparisons can give indications about general tendencies of the model to over or under-predict concentrations in certain ecosystems. A com-pilation of available surface measurements along with model predictions is listed in Table 2.
The model appears to be in agreement with measurements made in North America. Measurements in Japan are ex-pected to be underestimated, since also low emission over oceans from the original 1◦×1◦emission data are averaged into the coarse model grid-cell, resulting in lower average fluxes at this location.
The model significantly overestimates mixing ratios found in the central Amazon region, sometimes by a factor of 3. The sites are probably quite representative of the region, since no major inhomogeneities in the vegetation are ex-pected. This may not be the case for the Peru site which
is located in a region where a strong horizontal gradient in isoprene is calculated within a few grid cells of the model. The value of the nearest grid cell to the east representative of the rainforest ecosystem is used for this station; using an interpolation to the exact measurement location would also overestimate the observations.
This overestimate is consistent with findings in other 3D global model studies (Houweling et al., 1998; Granier et al., 2000). Besides too high emissions of the rainforest ecosys-tem as also suggested by Rinne et al. (2002) other factors such as too weak vertical mixing or unknown deposition pro-cesses (Holzinger et al., 2002) could contribute to the overes-timate. In fact, over Surinam the model predicts a too strong decrease of isoprene with altitude compared to the measure-ments by Warneke et al. (2001) which indicate efficient mix-ing by shallow convection up to 4 km.
Measurements of NOy species over the tropical
rainfor-est are very scarce. The model somewhat overrainfor-estimates the tower measurements from the ABLE-2A campaign over the central Amazon in May (Bakwin et al., 1990) (mean 450 pmol/mol observed, 700 pmol/mol calculated), but the model is within the central 67% of the data. The model also appears to be on the high side of aircraft measurements of NO from the same campaign (Torres and Buchan, 1988), but here the diurnal cycle of NO complicates the comparison. A model daytime average value is calculated from the 24h-mean out-put data assuming zero NO during nighttime. When exclud-ing data from early mornexclud-ing measurements to get a more rep-resentative daytime value of NO (see M¨uller and Brasseur, 1995) the model is consistent with observations.
R. von Kuhlmann et al.: Sensitivities in global isoprene modeling 5
Fig. 1. Distribution of surface isoprene and boundary layer NOx
(p/psurf< 0.8) in the BASE run.
www.atmos-chem-phys.org/acp/0000/0001/ Atmos. Chem. Phys., 0000, 0001–25, 2003
Fig. 1. Distribution of surface isoprene and boundary layer NOx
(p/psurf <0.8) in the BASE run.
A tendency of the model to overestimate PAN mixing ra-tios in the remote upper troposphere was identified in von Kuhlmann et al. (2003b). This is also the case for the air-borne PAN measurements during ABLE-2A (Singh et al., 1990) which are about a factor of 2 lower than calculated in the model. The exact reason for this is unknown, but it was found that a change in the thermal equilibrium constants of PAN did not mitigate the problem. Another possible reason is checked in a sensitivity run which employs a reduced NOx
production from lightning in the Amazon region.
4 Description of the sensitivity runs
A total of 13 sensitivity simulations have been performed, in-cluding a BASE simulation and a simulation only inin-cluding the background chemistry (denoted CH4). An acronym for each run and a short description is given in Table 3. Most of the modified assumption in these runs can be considered to be within the range of uncertainties of our current knowledge or have been used in the recent literature. Not all tests are equally relevant and some simulations are therefore only dis-cussed briefly. The sensitivity simulations in Table 3 can be subdivided into four groups, which are discussed separately in the following four subsections.
4.1 Chemical schemes
The first group consists of three simulations (including the base run) with different condensed isoprene mechanisms. The Mainz Isoprene Mechanism (MIM) (P¨oschl et al., 2000) is compared to two other mechanisms used in global mod-eling studies (CBM, Houwmod-eling et al. (1998) and MOZART, Brasseur et al. (1998)). These two mechanisms have been implemented in MATCH-MPIC using the flexible integration technique as described in von Kuhlmann et al. (2003a). In order to focus on mechanistic differences in the isoprene ox-idation scheme, the rate parameters for the initial reactions of isoprene with OH, O3and NO3, and also for the PAN
chem-istry have been harmonized for all three mechanisms. The same photolysis rates are also used for reactions common to the three mechanisms. Other rates within each isoprene oxidation scheme are used as in the original publications, though it should be noted that the full implemention will be slightly different from the originals due to our harmonization of the PAN chemistry. The isoprene chemistry of the MIM used in the BASE simulation contains about 45 isoprene re-lated reactions and 16 species in addition to the background methane chemistry (see Table 1). Each stage of the degrada-tion is represented by a few species so that the reacdegrada-tion path-ways prevailing under low and high NOxconditions can be
adequately represented by the surrogate species. Hydroxy-hydroperoxides from isoprene (ISOOH and MACROOH), which are assumed to form in NOx-bereft environments are
explicitly treated in the scheme. These compounds have been tentatively identified over the rainforest in Surinam (Crutzen et al., 2000; Warneke et al., 2001) and over the savanna in Venezuela (Holzinger et al., 2002).
The mechanism (mainly based on M¨uller and Brasseur, 1995) used in the global chemistry-transport model MOZART (Brasseur et al., 1998) is similar in complex-ity to the MIM (about 19 species and 50 reactions). The main differences are the neglected treatment of hydroxy-hydroperoxides. Instead, 70% of these compounds are assumed to be lost through heterogeneous processes and the remainder is immediately oxidized to smaller prod-ucts. The main C4-products of the oxidation of isoprene,
methylvinylketone (MVK) and methacrolein (MACR) are treated separately, as opposed to the method of lumping them into a single compound in the MIM. The hypothetical reactions of MVK, MACR and methylglyoxal with sulfate aerosols assumed in Brasseur et al. (1996) are not included in the implementation in MATCH-MPIC.
Another difference is the relatively low reactivity assumed for the isoprene nitrates in the MOZART scheme, which may be used because isoprene nitrates are lumped together with other less reactive alkyl nitrates. The reaction rate with OH used in MOZART is 6.8·10−13molec/cm3/s compared to 1.3
·10−11in the MIM. The latter value has been estimated using the structure-reactivity relationship (SAR) method of Kwok and Atkinson (1995). However, it is noted that this method
not very reliable for organic nitrates (Neeb, 2000) and the re-activity of these nitrates must be seen as another uncertainty in the oxidation of isoprene.
A very simple oxidation scheme of isoprene (about 12 species or operators and 30 reactions) has been constructed by Houweling et al. (1998), based on the CBM-IV mech-anism of Gery et al. (1989). The lumping approach used in the CBM-IV to reduce the complexity of the degradation schemes of higher hydrocarbons is different than used in the MIM or the MOZART scheme. A structural lumping, which groups species according to their bond type is used, as op-posed to molecular lumping in MIM and MOZART, where groups of reactions of entire molecules are combined. The initial reaction of isoprene with OH in the CBM mechanism of Houweling et al. (1998) is:
C5H8+OH → 0.85 XO2 + 0.61 HCHO + 0.85 HO2
+0.03 MGLY + 0.58 OLE + 0.15 XO2N + 0.63 PAR. Here, XO2 and XO2N are peroxy-radical operators and OLE and PAR denote olefinic and paraffinic carbon bonds. It is noted that upon this first reaction about 50% of the carbon is lost and replaced by carbon-free operators.
It has to be kept in mind that “PAN” in this scheme denotes all PAN-type species which makes this quantity not strictly comparable to the PAN in the other schemes. However, other PANs from isoprene chemistry are more reactive than PAN and will thus hardly contribute to long-range transport of NOxto remote regions. From the contribution of MPAN to
total PAN one can estimate that this difference is negligible in remote regions and that other PAN species could contribute about 10% to 30% in the upper troposphere and near the sur-face, respectively.
4.2 Emission strengths
In this group of simulations some relevant emission strengths are varied. The decision for an increase or decrease of the emissions strengths has been based on the findings from the model evaluation in von Kuhlmann et al. (2003b) so as to give better agreement with observations.
Due to the finding in Sect. 3 of an overestimate of isoprene over the Amazon with the standard global isoprene emission strength of 350 Tg(C)/yr a test simulation (LOWISOP) with isoprene emissions reduced by 50% in the tropics was made, resulting in a global emission strength of about 215 Tg(C)/yr. The figure is comparable to the value of 220 Tg(C)/yr used by Brasseur et al. (1998).
Soil emissions and lightning are the most important NOx
emissions in tropical ecosystems in the wet season when biomass burning activity is low. A critical issue in deter-mining the actual flux of nitrogen into the atmosphere is re-capture of nitrogen containing compounds within the canopy (e.g. Ganzeveld et al., 2002).
In the soil emission data set of Yienger and Levy (1995) applied in MATCH-MPIC this is taken into account by sim-ple mechanistic assumptions. For tropical rain forest the canopy reduction factor, which expresses the fraction of ni-trogen that is actually exported from the canopy, is given in Yienger and Levy (1995) as 0.25. In the LOWSOIL test sim-ulation it was assumed that the soil emission over forested regions of the tropics is 50% smaller. This would corre-spond to a canopy reduction factor of about 0.13, or a 50% reduced primary soil emission strength with an unchanged reduction factor. The reduced emissions would bring NOy
surface concentrations in better agreement with observations. The change in the global source strength of NO, however, was found to be only about 5% (or 0.3 Tg(N)/yr), because tropical forest soils during the wet season are not very pro-ductive and most soil NO is released to the atmosphere over less forested regions (e.g. savanna).
The production by lightning is calculated to be an even larger source of NO to the Amazon region in MATCH-MPIC (vertically integrated). In a comparison to the GOME col-umn NO2 data of Richter and Burrows (2002) it is found
that this source is probably overestimated in MATCH-MPIC over this region during the wet season (see von Kuhlmann, 2001), in line with the overstimate of PAN over the region in Sect. 3. In another sensitivity run (LOWLTNG) therefore the NO production from lightning has been reduced by 60% over this region (continental South America, north of about 15◦S). This reduction applied globally would result in a to-tal source strength of 2 Tg(N)/yr in MATCH, which is near the low end of current estimates (e.g. Lawrence et al., 1995). Due to the regional restriction of the reduction the global source strength is only reduced by 0.6 Tg(N)/yr or 13% in May (from 4.8 to 4.2 Tg(N)/yr).
4.3 Isoprene nitrates
Since P¨oschl et al. (2000) pointed out that the different treat-ment of organic nitrates formed in the course of isoprene ox-idation were responsible for a large part of the differences seen in box model simulations with various isoprene oxida-tion schemes, some tests were also performed to explore their role in the 3D model. In the HIGHISON simulation a dou-bled yield of isoprene nitrates (denoted ISON in the MIM) is used. The value of 8.8% corresponds to the best estimate of Carter and Atkinson (1996), which is, however, in disagree-ment with the value of 4.4% obtained by Chen et al. (1998) and used in all other runs here. Recently, a higher yield of 8-12% supporting the previous results of Carter and Atkinson (1996) was inferred by Sprengnether et al. (2002).
Uncertainties also exists in the fate of these nitrates. In most reduced mechanisms, including the three tested here, two different groups of nitrates are represented by a sin-gle compound: The products of the reaction of isoprene with NO3and the group of β-hydroxy-nitrates from the
R. von Kuhlmann et al.: Sensitivities in global isoprene modeling 7
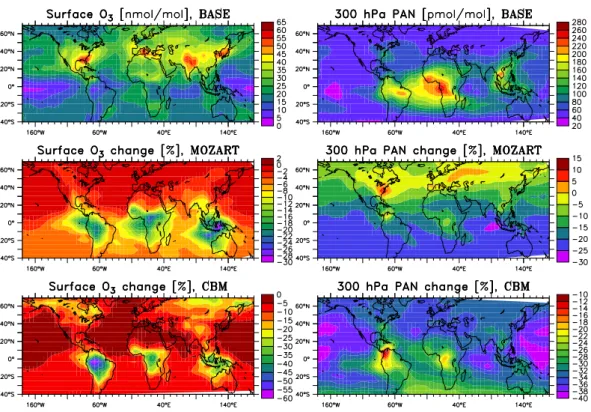
Fig. 2. Distribution of surface ozone and PAN at 300 hPa in the BASE run (upper two panels) and relative difference (in %) of the results from the MOZART (middle panels) and CBM (lower panels) from the BASE run (e.g. (XM OZART-XBASE)/XBASE·100%).
Atmos. Chem. Phys., 0000, 0001–25, 2003
www.atmos-chem-phys.org/acp/0000/0001/
Fig. 2. Distribution of surface ozone and PAN at 300 hPa in the BASE run (upper two panels) and relative difference (in %) of the results
from the MOZART (middle panels) and CBM (lower panels) from the BASE run (e.g. (XMOZART-XBASE)/XBASE·100%).
(ISON, Table 1). Since both groups still include a dou-ble bond they can react readily with OH, but the reaction products and their properties are not well known (Atkinson, 1994; Carter and Atkinson, 1996). Chen et al. (1998) argued that permanent removal of NOxwill generally occur. In the
MIM an intermediate product, denoted NACA (for nitrooxy-acetaldehyde) is formed which can also deposit. In the sen-sitivity run NONACA it was assumed that all products of the ISON+OH reaction are lost through deposition (dry or wet). Another assumption (Roelofs and Lelieveld, 2000) is that ISON quickly reacts to form HNO3, which is tested in
the INHNO3 run (Table 3). It is noted, however, that experi-mental support for this assumption is lacking.
4.4 Deposition of intermediates
A last group of sensitivity runs is performed to assess the role of deposition processes of soluble intermediates in the oxidation of isoprene. Due to the additional polar hy-droxy group in ISOOH and MACROOH and considering the fact that another functional group could be formed through OH attack at the remaining double bond these hydroxy-hydroperoxides are probably very soluble and could there-fore be efficiently taken up by cloud droplets and possi-bly to other surfaces. The special role and properties of these hydroxy-hydroperoxides compared to other peroxy-radicals (ROOH) is often neglected (e.g. Berntsen and Isak-sen, 1997; Collins et al., 1999; Zaveri and Peters, 1999).
This is imitated in the LOWDEP run, where the solubility of CH3OOH is assumed to also be valid for these compounds,
with effect of a lower wet and dry deposition efficiency. In the standard simulation the solubility of hydroxymethyl hy-droperoxide (HOCH2OOH)has been used for these species
(i.e. 1.7·106M/atm at 298 K, O’Sullivan et al., 1996). An even more extreme case is tested in VLOWDEP, where deposition (dry and wet) of several intermediates (ISOOH, MACROOH, HACET, MPAN, MACR, ISON) in the MIM are neglected completely. On the other extreme, in the “HIGHDEP” simulation a 70% loss of ISOOH and MACROOH is assumed as in M¨uller and Brasseur (1995); Brasseur et al. (1998) and Granier et al. (2000).
5 Sensitivity to the chemical scheme
The horizontal distribution of ozone and PAN along with the changes resulting from the different isoprene oxidation mechanisms is shown in Fig. 2. A summary of selected bud-gets and minimal and maximal relative and absolute effects found in all sensitivity runs is given in Tables 4 and 5 to pro-vide more information and will be discussed later.
As expected, the changes are largest over the tropical rain-forest regions, where isoprene emissions are highest (Fig. 2). An exception is the large increase in PAN in the northern latitudes for MOZART. This mechanism appears to produce significantly more PAN under medium to high-NOx
condi-Table 4. Selected budgets numbers from the sensitivity simulations for May. Units are Tg/yr unless stated differently.
Test casea CH4 BASE MOZ- CBM LOW- LOW- LOW- HIGH- IN- NO- VLOW- LOW- HIGH-ART ISOP SOIL LTNG ISON HNO3 NACA DEP DEP DEP
O3Troposphere Burden [Tg] 273 304 290 291 296 304 298 303 297 298 322 308 300 Dry deposition –604 –724 –684 –707 –713 –719 –718 –705 –702 –705 –765 –730 –715 P(O3)–L(O3)b –80 90 37 54 56 85 86 71 58 63 190 115 66 P(O3) 3087 3956 3645 3669 3758 3938 3881 3908 3785 3808 4345 4041 3860 –L(O3) –3167 –3865 –3609 –3615 –3702 –3853 –3795 –3837 –3727 –3745 –4155 –3927 –3793 O3Continental PBLc Transportd 4 –50 –6 13 –52 –45 –52 –32 –29 –31 –58 –41 –53 P(O3)–L(O3) 410 564 487 495 559 554 561 527 525 530 603 559 561 CO Troposphere Burden [Tg] 271 302 298 300 288 302 305 302 304 305 315 313 294 Chem. Prod. 787 1081 958 1023 989 1078 1066 1071 1037 1045 1234 1138 1031 Chem. Loss. –2068 –2244 –2136 –2159 –2184 –2240 –2223 –2232 –2194 –2201 –2360 –2270 –2212 CH4–Lifetime [yr] 8.70 8.91 9.25 9.23 8.75 8.94 9.08 8.98 9.21 9.20 8.75 9.07 8.82 NOy Troposph. Burden [Gg-N] 198 314 310 278 273 313 305 317 294 299 419 349 285 Transp. Continental PBL –2.86 –4.42 –4.13 –3.98 –4.04 –4.36 –4.39 –4.42 –3.85 –3.97 –5.93 –4.64 –4.26 Transp. UT Tropicse 0.270 0.111 –0.094 0.075 0.24 0.098 0.143 0.094 0.07 0.103 0.136 0.045 0.202 PAN Troposph. Burden [Gg-N] — 84 72 57 53 84 81 85 78 82 147 111 60 Transp. Continental PBL — –0.766 –0.832 –0.595 –0.639 –0.756 –0.754 –0.705 –0.701 –0.72 –1.174 –0.887 –0.689 Transport, UT Tropics — –0.227 –0.173 –0.14 –0.08 –0.23 –0.206 –0.243 –0.218 –0.227 –0.386 –0.298 –0.135
aFor a list of acronyms of the runs see Table 3.
bNet photochemical production, based on the extended O
3family. P(O3) is gross chemical production and L(O3) chemical loss of ozone.
cContinental boundary layer (below about 800 hPa, σ > 0.778, σ = p/p
surface). Continents are defined by the model’s land–sea mask.
dSum of advection, convection and vertical diffusion tendencies. Negative numbers indicate net export from the region. eTropical upper troposphere (20◦
S–20◦N, σ < 0.34).
tions as found in this region. The effect in the extra-tropics is not fully developed in early summer. However, in the south-eastern U.S. there is a region where ozone produc-tion from industrial NOxand isoprene has already increased
ozone mixing ratios significantly above the background val-ues. The three mechanisms agree to within a few percent in their calculation of ozone levels in this region, reflecting that they have been originally tuned and tested for these condi-tions.
In the tropical continental regions, where NOx
concentra-tion are lower, however, differences of up to 50% are seen. The MOZART scheme results in about 15-30% lower ozone concentrations in the source region and the CBM mecha-nisms yields even lower values, especially in the clean Ama-zon basin. This is a result of the lower NOxmixing ratios
cal-culated by the two mechanisms as a result of stronger alkyl-nitrate formation (in line with the box model results, P¨oschl et al. (2000)).
In case of the CBM scheme, in the Amazon region a de-crease in surface mixing ratios (not shown) of NOx (10–
20%), PAN (20–50%) and OH (25–45%), but an increase in HO2is found compared to the BASE run. For the MOZART
scheme, on the other hand, NOx, HO2 and OH have
creased only slightly (≈5%, not shown), but PAN is also de-creased over the Amazon region by 20–40%. A likely cause for the lower PAN levels are the implicit assumptions of large losses of intermediates in both schemes. In the CBM mech-anism this is expressed in the 50% loss of carbon upon the initial reaction with OH. Strong carbon loss in MOZART oc-curs through the assumption of a 70% loss of the hydroxy-hydroperoxides.
The global average CO yield from isoprene in the two schemes can be estimated using information from the methane-only run: Assuming that the CO-yield from methane does not vary significantly when adding isoprene chemistry we calculate the overall CO-yield from isoprene of each scheme on a per carbon basis. Consistent with the consideration above for CBM (0.33) and MOZART (0.25) a lower CO yield is calculated for May than for the MIM with a CO-yield of 0.37.
Comparing the calculated average loss fraction of the hydroxy-hydroperoxides in MIM to the assumed fixed 70% in MOZART can further explain the low yield in the MOZART run. For the BASE run (using the MIM scheme)
Table 5. Maximal relative and absolute deviations of the test runs from the BASE run. The relative deviations have been restricted to regions
where the mixing ratios are more than 5% of the corresponding lower tropospheric (<500 hPa) average.
Test runa CH4 MOZ- CBM LOW- LOW- LOW- HIGH- IN- NO- VLOW- LOW- HIGH-ART ISOP SOIL LTNG ISON HNO3 NACA DEP DEP DEP
O3
max. relative change [%]b 4.7 0.5 0.4 15.8 0.2 0.3 3.6 0.2 0.2 41.8 16.0 2.0 min. relative change [%]c –48.2 –34.5 –63.4 –14.6 –15.7 –25.1 –28.4 –19.1 –17.1 –0.5 –11.6 –3.8 max. absolute change [nmol/mol]d 11.0 6.6 4.6 4.2 0.15 4.1 0.7 1.8 1.5 8.1 2.1 1.0 min. absolute change [nmol/mol] –23.9 –11.2 –12.5 –5.7 –2.5 –8.6 –5.1 –6.5 –5.8 –6.2 –3.2 –1.1
CO
max. relative change [%] 1.4 1.4 12.8 0.1 0.6 5.2 1.1 2.0 2.3 25.0 15.7 0.0 min. relative change [%] –42.9 –10.2 –10.3 –18.9 –1.4 –0.5 –3.6 –2.0 –1.4 0.0 0.0 –5.1 max. absolute change [nmol/mol] 1.8 1.9 16.0 0.01 0.6 3.5 1.3 1.4 1.9 35.8 20.6 0 min. absolute change [nmol/mol] –77.9 –11.7 –22.4 –33.7 –1.6 –0.6 –4.0 –2.3 –1.7 –0 –0 –5.9
NOx
max. relative change [%] 83.2 14.3 24.7 52.2 8.3 11.9 20.4 5.8 5.5 179.7 105.8 20.7 min. relative change [%] –79.2 –70.0 –73.4 –49.6 –38.1 –54.8 –32.3 –41.4 –38.0 –23.1 –48.1 –17.1 max. absolute change [pmol/mol] 2486 31.8 1537 89.6 3.5 15.6 98.7 25.4 25.5 89.5 23.9 42.2 min. absolute change [pmol/mol] –260 –127 –173 –46.7 –223 –79.1 –74.0 –64.1 –57.3 –267 –39.1 –13.6
PAN
max. relative change [%] — 79.5 114.0 13.8 19.9 31.6 69.4 44.0 51.0 1924 1072 0.8 min. relative change [%] — –81.1 –85.6 –88.8 –24.2 –33.4 –38.0 –45.1 –39.6 –14.0 –19.5 –48.3 max. absolute change [pmol/mol] — 497 37 2.2 4.0 2.1 13.5 0.6 1.2 617 195 1.0 min. absolute change [pmol/mol] — –118 –189 –352 –29.0 –54.8 –80.1 –64.9 –52.6 –1.2 –1.6 –78.4
OH
max. relative change [%] 6854 11.6 51.0 229 1.2 7.2 3.4 3.2 1.7 35.5 11.9 25.8 min. relative change [%] -49.8 -59.8 -67.9 -14.7 -25.4 -59.1 -45.7 -27.4 -26.0 -60.3 -60.4 -7.2
HO2
max. relative change [%] 45.7 21.9 142 23.7 3.0 36.4 6.9 7.8 8.7 38.5 22.4 6.1 min. relative change [%] -93.7 -20.1 -39.2 -39.7 -8.1 -13.4 -12.5 -12.6 -10.9 -12.3 -19.1 -14.2
aFor a list of acronyms of the runs see Table 3.
bPercentage by which the mixing ratio in the test run is maximally higher than the BASE run. cPercentage by which the mixing ratio in the test run is maximally lower than the BASE run. dLike relative changes, but for maximum difference in mixing ratios.
a global loss fraction of 35% of the hydroxy-hydroperoxides is calculated. Over the Amazon rain forest during May this loss fraction is 68% in the BASE run which is in qualita-tive agreement with the 1D model study of Jacob and Wofsy (1990) upon which Brasseur et al. (1998) based their gen-eral loss rate of 70%. However, the fraction is found to de-pend strongly on the OH concentrations since they limit the chemical lifetimes of these compounds. Consequently, in the free troposphere (above 800 hPa) the fraction of hydroxy-hydroperoxides lost via deposition is calculated to be much smaller (about 10%), because the photochemical loss via re-action with OH and photolysis is faster (the 24h-average life-time is about 12 h for those conditions). This also means that the loss of carbon via this pathway will actually depend on the assumed emission strength of isoprene, because this largely controls the abundance of OH in the boundary layer where most of the loss occurs. The reactivity of the group of intermediates will also be important, adding to the overall uncertainty. Although large uncertainties exist these
consid-erations argue against the use of fixed loss fractions and for an explicit treatment of these soluble intermediates and their spatially and temporally varying deposition rates.
The deviations in the PAN concentration at 300 hPa in the UT are also plotted in Fig. 2. The upper tropospheric val-ues are plotted here because they determine the large scale transport of NOxand give a better indication of the impact
of the chemical scheme on the background level of this com-pound. Interestingly, for MOZART higher PAN concentra-tions are calculated near the surface in the northern hemi-spheric extra-tropics (+40–60%), but the difference in the upper troposphere is much smaller (±5%). In these regions the treatment of the hydroxy-hydroperoxides is probably not important due to higher NOxand OH concentrations.
In CBM the calculated concentration of upper tropo-spheric PAN is lower by about 20-40% compared to the MIM-chemistry (BASE run) over large regions including the NH-extra-tropics. Near the surface the CBM scheme tends to calculate lower mixing ratios over the continents and most
10 R. von Kuhlmann et al.: Sensitivities in global isoprene modeling
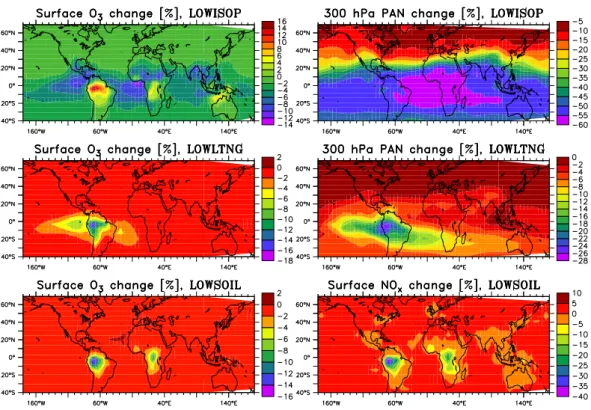
Fig. 3. Relative change (in %) in surface ozone and PAN at 300 hPa in the sensitivity runs with changed emissions. For the LOWSOIL simulation the change in surface NOxis plotted.
www.atmos-chem-phys.org/acp/0000/0001/
Atmos. Chem. Phys., 0000, 0001–25, 2003
Fig. 3. Relative change (in %) in surface ozone and PAN at 300 hPa in the sensitivity runs with changed emissions. For the LOWSOIL
simulation the change in surface NOxis plotted.
parts of the ocean (not shown). Taking into account that PAN in the CBM scheme actually encompasses all PAN-type species would increase the difference between the BASE and the CBM run.
These results are consistent with the findings from the box model simulations of P¨oschl et al. (2000) for high and low NOxscenarios. For high NOxthe MIM was found to be was
bracketed by the two schemes in the, with MOZART being higher and CBM being lower. Under low NOxwas found to
yield more PAN than the two other schemes.
The tropospheric burden of PAN (Table 4) is lower in MOZART (−14%) and in the CBM run (−32%) compared the BASE run. However, the export from the continental troposphere is largest in MOZART and significantly smaller in CBM. This means that higher efficiency of the MIM at medium to low NOx levels outweighed its lower efficiency
compared to the MOZART scheme on the global average. The net export of PAN from the tropical upper troposphere shows that in this region chemistry is a source of PAN under-lining its important role in the long-range transport of NOx.
Significant deviations are also found for total reactive nitro-gen (NOy), with the lowest values generally found for the
CBM simulation (Table 4).
The global tropospheric burden of ozone is lower by about 5% in the two other chemistry schemes. The results from a “methane-only” (CH4-CO-NOx-HOx) simulation are also
listed in order to assess the error in the overall effect of
iso-prene. While in the BASE run an increase of 31 Tg(O3)
com-pared to the CH4 run is calculated, it is only 17 or 18 Tg in the other two runs. The gross production of ozone (P(O3))
varies by as much as 300 Tg(O3)/yr in the different isoprene
runs, with an average increase compared to the CH4 simula-tion of about 700-800 Tg/yr. However, the change (decrease or increase) in the loss rate is always in line with the pro-duction change, so that the change in net propro-duction is not as large.
For the globally averaged export (or import) of ozone from the continental boundary layer even different signs are pre-dicted. The BASE run has the highest photochemical pro-duction of ozone and despite a compensating higher dry de-position rate it results in the largest export of ozone from this region.
The CO burden is only marginally different in the runs, but it could be that the spin-up time of 2 months is not suffi-cient to fully develop the effect for this longer lived species. The production rate is significantly lower in MOZART (– 123 Tg(CO)/yr or 11%) and CBM (–58 Tg/yr, 5%) due to the implicit loss assumptions in the two schemes. Despite the lower production rates and burdens of CO in these two runs, the oxidation efficiency of the atmosphere with respect to methane is somewhat lower (corresponding to a 0.3 years longer methane lifetime). Thus, for CO probably two ef-fects are competing: reduced production in the MOZART and CBM simulation due to higher losses of intermediates act
R. von Kuhlmann et al.: Sensitivities in global isoprene modeling 11
Fig. 4. Relative change (in %) in surface ozone in the HIGHISON and NONACA sensitivity runs compared to the BASE run.
Atmos. Chem. Phys., 0000, 0001–25, 2003
www.atmos-chem-phys.org/acp/0000/0001/
Fig. 4. Relative change (in %) in surface ozone in the HIGHISON and NONACA sensitivity runs compared to the BASE run.
against lower loss of CO due to lower OH levels in these runs. The latter is probably caused by the lower PAN amounts and thus less long-range transport of NOx.
Locally, the effects on CO mixing ratios can also be signif-icant (Table 5). It can be seen that the MOZART and CBM simulation can be as much as 11 and 22 nmol/mol lower in CO. For the CBM scheme regions with higher CO mixing ratios (up to 12 nmol/mol) are also found, which is probably due the faster oxidation of isoprene to CO resulting from the omission of several intermediate stages in the mechanism. The maximum perturbation in O3 is as large as about 10
nmol/mol for two chemistry schemes. Local deviations are also found for the two HOxspecies (OH and HO2), especially
for the CBM simulation.
6 Sensitivity to the emissions strengths
The effects on surface ozone and PAN at 300 hPa due to per-turbations of the emission strengths are shown in Fig. 3. The perturbation of upper tropospheric PAN in the LOWSOIL simulation was small (±2%) so that the change in surface NOxconcentrations is shown instead.
The reduction of the isoprene emissions in the tropics (LOWISOP) results in an increase of O3 in the source
re-gions, which is due to the reduced ozonolysis of isoprene. On the other hand, a decrease in remote regions and also in the free troposphere above the source regions is calculated (not shown), which is likely connected to less PAN formation and thus less NOxin remote regions. The absolute difference
(Table 5) in O3of about ±5 nmol/mol is not as large as those
found using different chemical schemes.
The predicted increase in the total ozone column in the BASE run compared to a “methane-only” simulation (CH4) of 31 Tg(O3) is reduced by 8 Tg (i.e. 26% of the effect).
In-terestingly, the tropospheric burden and the net production term of O3in the LOWISOP simulation are still higher than
for the MOZART and the CBM runs, whereas other bud-get numbers like the global CO burden and chemical produc-tion and the global PAN burden are significantly lower in the LOWISOP run. This shows that the impact of the isoprene oxidation scheme on O3is roughly comparable to the 50%
reduction in isoprene source strength, whereas most other
species show smaller deviations in the LOWISOP compared to using different chemical schemes.
A larger impact is predicted for PAN, which is reduced by about 40–60% at 300 hPa in the LOWISOP run, suggest-ing an approximately linear response to the 50% reduction in isoprene emissions. If the overestimate of isoprene con-centrations is due to overestimated isoprene emissions or a missing non-chemical sink this could together with the fact that a large (>50%) fraction of PAN in the tropics is from isoprene (von Kuhlmann, 2001) explain a large part of the overestimate in PAN found by von Kuhlmann et al. (2003b). The reduction of the soil emissions (or the canopy reduc-tion factor) results in a maximum reducreduc-tion of NOxof 38%
(Table 5 and Fig. 3) over the central Amazon and a reduction in O3 of about 15%, only 2.5 nmol/mol. In the free
tropo-sphere the effect on ozone and as mentioned above also on PAN is negligible (O3: < ±1%). Recall, however, that the
absolute change in the emission strength was only small in this test run.
A much larger effect is found when reducing lightning NOx emissions over the Amazon region (LOWLTNG run).
The 60% reduction in the lightning NO source reduces PAN concentrations by up to 30% in that region in the LOWLTNG run. If we could assume a linear response from this, we could estimate that about half of the PAN formed from isoprene in that region is from the interaction of isoprene oxidation products and lightning NOx. However, linearity is probably
not fulfilled so that this estimate will give only an indica-tion of the magnitudes. The remaining PAN is formed from NOx from biomass burning (in Venezuela), some
surround-ing industrial emissions (e.g. from cities at the west coast of South America) and from NOx emissions from soils. The
overestimate of the simulated NO2-column over the central
Amazon in May compared to GOME retrievals found in von Kuhlmann (2001) was as large as a factor of 10. Thus, even when considering the uncertainties in that comparison, it is possible that the 60% reduction was too mild. Besides a still overestimated lightning-NOx source also an overestimated
NOxlifetime and other NOxsources could play a role.
However, a better quantification of the source strength of lightning in this region, especially in the wet season, when other NOx sources are weak (and deposition loss is
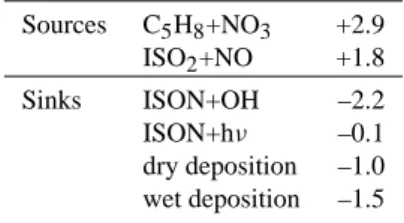
Table 6. Tropospheric budgets of C5-isoprene nitrates in the BASE
simulation (MIM chemistry) in May. Numbers are in Tg(N)/yr.
Sources C5H8+NO3 +2.9 ISO2+NO +1.8 Sinks ISON+OH –2.2 ISON+hν –0.1 dry deposition –1.0 wet deposition –1.5
vertical transport (PBL turbulence, convection) appears to be a key to a better simulation of the chemistry over the Ama-zon, and significantly influences the export of PAN from that region.
7 Sensitivity to the fate of isoprene-nitrates
The nitrates formed in the oxidation of isoprene are usu-ally represented by only a few surrogate species in the con-densed mechanisms, due to a lack of more detailed knowl-edge of their individual chemistry and computational restric-tions. Apart from the uncertainty in their formation rate, it is also largely unknown what products are formed upon their reaction with OH or photolysis.
The changes of surface ozone in the HIGHISON and NONACA simulations are shown in Fig. 4 and further re-sults are listed in Tables 4 and 5. Ozone concentrations de-crease by about 10–20% in the central Amazon region in these two runs. The peak effect of an increased nitrate forma-tion rate (8.8% of the ISO2+NO reaction) is higher, whereas
the changes in the simulation in which all products of the reaction of isoprene nitrates with OH (ISON+OH) are as-sumed to deposit (NONACA) are more widespread. As men-tioned before a higher yield of isoprene nitrates is actually supported by a recent laboratory study (Sprengnether et al., 2002).
The results from the third run in which all ISON is quickly converted to HNO3(INHNO3) is not shown, since it yielded
very similar results than the NONACA simulation. This is understandable, because forming HNO3from ISON will also
result in a high likelihood of permanent nitrogen removal from the atmosphere, but in this case via deposition of ni-tric acid instead of an explicit assumption in the scheme.
The global average sources and sinks of the surrogate species ISON in the MIM are listed in Table 6. It is cal-culated that more than 60% of the ISON surrogate in MIM is formed from the nighttime reaction of isoprene with NO3.
The isoprene-NO3-adduct could in principle react with NO,
NO3, HO2, OH or decompose (Jenkin et al., 1997), but no
mechanistic information is available at present and as men-tioned before the SAR estimation method for nitrates is not very reliable. Studies investigating this product group should
mainly focus on the question of how much of the nitrates are eventually lost from the atmosphere without releasing NO2. In the BASE case (MIM) about 53% is lost via dry and
wet deposition in May on the global average. This is only slightly higher that the annual average of 48% calculated in von Kuhlmann (2001). This high fraction is the result of a large Henry’s Law constant of 1.7·104M/atm at 298 K used for this species. The value obtained by Treves et al. (2000) for 5-nitroxy-2-butanol has been assumed for ISON.
More extreme assumption have been made by M¨uller and Brasseur (1995), who assume 100% loss of isoprene nitrates, and by Houweling et al. (1998), who apply deposition prop-erties of PAN also to the nitrates, thus neglecting wet depo-sition and yielding slower dry depodepo-sition than in the other test cases. The first assumption should be similar to the NONACA case tested here, since only a small fraction of ISON photolyzes to give back NO2(Table 6). The latter
as-sumption is unrealistic and probably a compromise needed because the nitrates from isoprene are not differentiated from the alkyl nitrate pool in their scheme. The tests performed here should thus give a good indication of the actual range of uncertainty from the treatment of isoprene nitrates.
Although the global effects on ozone and PAN are smaller than seen in the test with different chemistry schemes, the local differences in O3are not negligible (up to 5 nmol/mol).
The net production in the INHNO3 simulation (58 Tg/yr compared to 90 in the BASE run) is almost as low as in the CBM simulation (54 Tg/yr).
8 Sensitivity to deposition of intermediates
Two assumptions about deposition properties of soluble in-termediate species are tested here (LOWDEP and HIGH-DEP, see Table 3). Additionally, for comparison the ex-treme assumption of a total neglect of deposition of inter-mediate species is tested in the VLOWDEP scenario. In the BASE case where the hydroxyhydroperoxides (ISOOH and MACROOH) are assumed to be relatively soluble a loss frac-tion of 33% of these species is calculated on the annual mean. The remaining two thirds photolyse or react with OH. Thus, a loss of 70% (as HIGHDEP) appears to be only possible when heterogeneous loss on aerosols occurs which is speculative at present.
The effect of these assumptions on ozone is quite small (< 3 nmol/mol) for the two more realistic cases (LOWDEP and HIGHDEP), but are predicted to be in the range ±6 − 8 nmol/mol for the VLOWDEP case (Table 4). For that case also the highest tropospheric burden of O3 of all test
simu-lations is calculated, which corresponds to an increase of 49 Tg(O3) compared to the CH4 run. This is an over 50% larger
effect than in the BASE case (+31 Tg(O3).
The global CO burdens have changed only slightly as in all the other test runs: -4% in LOWDEP and +2% in HIGHDEP. But local differences can be especially large in the LOWDEP
R. von Kuhlmann et al.: Sensitivities in global isoprene modeling 13
Fig. 5. Change in the PAN mixing ratios (in %) at 300 hPa for the LOWDEP and HIGHDEP simulations.
www.atmos-chem-phys.org/acp/0000/0001/
Atmos. Chem. Phys., 0000, 0001–25, 2003
Fig. 5. Change in the PAN mixing ratios (in %) at 300 hPa for the LOWDEP and HIGHDEP simulations.
run (+15% or 20 nmol/mol), though the resulting decrease in CO in the remote SH at the surface is also small (≈5%, not shown). This is comparable in magnitude to the effect found by reducing the source strength of isoprene. The pho-tochemical source of CO is changed by ±50 Tg(CO)/yr (< 5%) in the two more realistic scenarios and +150 Tg/yr in the VLOWDEP case. Note that the magnitude of these ef-fects are also coupled to the total source strength which was reduced by 30% for all simulations compared to the estimate of Guenther et al. (1995) of 500 Tg(C)/yr.
An interesting point can be seen in the change in the methane lifetime. While in the two more realistic simula-tions the methane lifetime changes consistently with the in-crease or dein-crease of CO production, in the VLOWDEP the methane lifetime is shorter than in the BASE simulation de-spite the higher production of CO. This behavior is probably the result of also neglecting the deposition of two nitrates from isoprene oxidation (ISON and MPAN) and the strongly increased PAN abundance (Tables 4 and 5), which lead to enhancement of global OH via more transport of NOx into
remote regions.
Since the assumptions in the HIGHDEP simulation are very similar to those implicit in the MOZART mechanism, one can examine the impact of these assumptions on the total difference between MOZART and the BASE run. The differ-ence between the MOZART and HIGHDEP runs are much smaller than those between MOZART and our BASE case. This means that the assumption of 70% loss of hydroxy-hydroperoxides from isoprene in MOZART probably causes a large part of the difference to the MIM scheme used in MATCH-MPIC. Some differences, however, must have other reasons. For instance, the global PAN and NOyburdens are
even smaller in the HIGHDEP than in the MOZART run which confirms the tendency of the MOZART scheme to pre-dict high PAN levels. Note that PAN-related rate parameters have been harmonized for this study. Thus, other mechanis-tic assumptions or rate parameters of precursors of the per-oxyacetyl radical are responsible for the higher PAN yield in the MOZART mechanism which was also found in the box model study of P¨oschl et al. (2000).
The largest effects in this group of test cases is in fact found for PAN, which is depicted in Fig. 5. Especially in the LOWDEP case the deviations are large: A 30-45% in-crease in PAN levels can be seen in the upper troposphere
Table 7. Turnover of primary HOxsource reactions related to
iso-prene chemistry in 1026 molec/cm3/s in the tropical upper tropo-sphere (20◦S–20◦N, σ < 0.34) in May.
Reaction \ Case CH4 BASE LOWDEP HIGHDEP
HCHO+hνa 167.7 233.3 251.2 215.6 CH3OOH+hν 30.3 34.0 36.4 32.2 MGLO+hν — 23.7 32.0 14.9 HACET+hν — 7.2 10.6 4.6 MACROOH+hν — 3.7 7.4 — MACR+hν — 3.7 4.9 2.5 CH3CO3H+hν — 0.7 1.2 0.3 ISOOH+hν — 0.6 0.9 — Sum 198.0 306.9 344.6 270.1 Change –35% — +12.3% –12.0%
aTurnover of HCHO+hν → HCO + H channel times two.
of the Southern Hemisphere (SH) and the northern tropics when the deposition properties of CH3OOH are used for all
peroxides (as in the LOWDEP run). The decrease in PAN due to even higher deposition rate is not as large: about 15-20% over large parts of the SH. The changes in the lower atmosphere are even higher with peak changes of a factor of 10 (see Table 5), but these occur in regions with PAN mixing ratios of only a few pmol/mol (e.g. in the south east Pacific). Since photolysis of peroxides is believed to contribute to upper tropospheric HOx(=OH+HO2) production (e.g.
Chat-field and Crutzen, 1990; Prather and Jacob, 1997; Jaegl´e et al., 1997) it is instructive to see the effect of the differ-ent treatmdiffer-ent of hydroxy-hydroperoxides on the HOxmixing
ratios in the this region. In the LOWDEP simulation a 10% higher zonal mean HOxabundance in the uppermost tropical
troposphere (100-200 hPa) is found (not shown). The effect on OH is only slightly smaller (+7%), although locally the increase is as large as 35%. The HIGHDEP runs results in about 5% lower zonal mean HOx values than in the BASE
case. A list of some key reactions contributing to tropical UT HOx is listed in Table 7. We find that the photolysis
of some isoprene oxidation products is at least as important as the photolysis of methyl-hydroperoxide (CH3OOH)
iden-tified by Prather and Jacob (1997) as a major contributor. These results qualitatively confirm the findings of Collins
et al. (1999) that isoprene products can significantly influ-ence UT HOx. Note that acetone chemistry is not taken into
account here which would constitute additional sources of HOxin the upper troposphere (e.g. McKeen et al., 1997). The
role of the photolysis of isoprene intermediates in the UT also shows that chemical mechanism reductions which are exclu-sively based on box-model calculations for the lower tropo-sphere (e.g. Geiger et al., 2003) can lead to errors in large scale 3D models. We find a significant influenced of the as-sumption about the deposition of intermediates on these re-sult (Table 7) underlining that more accurate knowledge on these properties are needed. Note that the assumption made in Collins et al. (1999) are tested in our case LOWDEP. Fur-thermore, we find that a large fraction of the additional HOx
source is through photolysis of formaldehyde formed in the oxidation of isoprene (+65.6·1026molec/cm3/s in the BASE run compared to the CH4 simulation, Table 7).
9 Conclusions
A number of different sensitivities in the treatment of iso-prene in a global model have been examined. Different chemical schemes, changed emission rates, and different assumptions about the fate of isoprene nitrates and about the deposition efficiency of certain intermediates have been tested and analyzed for one month of the year (May).
The overall picture obtained in these tests is that global average budget numbers of O3and CO vary in the different
sensitivity runs by about 5% or less, whereas the changes in total NOy burden and PAN burden are larger (10% and
30–40%, respectively). Local deviations of the key species, however, can be substantial.
The 3D model studies reported in this paper confirm the relevance and significance of the differences between the chemical mechanisms investigated in the box model study of P¨oschl et al. (2000). On the other hand the results show that transport processes play an important role and that the over-all effects of isoprene on global atmospheric chemistry can hardly be quantified by extrapolation of simple box model calculations.
The deviations in the ozone mixing ratios induced when exchanging the chemical scheme were found to be largest among all test simulations. The simulation with the highly condensed CBM-scheme of Houweling et al. (1998) pro-duces the largest local deviations in O3 from the base
sim-ulation (up to 60% or 12 nmol/mol). The total tropospheric burden of O3 calculated for the three runs with different
chemistry is increased compared to the background methane chemistry by 24±7 Tg(O3) (thus with a range of ±30%). The
range of effects among all test runs (without the VLOWDEP run, which was intended as an idealized but unrealistic test case) can be expressed as an increase in tropospheric ozone by 26±9 (or ±35%). This range of uncertainty and the much larger local deviations found in the test runs show that the
treatment of isoprene chemistry in global models can only be seen as a first order estimate at present.
The reason for the deviations of the results obtained with different isoprene oxidation mechanisms cannot be easily be explained. However, a comparison to a run in which a major assumption of the MOZART scheme – the constant loss frac-tion of intermediates – was adopted (HIGHDEP case) sug-gests that this is a major reason for the differences.
In the case of the CBM scheme (Houweling et al., 1998) it is suspected that in addition to the large loss of carbon and thus also of some functional groups, the direct channel-ing into smaller products produces the different behavior in that scheme. For this scheme even a different sign for the net transport of ozone out of the global continental boundary layer (thus net import) was calculated in our test set-up.
The MOZART mechanism tends to produce more PAN than the MIM-scheme used in the reference run, but this is in part prevented by the implicit assumption of a high (and constant) loss rate of soluble intermediate species (the hydroxy-hydroperoxides from isoprene). It is argued that the actual loss fraction of these compounds in a certain environ-ment will also depend on the abundance of OH. Although no mechanism can be judged superior over the other schemes, it appears advantageous that these compounds are explicitly included in the MIM. As new data on their reactivities and deposition properties become available, they can be readily implemented in the scheme or the surrounding model.
While deposition of soluble intermediates appeared to have a relatively small impact on ozone, it was found to be much more important for the formation of PAN and thus the resulting total burden of NOy. The effect of an increased
de-position rate resulted in a reduction in the tropospheric PAN burden (–24 Gg-N, or –29%) which was comparable to the effect to a 50% reduction in the isoprene source strength (–31 Gg-N, –37%). Overall, it appears that the overestimation of modeled PAN compared to observations in the tropics found in another study with MATCH-MPIC (von Kuhlmann et al., 2003b) could be largely explained by a combination of the three factors found in this study to have the largest impact on PAN: total source strength of isoprene, source strength of lightning NOxover regions with large isoprene emissions
and loss of intermediates through deposition or possibly het-erogeneous processes. All of these parameters need to be quantified better in order to improve the simulation of the long-range transport of NOxin the tropics.
A strong impact of isoprene reaction products lifted into the upper troposphere was found, with an uncertainty of about 10% solely due to the deposition assumptions of the soluble intermediates. A large part of the additional HOx
is from the photolysis of formaldehyde produced from iso-prene.
For some species (e.g. CO, PAN) the effects of a 50% re-duction in tropical isoprene emissions are of the same magni-tude as those from exchanging the chemical scheme. While the variation of the release of NO out of the forest canopy