HAL Id: hal-01110776
https://hal.archives-ouvertes.fr/hal-01110776
Submitted on 28 Jan 2015HAL is a multi-disciplinary open access archive for the deposit and dissemination of sci-entific research documents, whether they are pub-lished or not. The documents may come from teaching and research institutions in France or abroad, or from public or private research centers.
L’archive ouverte pluridisciplinaire HAL, est destinée au dépôt et à la diffusion de documents scientifiques de niveau recherche, publiés ou non, émanant des établissements d’enseignement et de recherche français ou étrangers, des laboratoires publics ou privés.
of sound annoyance in open-plan offices
Ange Ebissou, Etienne Parizet, Patrick Chevret
To cite this version:
Ange Ebissou, Etienne Parizet, Patrick Chevret. Use of the Speech Transmission Index for the assessment of sound annoyance in open-plan offices. Applied Acoustics, Elsevier, 2015, 88, pp.90. �10.1016/j.apacoust.2014.07.012�. �hal-01110776�
1
Use of the Speech Transmission Index for the
assessment of sound annoyance in open-plan offices
Ange Ebissou
a, Etienne Parizet
b, Patrick Chevret
a(a) Institut national de recherche et de sécurité (INRS), Vandœuvre-lès-Nancy, France
(b) Laboratoire Vibrations Acoustique, INSA-Lyon, Université de Lyon, F-69621 Villeurbanne, France
Corresponding author : Etienne Parizet Email :
etienne.parizet@insa-lyon.fr
Tel. n° : + 33 4 72 43 81 21. Fax n° : + 33 4 72 43 87 12.
In open-plan offices, employees often have to work despite being distracted by multiple sources of speech close to them. This disturbance is even more severe when the surrounding conversations are intelligible. For this reason the disruptive power of such babble-like noises can be quantified by measuring speech intelligibility. As such, the Speech Transmission Index is usually used to assess the quality of open-plan offices. In this article, the STI is used to evaluate the nuisance potential of sound environments in an open-plan office. 57 subjects were confronted with a serial memory task in four STI conditions (from 0.25 to 0.65). Noise annoyance was assessed objectively by measuring performance, and subjectively using the NASA-TLX questionnaire for measuring cognitive load. A very strong inter-individual variability appeared in performance measurements. Approximately half of the panel was made of high performing subjects, who proved to be insensitive to speech intelligibility. For the other half, performance was reduced when STI increased, as shown in previous studies, with a plateau for STI greater than 0.45. This strong inter-individual variability can explain the discrepancy between results observed in previously published studies. The NASA-TLX questionnaire proved to give useful complementary results. For example, high-performing subjects related a higher workload in the condition of maximum speech intelligibility.
1
Introduction
Open-plan offices are in widespread use in the service industry. The main feature of these workspaces is the absence of full-height partitions for isolating workers from one another. In comparison with conventional, closed offices, this creates a heightened feeling of crowding and distraction by the background noise [1-5]. Among all the types of noise pollution, speech noise is particularly disruptive [6,7]. Especially, speech intelligibility is considered as one of the main factors: the easier it is to understand neighbouring voices, the more upsetting they are [2]. Experimental studies on noise annoyance caused by speech in the workplace generally use the irrelevant sound effect (ISE) paradigm which is the phenomenon whereby a person is prevented from executing a task correctly by the presence of an unrelated noise [8]. The expression irrelevant speech effect can also be found when speech is a major part of the disruptive noise. To investigate ISE, researchers often use serial memory tasks. In this type of tasks, participants watch a series of digits or letters displayed on a screen, item by
2
item. The screen then becomes blank for 5 to 10 seconds. After that pause, subjects must reproduce the series in the right order. The task is repeated several times, either in silence or in noisy environments. The decrease in performance between the quiet and the noisy conditions represents the magnitude of the ISE.
Such experiments have confirmed that the nuisance potential of speech depends on its intelligibility. For example, decreasing the signal-to-noise ratio [9] or carrying out low-pass filtering [10,11] both degrade speech intelligibility and make it less disruptive. Conversely, the sound level does not influence performance within a reasonable range of values. In order to better describe the nuisance potential of speech, it is necessary to quantify both the intelligibility of speech and the disturbance it causes. To this end, Hongisto [12] proposed to use a specific intelligibility measure, the speech transmission index (STI). He defined the
decrease in performance (DP) as the difference in error rates between control and noisy
conditions. Hongisto then hypothesised that the relation between STI value and decrease in performance is the same as the one between STI and sentence intelligibility. So, the author predicted disturbance caused by intelligible speech. That model, as can be seen in Figure 1, shows the existence of three zones along the STI scale:
• a low-disturbance zone, for STI < 0.3;
• an intermediate zone, for 0.3 < STI < 0.5, where disturbance increases rapidly with rising STI values;
• a high-disturbance zone, for values of STI over 0.5.
Using those forecasts, STI target values have been proposed for open-plan offices [13]. Those recommendations are part of the International Standard ISO 3382-3 on acoustic measurements in workspaces [14].
Figure 1: Decrease in performance as a function of STI as proposed by Hongisto [12], together with data from four studies. This figure is taken from [12].
However, little experimental data exists for validating this model. Most investigations of ISE involve comparing clear speech of perfect intelligibility with silence or stationary noise in the intermediate STI region. For example, Liebl et al. [15] found a relationship between
3
STI and DP that is similar to what Hongisto proposed. However, for Haka et al. [16], the slope of the curve should begin at a much higher STI value than 0.3. On the contrary, Jahncke
et al. [17] found that the ceiling of the curve should already be reached for STI = 0.35. The
authors of those last two papers call for more experimental data between extremely low and extremely high STI values.
While Hongisto's model aims at predicting performance, noise can also induce annoyance, which is defined as the increase in difficulty caused by the sound environment [18]. For some other tasks, an increased intelligibility may not reduce the performance of subjects [15,17], at the cost of a higher difficulty [19]. A subjective appraisal of task difficulty could therefore supplement the usual performance measurements. To that end, one of the most widely used tools is the NASA-TLX (Task Load Index) questionnaire [20,21]. It is composed of six questions, one for each component of cognitive load. The first three questions (labelled as "mental demand", "physical demand" and "temporal demand") concern the intrinsic demands of the task, i.e. the resources it required, independent of the person who is performing it. The other three questions relate to the interaction between the task and the subject: self-evaluation of performance, needed effort and frustration level. For each question, respondents give a score ranging from 0 to 100 (by step of 5) . A high score indicates a heavy task load. The six scores are then aggregated, either after a separate weighting stage, or by calculating an unweighted average. The RTLX (Raw Task Load Index) results from the latter, simpler procedure [22].
The goal of this paper is to add new data of decrease in performance and cognitive load in the intermediate range of STI values, in order to contribute to the evaluation of this predictor. The experiment considered the effect of a single voice on performance. This is expected to happen in a densely populated open-plan office, when the voice of only one close neighbour is not drowned in the overall background noise. In that situation, with a stationary masking sound, the STI should be an accurate predictor of noise annoyance. This experiment was conducted with a high number of subjects (57), because a strong inter-individual variability was expected.
2
Experiment
2.1
Methods
2.1.1 Subjects
Fifty-seven subjects were recruited for this experiment. There were 32 women and 25 men aged between 22 and 73, with an average 36 years. 11 subjects were non-native French speakers. All the subjects stated that they did not have any major hearing problems. All were compensated for their participation
2.1.2 Performance task
Subjects had to carry out a serial memory task. Digits from 1 to 9 (inclusive) were displayed one by one in a random order on a computer screen in front of the participant. Each digit appeared for 0.7 seconds and was separated from the next by a pause of 0.3 seconds. The digits were displayed clearly in black on a light grey background. The size of each number on the screen was 3 cm high so that they were easily legible (font MS Sans Serif 85 points). After the final number disappeared, subjects had to keep the series in mind for a 5-seconds retention period. A keypad with nine buttons was then displayed. The subject had to re-enter the series by clicking on the buttons in the order that corresponded to the series to be remembered. There was no time constraint for the subject during this re-entry phase. However, when a digit
4
was chosen, the corresponding button was withdrawn and it was not possible to reselect it. The following series was only launched once the final number had been proposed, after a short pause of 3 seconds. Each incorrectly placed number was counted as an error. Series followed one another for 10 minutes, which constituted an experimental block.
2.1.3 Sound stimuli
The subjects worked in five different sound environments. One of them was totally silent: this was the control condition. The four others corresponded to masked speech, with four different STI values. The samples of clear speech and the masking noise came from recordings designed for speech audiometry [23]. The speech signal was the voice of a trained male speaker reading lists of sentences. These were sentences from Fournier and Combescure lists (in French) as well as lists from the French version of the Hearing in Noise Test (HINT). The masking noise was made up of a babble of unintelligible voices, its level being stationary. In order to get STI values in the range of interest, some realistic configurations of open-plan offices were simulated by using a simple model of prediction [24]. In these configurations, a face to face workstation was considered where the two persons were separated by a low divider. Spectra corresponding to office-like sound conditions were thus obtained. Each configuration was characterised by a STI value and a signal-to-noise ratio. The STI was calculated based on the resulting average spectra and the procedure described in the IEC 60268-16 standard [25]. Four STI values were selected for this study: 0.25, 0.35, 0.45 and 0.65. Figure 2 shows the average spectra of signals at the listener’s ear in each of the conditions as well as the corresponding SNRs.
The presentation level of the sound mixture was set to 46 dB(A), which corresponds to usual levels measured in open-plan offices (e.g. [26, 27]). This level is quite similar to the ones mentioned in the existing literature (e.g., 48 dB(A) in [16], 51 dB(A) in [17]). Beside, most studies have shown that this presentation level has very little influence on performance, as measured by various tasks. As an example, Landström et al. [28] measured performance of subjects submitted to random noise or speech at two levels (40 and 50 dB(A)). While the kind of background noise modified the performance, its level did not.
STI = 0.25 STI = 0.35
5
Figure 2: Average sound pressure levels per octave band of speech and noise signals for each noisy condition.
2.1.4 Procedures
For each participant, the experiment spanned two days. On each day one listening session was done including three experimental blocks. Each session comprised one control block, with serial memory task executed in quiet and two test blocks. Subjects thus faced each test condition once and the control condition twice. A learning effect was expected. Therefore, for each test block, the decrease in performance was computed using the control block of the same session as a reference. The running order of the conditions was almost balanced for all the subjects, i.e. each condition was encountered at each position an almost equal number of times. After each block, participants were presented with a French version of the NASA-TLX questionnaire. A RTLX score was thus recorded for each block.
Each participant worked alone in a soundproofed cabin. Subjects sat at a small desk, facing a computer screen and a loudspeaker placed behind the screen. The computer was equipped with an Echo Gina sound card (16 bits, sampling frequency of 48 kHz). The frequency response of the loudspeaker in the room was corrected by a third-octave equalizer (Behringer 8024).
2.2
Results
The following statistical analyses were conducted with Statistica v10 software. For each speech condition, the decrease of performance, as defined by Hongisto [12] was computed. Table 1 presents the average decrease in performance and the average RTLX scores.
Decrease in performance (%) RTLX Condition Mean Standard deviation Mean Standard deviation
6 Control - - 50.2 16.8 STI = 0.25 1.23 8.93 59.9 15.9 STI = 0.35 1.99 8.72 59.5 18.2 STI = 0.45 3.85 9.56 61.3 19.3 STI = 0.65 5.1 9.58 64.6 16.9
Table 1: Summary of measurements of performance and cognitive load for speech in stationary noise.
2.2.1 Performance
On average, subjects made 2.25 errors per series in the silent condition. There was an apparent learning effect: the average number of errors in the silence was 2.60 on the first day and 1.90 on the second. This difference is significant (Wilcoxon signed-rank test, p<0.001).
The mean number of errors per series did not depend on the subject's gender, neither on his native language. There was a slight dependence on the subject's age (R = 0.37, p<0.01).
As expected, performance seemed to decrease when speech intelligibility was improved, as is shown in Figure 3, but results do not exhibit the shape of STI-performance curves which can be found in existing literature [12-13, 15-17].
-5 0 5 10
0.25 0.35 0.45 0.65
Speech Transmission Index
D e c re a s e i n p e rf o rm a n c e ( % )
Figure 3: Decrease in performance for all STI values. Mean values are presented with their corresponding confidence intervals.
A three-factor mixed analysis of variance was conducted using the individual decrease of performance data, with STI (4 levels) as a within-subjects factor, gender and native language as between-subjects factors. This analysis show that the main effect of STI was significant: F(3,159) = 4, p<0.01. But post-hoc tests (Tukey's HSD) did not allow to build homogeneous groups of STI values (p = 0.05).
Native language was the other significant factor: F(1,53) = 12.05, p<0.01. The variation of decrease in performance with STI values is shown in figure 4 for these two groups of listeners.
7 -5 0 5 10 15 20 0.25 0.35 0.45 0.65
Speech Transmission Index
D e c re a s e i n p e rf o rm a n c e ( % ) F NF
Figure 4: Decrease in performance with STI values, for the two groups of listeners (native vs. non-native French speakers).
This figure shows that decrease in performance is greater for non-native French speakers. The difference between two groups is significant for the two highest STI values (Mann-Whitney U test, p<0.005). Most studies in the field have shown that mother tongue or foreign language equally reduce performance in a seriation task [29, 30]. This experiment showed opposite results; but the low number of non-native French speaking participants (11) may reduce the validity of this conclusion.
In order to detect homogeneous groups of subjects, a hierarchical cluster analysis of the panel was conducted. Euclidean distances between subjects were computed from the four individual decreases in performance. Ward method was used for clustering. The obtained dendrogram is represented in figure 5.
0 50 100 150 200 250 Dist. Agrégation O_50 O_20 O_55 O_42 O_9 O_7 O_49 O_27 O_10 O_41 O_37O_6 O_53 O_29 O_24 O_19 O_5 O_56 O_43 O_18 O_34 O_45 O_36 O_3 O_2 O_38 O_40 O_33 O_35 O_26 O_17 O_32 O_57 O_46 O_15O_8 O_51 O_21 O_16 O_13 O_54 O_28 O_30 O_12 O_48 O_23 O_4 O_52 O_47 O_14 O_44 O_39 O_25 O_31 O_22 O_11 O_1
8
This dendrogram makes clear that two groups of subjects can be created, with 25 people in the first one and 32 in the second one. As concerns the number of errors, it appeared that, in each tested condition (including the two repetitions of the control one, which have not been used to cluster subjects), this number of errors is significantly lower for subjects in group 2 than for subjects in group 1 (Mann-Whitney U test, p<0.005). Moreover, the number of series is higher for group 2. Therefore, it can be said that group 2 represents "high performing" subjects, when compared with listeners from group 1. This is not due to a higher benefit from learning effect, as the increase in performance, measured over the two control conditions, is similar between groups.
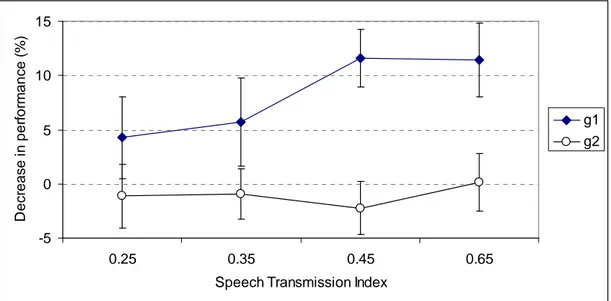
A second analysis of variance was conducted. It was a two-factor mixed one, with STI (4 levels) as a within-subjects factor and group (2 levels) as a between-subjects factor. The two factors were significant: for the "group" factor, F(1,55) = 92.5, p<0.001 and for the "STI" one, F(3,165) = 3.3, p<0.02. The one-way interaction is also significant (F(3,165) 3.4, p<0.02). This interaction can be seen in figure 6.
-5 0 5 10 15 0.25 0.35 0.45 0.65
Speech Transmission Index
D e c re a s e i n p e rf o rm a n c e ( % ) g1 g2
Figure 6: Decrease in performance as a function of STI for the two groups of listeners.
For the "high-performing" subjects (group 2), there is no effect of STI on decrease in performance. For the other group (group 1), the effect is similar to the one presented in the existing literature (see figure 1). The decrease of performance is significantly greater than 0 for all conditions (Wilcoxon signed-rank test : p<0.05 for STI = 0.25, p<0.01 for STI = 0.35 to 0.65).
2.2.2 Workload assessment
First of all, it appears that RTLX scores measured in the control conditions were significantly lower in the second day (Student's t(56) = -2.75, p<0.01), which means that the test was considered as less demanding on the second day. In the following, the two scores were averaged together.
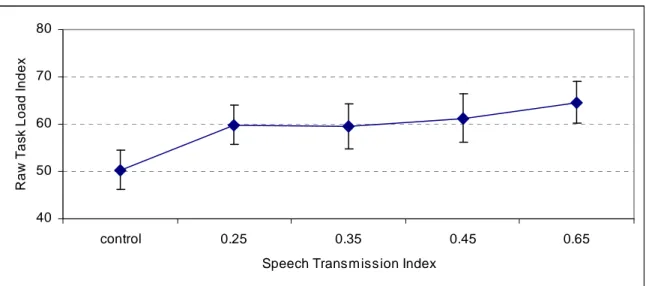
RTLX scores were distinctly higher for noisy conditions than for the control condition, as shown in Figure 7. The effect of the sound condition factor was significant: F(4,220) = 20.7, p<0.001). Clearly, this was mainly due to the difference between the control condition and the noisy ones. But a post-hoc analysis (Tukey's HSD, p=0.05) indicates that the condition STI=0.65 is significantly different from the two lowest STI conditions.
9 40 50 60 70 80 control 0.25 0.35 0.45 0.65
Speech Transmission Index
R a w T a s k L o a d I n d e x
Figure 7: RTLX scores for all STI values. Mean values are presented with the corresponding confidence intervals.
Gender, native language or age did not have a significant impact on RTLX scores. On the other hand, a two-factor mixed ANOVA, with condition (5 levels) as a within-subjects factor and group (2 levels, related to performance, see 2.2.1) as a between-subjects factor, showed that the task was significantly less demanding for subjects belonging to group 2 (high performing subjects): F(1,55)=16.4, p<0.001. Also, RTLX scores increase with intelligibility for subjects in group 1 (figure 8).
40 50 60 70 80 90 control 0.25 0.35 0.45 0.65
Speech Transmission Index
R
T
L
X g1
g2
Figure 8: RTLX scores for the two groups of listeners. Mean values are presented with the corresponding confidence intervals.
In the first group of participant, a post-hoc analysis (Tukey's HSD) showed that the workload was significantly higher (p=0.05) in the four noise conditions as compared to the control one. Also, the values obtained for the two extreme STI values (0.25 and 0.65) are significantly different.
In the second group of participants, the four STI conditions cannot be considered as different. But the workload assessment is significantly lower in the silence condition
10
indicating that RTLX can provide useful information, beside objective measurement of the subject's performance.
3
Conclusion
In open-plan offices, speech noise is reported to be one of the main disrupting factors for people at work. The purpose of this study was to assess the relevance of the STI for evaluating the disruptive power of speech noise in such environments.
As expected, the performance when doing a serial memory task was sensitive to the presence of speech noise. However, this effect is strongly dependent on the participant. This could partly explain the discrepancy between results of the existing literature (e.g. [12, 15-17], as far as these studies have been conducted with a lower number of participants.
A within-subjects analysis showed that, some people (approximately half of the panel used in this study and identified as the best performing subjects) proved to be insensitive to intelligible speech while achieving the task. In the meantime, for all conditions (including the control ones), they had better results than the other half. The task was a rather easy one for them, which may explain why intelligible speech did not reduce their performance. This is in accordance with results obtained by Ellermeier and Zimmer [31]. In their study, the difference in errors between silence and a speech condition varied a lot between subjects. A second experiment conducted four weeks later showed a moderate stability of this individual susceptibility.
For the second half of the panel ("less-performing" participants), an increased intelligibility proved to be detrimental to the achievement of the task, as measured in previous studies. The maximum decrease in performance measured in this study (11.5 %, see figure 6), is highly consistent with existing results obtained with a similar task (see table 2 in [12] for a review). The steepest slope was located in the [0.35 – 0.45] range, which is also consistent with Hongisto's results [12]. But Hongisto's model presents a plateau for STI values greater than 0.6 while, in this study, this plateau occurred as soon as STI was equal to 0.45. On the other hand, this value is greater than the one (0.34) measured by Jahncke et al. [17]. The decrease in performance obtained at the plateau is also different between our study and the one of Jahncke et al. (5 % instead of 11.5 % in the current study).
Another difference is that small STI values were already detrimental for subjects in group 1: when STI = 0.25, the decrease in performance was significantly positive, and was approximately half of the maximum value. So it can be said that even a poor intelligible speech can decrease the performance of such highly sensitive subjects. This may strengthen the technical requirements of acoustical improvements in open plan offices, as it may be useful to ensure that speech intelligibility is as low as possible.
It would be interesting to identify determinants for these individual differences. Extroversion, or overall noise sensitivity, are potential candidates, though Ellermeier and Zimmer [31] measured a weak relationship between noise sensitivity and performance.
Beside objective measurement, the assessment of task difficulty proved to give useful and complementary results. Namely, best performing subjects related a greater difficulty in all noisy conditions, though their performance did not decrease.
However, the variations in speech intelligibility had a very small effect on RTLX measurements. This measure is less sensitive than objective assessment. This conclusion holds for the seriation task used in this study only. For other less elementary activities, such as those actually performed in real offices, using the NASA-TLX questionnaire would be of great practical interest.
11
Acknowledgements
This work was conducted in the framework of the LabEx CeLyA ("Centre Lyonnais d'Acoustique", ANR-10-LABX-60).
Bibliography
1. Brookes M, Kaplan A. The office environment: space planning and affective behavior. Human Factors: The Journal of the Human Factors and Ergonomics Society 1972; 14: 373-391.
2. Boyce P. Users' assessment of a landscaped office. Journal of Architectural Research 1974; 3: 44-62.
3. Sundstrom E, Burt R, Kamp D. Privacy at work: Architectural correlates of job
satisfaction and job performance. Academy of Management Journal 1980; 23:
101-117.
4. Hedge A. The open-plan office: A systematic investigation of employee reactions to
their work environment. Environment and Behavior 1982; 14: 519-542.
5. Zalesny M, Farace R. Traditional versus open-plan offices: A comparison of
sociotechnical, social relations, and symbolic meaning perspectives. Academy of
Management Journal 1987; 30: 240-259.
6. Nemecek J, Grandjean E. Noise in landscaped offices. Applied Ergonomics 1973; 4: 19-22.
7. Jensen K, Arens E, Zagreus L. Acoustical quality in office workstations, as assessed
by occupant surveys, in Indoor Air 2005, The 10th International Conference on Indoor Air Quality and Climate. 2005: Beijing, China.
8. Banbury S, Macken W, Tremblay S, Jones D. Auditory distraction and short-term
memory: Phenomena and practical implications. Human Factors: The Journal of the
Human Factors and Ergonomics Society 2001; 43: 12-29.
9. Ellermeier W, Hellbrück J. Is level irrelevant in "irelevant speech" ? Effects of
loudness, signal-to-noise ratio, and binaural unmasking. Journal of Experimental
Psychology: Human Perception and Performance 1998; 24: 1406-1414.
10. Schlittmeier S, Hellbrück J, Thaden R, Vorländer M. The impact of background
speech varying in intelligibility: Effects on cognitive performance and perceived disturbance. Ergonomics 2008; 51: 719-736.
11. Jones D, Alford D, Macken W, Banbury S, Tremblay S. Interference from degraded
auditory stimuli: Linear effects of changing-state in the irrelevant sequence. Journal of
the Acoustical Society of America 2000; 108: 1082-1088.
12. Hongisto V. A model predicting the effect of speech of varying intelligibility on work
performance. Indoor Air 2005; 15: 458-468.
13. Virjonen P, Keränen J., Hongisto V. Determination of acoustical conditions in
open-plan offices: Proposal of new measurement method and target values. Acta Acustica
united with Acustica 2009; 95: 279-290.
14. ISO 3382-3 (2012), Acoustics - Measurement of room acoustic parameters - Part 3:
Open plan offices. 2012, International Organization for Standardization.
15. Liebl A, Hawighorst M, Drotleff H, Leistner M, Wack R. The relationship between
the Speech Transmission Index and measures of cognitive performance, in Forum Acusticum. 2011: Aalborg, Denmark. p. 1631-1636.
12
16. Haka M, Haapakangas A, Keränen J, Hakala J, Keskinen E, Hongisto V. Performance
effects and subjective disturbance of speech in acoustically different office types - a laboratory experiment. Indoor Air 2009; 19: 454-467.
17. Jahncke H, Hongisto V, Virjonen P. Cognitive preformance during irrelevant speech:
effects of speech intelligiblity and office-task characteristics. Applied Acoustics 2013;
74: 307-316.
18. Guski R, Felscher-Suhr U, Schuemer R., The concept of noise annoyance: How
international experts see it. Journal of Sound and Vibration 1999; 223: 513-527.
19. Haapakangas A, Kankunnen E, Hongisto V, Virjonen P, Oliva D, Keskinen E. Effects
of five speech masking sounds on performance and acoustic satisfaction. Implications for open-plan offices. Acta Acustica united with Acustica 2011; 97: 641-655.
20. NASA, NASA Task Load Index (TLX) v1.0 Manual. 1986, NASA.
21. Hart S. NASA-Task Load Index (NASA-TLX); 20 years later, in The Human Factors
and Ergonomics Society 50th Annual Meeting. 2006: Santa Monica, USA. p. 904-908.
22. Byers J., Bittner A, Hill S. Traditional and raw Task Load Index (TLX) correlations:
Are paired comparisons necessary?, in Advances in Industrial Ergonomics and Safety,
A. Mital, Editor. 1989, Taylor & Francis: London. p. 481-485.
23. http://www.college-nat-audio.fr/boutique_cd-audiometrie-vocale.html. As seen on March 2014.
24. Hongisto V, Keranen J, Larm P., Simple model for the acoustical design of open-plan
offices. Acta Acustica united with Acustica 2004; 90: 481-495.
25. IEC 60268-16 (2003), Sound system equipment - Part 16: Objective rating of speech
intelligibility by speech transmission index. 2003, International Electrotechnical
Commision.
26. Warnock, A. C. C., Chu, W. T. Voice and background levels measured in open offices. IRC Internal Report, National Research Council, Canada, 2002.
27. Bradley, J. S., Gover, B. N. Criteria for acoustic comfort in open-plan offices. Inter-noise 2004: The 33rd International Congress and Exposition on Noise Control Engineering. Prague, 1-6, 2004.
28. Landström U., Söderberg L., Kjellberg A., Nordström B. Annoyance and performance
effects of nearby speech. Acta Acustica united with Acustica 2002; 88: 549-553.
29. Schlittmeier S, Asffalg S, Hofmann M. Does the coherence of background speech
contribute to its detrimental impact on cognitive performance ? Proc. Forum
Acusticum 2011, Aalborg (Denmark).
30. Jones D, Miles C, Page J. Disruption of proofreading by irrelevant speech : effects of
attention, arousal or memory ? Applied Cognitive Psychology 1990;4: 89-108.
31. Ellermeier W. Zimmer K., Individual differences in susceptibility to the "irrelevant
![Figure 1: Decrease in performance as a function of STI as proposed by Hongisto [12], together with data from four studies](https://thumb-eu.123doks.com/thumbv2/123doknet/14381958.506427/3.892.307.634.637.1002/figure-decrease-performance-function-sti-proposed-hongisto-studies.webp)