Congestion Pricing for Air Pollution
Reduction-Environmental Evaluation of
Pollution-Adjusted-Rate Pricing and Comparison with
Other Strategies
by
Masahiro Nishimura
M.Eng., Nagoya University, Japan (1992)
B.Eng., Nagoya University, Japan (1990)
Submitted to the Department of Urban Studies and Planning
in partial fulfillment of the requirements for the degree of
Master in City Planning
at the
MASSACHUSETTS INSTITUTE OF TECHNOLOGY
May 1996
@
Masahiro Nishimura, MCMXCVI. All rights reserved.
The author hereby grants to MIT. permission to reproduce and distribute publicly
paper and electronic copies of this thesis document in whole or in part, and to grant
others the right to do so.
A uthor...
Certified by ...
...
Department of Urban Studies and Planning
May 23, 1996
.... .... ... .... .... ..
N.
... ..
Joseph M. Sussman
JR East Professor of Civil and Environmental Engineering
/V,
,
Thesis Supervisor
Accepted by... MASSACG TTS INSTTE ECHNOLOGYJUL 0
21996
Rotetl
J. Mark Schuster
Chairman, MCP Committee
UBRARIESCongestion Pricing for Air Pollution Reduction-Environmental
Evaluation of Pollution-Adjusted-Rate Pricing and Comparison with
Other Strategies
by
Masahiro Nishimura
Submitted to the Department of Urban Studies and Planning on May 23, 1996, in partial fulfillment of the
requirements for the degree of Master in City Planning
Abstract
Congestion pricing is expected to have a positive impact on air pollution since it reduces traffic congestion, which is a significant cause of air pollution in most urban areas. This study investigates the impact of congestion pricing on emissions of hydrocarbon (HC), carbon monoxide (CO), and oxides of nitrogen (NO,) through a macroscopic simulation.
Reviews of the theory and current developments of congestion pricing are described. Although practical implementation has been limited to a small number of cities, economic theory and sup-porting toll-collection technologies have been well developed. The impact of road transportation on
air pollution is then described.
As the main objective of congestion pricing is to reduce the level of congestion, air pollution reduction is usually considered as a byproduct. However, greater air pollution reduction is possible if the pricing scheme is modified to include air pollution reduction as another main objective. Such a pricing scheme, named "pollution-adjusted-rate congestion pricing", is proposed in this study. This pricing scheme forces "dirty" vehicles out of congestion by charging higher amounts of tolls on them. The air pollution effects of congestion pricing and other policies, such as reducing numbers of old vehicles, reducing the overall demand, and introducing zero-emission vehicles (ZEV), are simulated. The computer model used in the simulation employs a constant elasticity named "avoidance elastic-ity" and a probability function named "willingness-to-shift function" to simulate users' time-shifting behavior, which is not negligible in the case of congestion pricing.
The simulation results show the positive effects of congestion pricing policies on air pollution reduction; in particular, they show that pollution-adjusted-rate pricing achieves greater reduction compared to ordinary congestion pricing.
The simulation model can be used in the initial stages of the planning process as a preliminary means of evaluating a congestion pricing policy.
Thesis Supervisor: Joseph M. Sussman
Title: JR East Professor of Civil and Environmental Engineering
Thesis Reader: Ralph Gakenheimer
After adding his signature to this thesis, Prof. Sussman, the thesis supervisor, drew a figure as shown below and said, "This is what your progress curve has to be like (the straight line), and yours was something like this (the bottom curve)."
As this comment illustrates, my slow progress at the beginning caused a big hustle at the end. First of all, I would like to thank Prof. Sussman for his valuable comments and advice despite the hustle. His cordial smile and severe comments worked as carrots and sticks to motivate a lazy person like me to work on this thesis. There is no doubt that I would have had to waste the deposit for the commencement gown rental without his patience and appropriate guidance.
The same is true of the thesis reader, Prof. Gakenheimer. He gave me well-directed advice, and I often appreciated his prompt responses when he went through my drafts.
My friends at MIT and other schools have contributed in both the slow progress at the beginning and the rapid progress towards the end. I could not have survived in the environment full of genius and hard-working people without their support. I appreciate all the people who played tennis, volleyball and other sports with me and who spent their time with me for their friendship.
One thing I tend to forget but thank the most is the financial support from the Japanese gov-ernment. My study at MIT has been sponsored by the Ministry of Construction and the National Personnel Authority.
One more thing I often take for granted and tend to forget to be thankful to is the support from my parents and sister. As my sponsor did not allow me to go back to my home country during the two-year stay in the United States, they visited me last summer and brought me great encouragement. Now, I wish my sister for a happy marriage as she is getting married in September. Reflecting this invaluable experience, I hope, in the future, to become able to get things done, as Prof. Sussman pointed out, following the straight line in the figure below.
Contents
1 Introduction 17
1.1 What is congestion pricing? . . . . 17
1.2 Idea of Pollution-Adjusted-Rate Congestion Pricing. . . . . . . . . 18
1.3 Thesis Overview . . . . 18 2 Congestion Pricing 21 2.1 Overview... . . . . . . . 21 2.2 Pricing Theory . . . . 22 2.2.1 Mechanism of Congestion.. . . . . . . . 23 2.2.2 Congestion Cost.. . . . . . . . 26
2.2.3 Marginal Cost Pricing... . . . . . . . . . . . . 27
2.3 Pricing Options.. . . . . . . . 28
2.3.1 Technical Options . . . . 29
2.3.2 Operational Design Options . . . . 31
2.4 Experience and Current Movements . . . . 31
2.4.1 The Case of Singapore.. . . . . . . . 31
2.4.2 The Case of Hong Kong . . . . 36
2.4.3 The Case of Japan . . . . 41
2.4.4 The Case of Europe . . . . 43
2.4.5 The Case of the United States . . . . 44
2.5 Implementation Difficulties. . . . .. 49
2.5.1 General Acceptance.... . . . . . . . 49
2.5.2 Distribution of Benefits and Costs... . . . .. 50
2.5.3 P rivacy . . . . 51
2.5.4 Sum m ary . . . . 52
3 Road Transportation and Air Pollution 53 3.1 Overview... . . . . . . . . 53
3.2.2 The Amount of External Costs . . . . 3.3 Air Pollution Impact of Road Transportation . . . . . 3.3.1 Transportation-Related Pollutants. . . . .. 3.4 Estimation of Vehicle Emissions . . . .
3.4.1 Determination of Emission Rates-The Federal 3.4.2 The EPA Models . . . . 3.5 Environmental Policies for Air Pollution Reduction . . 3.5.1 Characteristics of the Problems . . . . 3.5.2 Vehicle Emission Standards . . . . 3.5.3 Fuel Standards . . . . 3.6 Transportation Policies for Air Pollution Reduction .
3.6.1 Limits of Road Infrastructure Development . 3.6.2 Transportation Demand Management (TDM) 3.7 Sum m ary . . . . 4 Pollution-Adjusted-Rate Congestion Pricing
4.1 Idea and Concept . . . . 4.2 Pricing Theory . . . . 4.3 Application and Possibilities . . . . 5 Policy Simulations
5.1 O verview . . . . 5.2 Simulation Framework . . . . 5.2.1 Basic Assumptions . . . . 5.2.2 Simulated Policies . . . . 5.3 Pricing Model Structure. . . . . . . . ..
5.3.1 Direct Price Elasticity . . . . 5.3.2 "Avoidance Elasticity" and "Willingness-to-Shift" 5.4 Simulation Results and Analyses. . . . ...
5.4.1 Base Case Emissions . . . . 5.4.2 Emission Reductions of Each Policy . . . . 5.4.3 "Iso-impact" Lines of Emission Reductions . . . . 5.5 Limitations of the Results . . . ....
. . . . 5 6 .. . . . . . . . 5 7 . . . . 5 7 . . . . .- . . . . 6 1 Test Procedure . . . . 61 . . . . 6 1 . . . . 6 5 . . . . 6 5 . . . . 6 6 . . . . 6 7 . . . . 6 9 . . . . 6 9 . . . . 7 0 . . . . 7 2 75 . . . . 75 . . . . 76 . . . . 78 81 Mod . . . . 8 1 . . . . 8 1 .. . . . . . 82 . . . . 8 4 . . . . 8 5 . . . . 8 5 eling . . . . 87 . . . . 9 5 . . . . 9 5 . . . . 9 5 . . . 106 . . . 109 5.6 Summary . . . .. . . . .1 109
6 Findings and Policy Implications 111
6.1 Overview ... ... ... 111
6.2 M odeling Issues ... ... 111
6.3 Crosscutting Issues ... ... 112
6.4 Findings for Each Congestion Pricing Policy . . . 113
6.4.1 Ordinary Congestion Pricing . . . 113
6.4.2 Pollution-Adjusted-Rate Congestion Pricing . . . 114
6.5 Concluding Rem arks . . . . 115
A Characteristics of Pollutants 117 A.1 Carbon Monoxide (CO) . . . .. . . . . . .. 117
A.2 Nitrogen Dioxide (NO2) . . . .. . . .. . . . . . - - - . .. . . . . .. 117
List of Figures
2-1 Representative speed-volume-density curves... . . . . . . . . 2-2 Simulated travel time-flow relationship, Don Mills Road S., Toronto . . . . 2-3 Cost functions of congestion... . . . . 2-4 O ptim al tolls . . . . 2-5 Electronic toll collection (ETC)... . . . . 2-6 Restricted zone for the Singapore's ALS... . . . . 2-7 Variations in hourly traffic volumes entering and leaving the restricted zone (February
1990)... ... .. .... ... ... . . ... 2-8 Variations in modal split of work trips to the restricted zone . . . ... 2-9 Schematic illustration of Hong Kong's electronic road pricing (ERP) system . . . . . 2-10 The cordon schemes tested in Hong Kong . . . . 2-11 Toll roads in Japan... . . . .
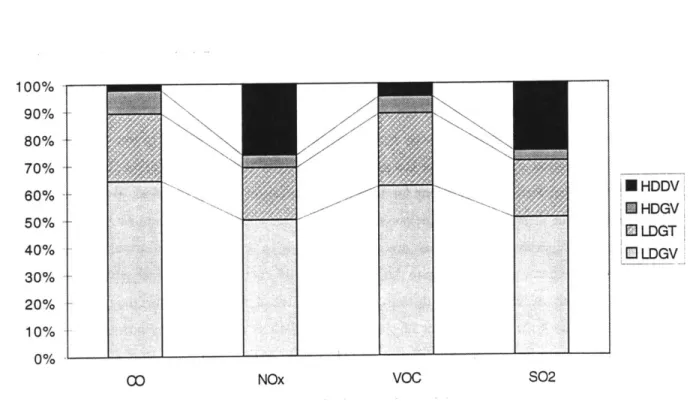
3-1 External costs associated with road tra 3-2 Emission trends . . . . 3-3 Combustion emissions as a function of 3-4 Emission shares of four vehicle types .
Speed correction factors for LDGV (mo Lead emission trend . . . . The growing importance of trips in aut The concept of transportation demand
nsportation... . . . . . . . 56
. . . . 59
peak combustion temperatures... . . . . . 60
. . . . 60
del year 1995) . . . . 64
. . . . 68
o em issions . . . . 70
management (TDM) . . . . 71
Air pollution costs.. . . . . . . .. Optimal tolls to internalize air pollution costs . . . . Optimal tolls for a typical volume variation... . . .. Discrete pricing scheme for "dirty" and "clean" vehicles . Simulation framework . . . . Base-case traffic volumes . . . . . . . 77 77 78 . . . 78 3-5 3-6 3-7 3-8 4-1 4-2 4-3 4-4 5-1 5-2
5-5 5-6 5-7 5-8 5-9 5-10 5-11 5-12 5-13 5-14 5-15 5-16 5-17 5-18 5-19 5-20 5-21 5-22 5-23 5-24 5-25 5-26 5-27 5-28 5-29
Travel speed before and after pollution-adjusted-rate congestion pricing Emission reductions under pollution-adjusted-rate congestion pricing . . Emission reductions under early retirement policy . . . . Traffic volume before and after demand reduction policy . . . . Travel speed before and after demand reduction policy . . . . Emission reductions under demand reduction policy . . . . Emission reductions under ZEV introduction . . . . Iso-impact lines for HC emission reductions . . . . Iso-impact lines for CO emission reductions . . . . Iso-impact lines for NO, emission reductions . . . . Avoidance elasticity... . . . . . . . . . . .. Time shift of those who consider avoiding the toll . . . .. Probability density function for the amount of time-shifting . . . .. Cumulative density function for the amount of time-shifting . . . . Willingness-to-shift function . . . . Time-shifting simulation (time of day-volume) . . . . Time-shifting simulation (willingness-to-shift) . . . . Mode (or route) change of users unable to shift time . . . . HC emissions for the base case . . . . CO emissions for the base case . . . . NO_ emissions for the base case . . . . Traffic volume before and after ordinary congestion pricing . . . . Travel speed before and after ordinary congestion pricing . . . . Emission reductions under ordinary congestion pricing . . . . Traffic volume before and after pollution-adjusted-rate congestion pricing
.. . . . .. 87 . . . . 88 . . . . 89 . . . . 90 . . . . 91 . . . . 91 . . . . 92 . . . . 93 . . . . 94 . . . . 96 . . . . 96 . . . . 97 . . . . 98 . . . . 98 . . . . 99 . . . . 100 . . . . 101 . . . 101 . . . . 103 . . . . 104 . . . . 104 . . . . 105 . . . 106 . . . . 107 . . . . 108 . . . . 108
List of Tables
2.1 Changes of ALS . . . . 33
2.2 Characteristics of cordon schemes. . . . . 39
2.3 Hours and the amount of tolls. . . . . 39
3.1 Total external costs of transportation in % of GDP. . . . . . . . 57
5.1 Simplified vehicle compositions . . . . 84
5.2 Toll levels and priced periods . . . 100
5.3 Vehicle composition of old vehicles . . . 102
Abbreviations
ALS Area Licensing Scheme
AVI Automatic Vehicle Identification BPR Bureau of Public Roads
CARB California Air Resources Board CBD Central Business District
CIF Cost, insurance, and freight CO Carbon monoxide
COE Certificate of Entitlement DOC Department of Commerce DOT Department of Transportation ENP Electronic number (license) plate EPA Environmental Protection Agency ERP Electronic Road Pricing
ETC Electronic Toll Collection
FHWA Federal Highway Administration FR Federal Register
FRT First registration tax
FTA Federal Transit Administration FTP Federal test procedure
GDP Gross Domestic Product HC Hydrocarbon
HDDT Heavy-duty diesel-powered trucks HDGV Heavy-duty gasoline-powered vehicles HK$ Hong Kong dollar
HOV High occupancy vehicles I&M Inspection and maintenance
ISTEA Intermodal Surface Transportation Efficiency Act ITS Intelligent Transportation Systems
LAX Los Angeles Airport
LDDT Light-duty diesel-powered trucks LDDV Light-duty diesel-powered vehicles LDGT Light-duty gasoline-powered trucks LDGV Light-duty gasoline-powered vehicles LEV Low Emission Vehicle
LOS Level of service MC Motorcycles mi Mile(s) (=1.6 km) mph Miles per hour (speed) MRT Mass Rapid Transit
MTC Metropolitan Transportation Commission NAAQS National Ambient Air Quality Standards NO2 Nitrogen dioxide
03 Ozone
OECD Organization for Economic Co-operation and Development Pb Lead
pcphpl Passenger cars per hour per lane (traffic volume) PM-10 Fine particulate matter less than 10 microns S$ Singapore dollar
SCF Speed Correction Factor SO2 Sulfur dioxide
SOV Single occupancy vehicles SR State Route
TDM Transportation Demand Management TRB Transportation Research Board TSP Total suspended particulate matter TTI Texas Transportation Institute
UMTA Urban Mass Transportation Administration VMT Vehicle miles traveled
VOC Volatile organic compounds vph Vehicles per hour (traffic volume) ZEV Zero Emission Vehicle
Chapter 1
Introduction
1.1
What is congestion pricing?
The Metropolitan Expressway in Tokyo is notorious for its heavy traffic, which lasts almost all day in some parts of the city. Drivers sometimes complain, "Since the expressway is no faster than untolled streets, toll charges should be refunded when it is heavily congested." Also, some people
say, "The expressway is so congested that nobody wants to use it."
The first statement is exactly the opposite to the concept of congestion pricing. According to the theory of congestion pricing, higher tolls should be charged when the road is heavily congested. What is the logic behind the theory?
If we look at the second complaint, we see that it implies that the negative effects of congestion-mainly time loss-impose disincentives to use the facility during congested periods. If these disin-centives are great enough and "nobody" uses the facility, there would not be any congestion and everybody would be happy all the time. Therefore, the existence of congestion suggests that this disincentive is not great enough to eliminate the problem.
Because the disincentive for drivers is not great enough to force them to avoid congested highways, congestion pricing must make up the difference when drivers make decisions about their trips. Drivers' decisions do not depend on "everybody's happiness", or social costs but on the driver's own happiness, or private costs that are significant only to him or her (internal costs). Therefore, by charging appropriate amounts of additional tolls during hours of congestion, one can achieve a situation in which people would say, "The toll is so expensive that only the appropriate number of people will want to use it."
1.2
Idea of Pollution-Adjusted-Rate Congestion Pricing
Saving road users' time on traveling is not the only benefit of congestion reductions. Air pollution reduction is also one of the benefits that congestion reductions bring about. As the primary goal of congestion pricing is congestion reduction, it is expected to produce some air pollution benefits as well.
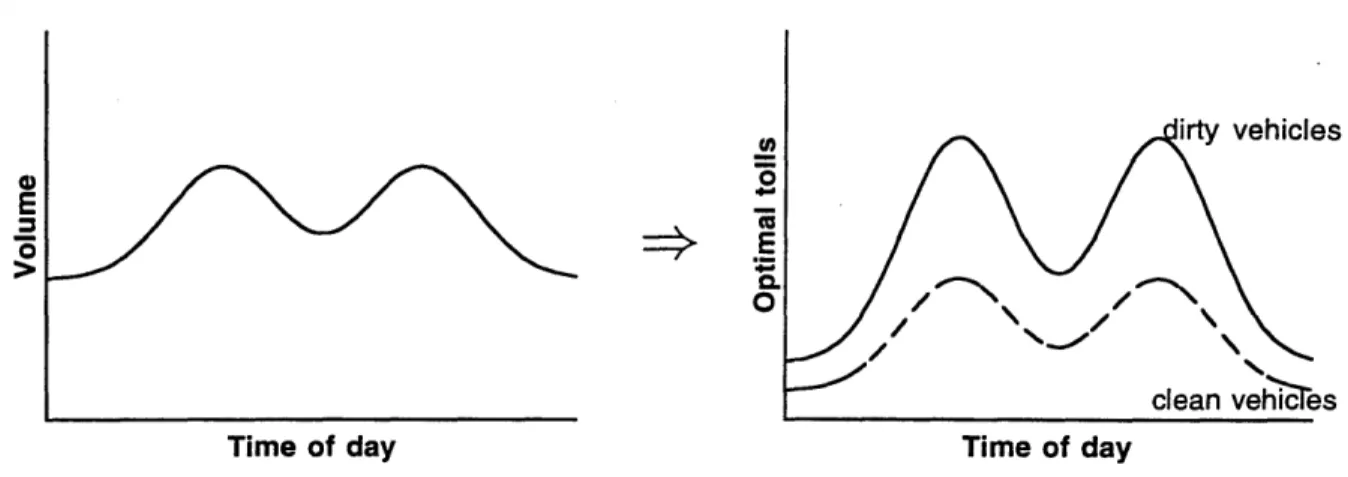
In this thesis, one form of congestion pricing scheme, named "pollution-adjusted-rate congestion pricing", will be proposed. This pricing scheme attempts to more actively reduce air pollution-not as a byproduct of congestion reduction-by charging different amounts of tolls depending on vehicles' pollution characteristics. "Dirty" vehicles, or vehicles with high levels of emissions, such as heavy-trucks and old vehicles, would be charged with higher tolls than "cleaner" vehicles during peak periods. Under this pricing scheme, emission reductions beyond the level that can be reached by ordinary congestion pricing could be achieved because it changes not only the peak characteristics of traffic volume but also the vehicle composition of peak and non-peak periods.
Although the overall emission reduction may bring a social benefit as a whole, a social benefit of each individual, or more specifically, of each income group, may not increase. An issue of equity-who are better-off or worse-off after the policy-would be one of the most serious concerns about this pricing scheme as dirty vehicles, especially old vehicles, are often owned by the poor. This issue will not be examined in detail in this thesis as it includes complex political issues like the use of revenues. However, it requires careful considerations when it is applied in practice.
Some of vehicle characteristics, such as vehicle age or fuel type, which have strong impact on emission levels may not be physically visible from outside, but it is necessary to be able to identify those characteristics at toll booths in order to charge different amounts depending on them. Un-like manually-operated toll booths, automatic vehicle identification (AVI) technology is capable of identifying those kind of information if they are stored in tags mounted on each vehicle. This tech-nology provides great opportunity for highly variable pricing schemes like pollution-adjusted-rate congestion pricing. Descriptions on AVI and related technologies will be given in Chapter 2.
1.3
Thesis Overview
In this thesis, the impact of congestion pricing policies on air pollution will be discussed. The idea of congestion pricing is not new, and its economic theory is well established. However, its practical application is limited to a small number of cities in the world, and its impact on air pollution is mostly unknown. The economic theory of congestion pricing and its applications will be explained in Chapter 2. Recent developments in toll collecting technologies and current movements in the United
1.3. THESIS OVERVIEW
States since the Intermodal Surface Transportation Efficiency Act (ISTEA) will then be introduced. Besides congestion, air pollution is another major source of externalities associated with road transportation. Chapter 3 will explain how road transportation is causing negative effects on the environment and how the government has dealt with its problem. Also, an emission estimate model to be used in the simulations in Chapter 5 will be introduced.
The primary goal of congestion pricing is to reduce congestion, and road users benefit from congestion reductions by saving their time on their trips. Congestion reductions also bring air pollution benefits, and the impact of congestion pricing on air pollution has been studied. Chapter 4 proposes a pricing scheme named "pollution-adjusted-rate congestion pricing", which is designed to more actively reduce air pollution by a pricing policy-not merely as a byproduct of congestion reductions. Under this pricing scheme, different amounts of tolls would be charged depending on the emission levels of vehicles, and additional emission reductions beyond the level achieved by ordinary congestion pricing schemes are expected to be achieved.
To compare the emission impacts of various policies described in previous chapters, a series of simulations will be run in Chapter 5; and emission reductions to be expected from the application of each policy will be presented. Also, the level of efforts, across various policies, required to achieve the same emission reduction levels will be presented as "iso-impact" lines.
Chapter 2
Congestion Pricing
2.1
Overview
Congestion pricing or peak-period fees is a widely accepted practice in many industries. People are accustomed to paying different prices for the same goods or services depending on when they are consumed. For example, long-distance phone calls are normally cheaper in the early morning than in busy work hours. Electricity is supplied at a lower rate during the night in most countries although the United States uses a flat or block rate price structure.
This type of demand-adjusted pricing is also used in the transportation industry. Airplane tickets are usually priced higher when the level of demand is high. In the United Kingdom, peak-period pricing has been introduced for airport runways although none of the airports in the United States have adopted such a pricing scheme[23]. Regarding transit, more than 30 transit systems in the United States have introduced time-of-day pricing in which adult fares vary by time on weekdays. These systems include a number of different transit modes such as bus, rapid rail, and dial-a van, and cities ranging in population from fewer than 25,000 to over 4 million[5, 6].
In this chapter, congestion pricing theory and applications in the field of road transportation will be reviewed. Although "pollution-adjusted-rate congestion pricing", which will be introduced in Chapter 4, will not be included in this chapter, some of the theory and technologies introduced in this chapter are directly applicable to it.
In spite of the limited number of practical application, the theory of congestion pricing in the field of road transportation has been well developed. A brief description of the economic theory will be given in Section 2.2.
more complex pricing schemes possible at a low cost. Technical developments and operational design options will be reviewed in Section 2.3.
Despite the promising economic theories and supporting technical developments, the application of congestion pricing to road transportation is limited to a small number of cities in the world. In the United States, the Congress created the Congestion Pricing Pilot Program in 1991 under the Intermodal Transportation Efficiency Act (ISTEA), and several pilot projects are underway. The experiences and current movements in the United States and other countries will be described in Section 2.4.
The main stumbling block for practical application of congestion pricing, so far, has been political concerns that charging drivers for using roads, previously untolled, would hamper the regional competitiveness in production, or put too heavy a burden on the poor. The difficulties of the introduction of congestion pricing will be discussed in Section 2.5.
2.2
Pricing Theory
The microeconomic theory of congestion pricing is well developed and straightforward once the cost of congestion and benefit of transportation are given. However, measuring the cost is not easy as it involves various internal and external cost elements1
. Two main cost elements this thesis deals with are congestion cost (the cost of time loss) and air pollution cost. They are both external costs to road users and not reflected on their trip decisions unless some measures are taken to internalize them.
Taxation is one of the measures that are taken to internalize external costs. In the case of congestion cost, however, as the cost varies considerably depending on the facility or the time of day, taxes that are charged uniformly regardless of the driving pattern of users do not help internalize the cost. Therefore, the concept of congestion pricing that charges higher tolls when the level of congestion is high is more appropriate to internalize the congestion cost.
Cost of air pollution is also related to the level of congestion as the slow and sometimes "stop-and-go" traffic causes higher emissions than smooth flows. Therefore, the concept of congestion pricing is also applicable, and this will be further discussed in Chapter 4.
In this section, cost functions for congestion costs will be introduced as functions of traffic volume, which indicates the level of congestion. Then, the optimal toll for internalizing the congestion cost will be derived following the concept of marginal cost pricing.
2.2. PRICING THEORY
2.2.1
Mechanism of Congestion
In this thesis, flow congestion on a major highway without traffic signals is analyzed for the sake of simplicity. When many vehicles enter the highway simultaneously, the resulting high density D (number of vehicles per unit distance) reduces average vehicle speed S. The volume or flow V (number of vehicles passing a given point per unit time) may either rise or fall as density increases. These three variables have the following relationship:
V=DS (2.1)
Given Equation 2.1, the relationships among the three variables D, S, and V can be determined once the relationship between any two of the three is determined.
The relationship between V and D has the general shape shown in Figure 2-1-a. Using Equa-tion 2.1, the relaEqua-tionships between S and D and between S and V can be expressed as shown in Figures 2-1-b and 2-1-c, respectively2[49].
These relationships are instantaneous ones and defined over a very small region of time and space. In order to apply them to an economic analysis of a highway or a network, not only the number of vehicles passing through a certain point but also the number of vehicles attempting to enter at various points should be considered.
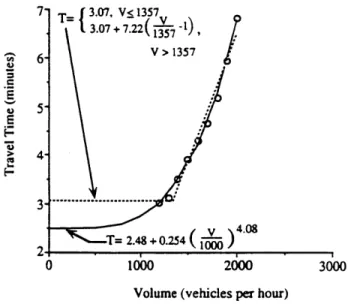
Several computer simulations have been run to analyze the effect of congestion on drivers' de-cision to enter a highway. Dewees (1978) simulated a ten-square-mile suburban road network in metropolitan Toronto and generated nine data points relating average travel time per mile to the entering traffic flow, holding flows on all other streets constant. Using these data, Small (1992)
shows two widely used speed-flow functions (Figure 2-2)[49]. The first is a simple power function (solid line in Figure 2-2):
1 (V k
- = TO + T1 - (2.2)
S C,
where To, T1, and k are parameters, and C, is practical capacity defined as, "the maximum number
of vehicles that can pass a given point on a roadway or in a designated lane during one hour without the traffic density being so great as to cause unreasonable delay, hazard, or restriction to the driver's freedom to manoeuvre under prevailing roadway and traffic conditions" [56]. This measure of capacity is equivalent to the "maximum volume at service level E3" of the Highway Capacity Manual[56].
2
Vehicles of different sizes or acceleration capabilities are converted to equivalent numbers of passenger cars in these relationships.
3
The Highway Capacity Manual of 1992 defines the level of service (LOS) through A to F depending on the density of a road. LOS E is defined as a density greater than 32 passenger cars/mile/lane within the stable-flow range(up to the maximum flow)[56].
Dmax D a. Volume-Density S So b. Speed-Density Vmax V c. Speed-Volume
Figure 2-1: Representative speed-volume-density curves V
Vmax
2.2. PRICING THEORY 25
The Bureau of Public Roads suggests values of 0.15 and 4 for TI/To and k, respectively [11]. Dowling and Skabardonis (1992) propose T1
/To
= 1 and k = 4,10 and show they provide good fits to theHighway Capacity Manual curve[13]. The estimates for the data points in Figure 2-2 were 0.10 and 4.08 for TI/To and k.
Steenbrink (1974) used a steady state capacity C, instead of C, and suggested the values of 2.62 and 5 for T1/To and k[51]. The steady state capacity is defined as "the maximum steady-state flow on a link, i.e. the capacity of the point providing poorest service on that link" [4].
The second function is a piecewise-linear one (dotted line in Figure 2-2):
1 T if V < Vk
S TO+T 1 ( -1) ifV>Vk
(2.3)
This function is derived by Small (1983) to express the average travel time over a peak period of fixed duration[48]. Vk is a capacity parameter related to highway investment and not necessarily equal to C, or C,.
{3.07,
VS 1357 3.07 + 7.22( 1-51), V > 1357 0 1000 4.08 2000 3000Volume (vehicles per hour)
Figure 2-2: Simulated travel time-flow relationship, Don Mills Road S., Toronto
Source: Small (1992)[49]
Unlike the instantaneous relationships shown in Figure 2-1, these two functions capture some of the dynamic interaction crucial to highway congestion. Since they quantify the volume of traffic attempting to use the highway (demand), they can be used to analyze situations where demand
exceeds capacity, which do not appear in the instantaneous relationship in Figures 2-1-a and 2-1-b4.
In the analysis of road pricing, not the instantaneous relationships but the relationship between the demand and supply is required.
2.2.2
Congestion Cost
The relationship between travel time and flow-capacity ratio V/C (V/C,, V/C, or V/Vk) described in the previous section can be extended to relate the flow-capacity ratio to the cost of travel time. This generalized5 cost of travel time c can be divided into the cost on an uncongested road co and the additional cost caused by congestion c9 (congestion cost).
c(V, C) = co + c9(V, C) = co + f(V/C) (2.4)
Using the two travel time functions described in Section 2.2.1, the congestion cost c9 can also be expressed in the following two forms.
Power function:
cg(V,C)
=c2
(V)
(2.5)
Piecewise linear function:
W,0 if V < Vk
c(V,V ) = {O~v (2.6)
c2(-L-1) if V>Vk
These cost functions are shown in Figure 2-3 with the solid lines. These functions denote average cost per user in the sense that they are shared by all the users in volume V. The marginal cost (MC), defined as the additional cost of adding another user to volume V, can be derived as follows:
d(V -AC) d(AC)
MC = V -AC+V. - (2.7)
dV dV
where AC is the average cost. Using Equation 2.7, two forms of the average cost functions (Equa-tions 2.5 and 2.6) can be transformed into marginal cost func(Equa-tions.
Power function:
MC(V,C) = c
2(k
+
1)
(-)
(2.8)
4
The flow (V) does not exceed its capacity (Vm) in these figures, while the demand could exceed the capacity determined by the service level.5
The term "generalized" is used because this cost is not what road users pay directly but only what can be measured through the subjective value of time.
2.2. PRICING THEORY
Piecewise linear function:
0 if V Vk
(2.9)
MC9(VV ) ={~(29
c2 [2 -1] if V > Vk
The marginal cost curves are shown in Figure 2-3 with the dotted lines.
4) > slope=2*c2/Vk
aoco+
---
AC
CAC k*c2 c2 00AC
slope=c2/Vk
... 2 cccoi
V
-% V VkVolume
Cp
Volume
a. Power function b. Piecewise linear function Figure 2-3: Cost functions of congestion
Source: Small (1992)[49]
2.2.3
Marginal Cost Pricing
A driver's decision before taking a trip is not based on the marginal cost of his own trip but on the average cost over all the users including himself. Suppose there is a highway already congested with volume V and a driver is thinking of entering the highway. The marginal cost of his trip, the aggregate additional cost associated with his entry, would be higher than the average cost that the drivers of volume V perceive. It was derived mathematically in Equation 2.7 and illustrated in Figure 2-3. However, the driver does not consider the marginal cost of his trip when he makes his trip decision, but instead his trip decision is based on the average cost. After all, every driver makes his trip decision based not on the marginal cost but on the average cost of his trip.
In microeconomic theory, maximum efficiency is achieved when the marginal cost is equal to the marginal benefit, or the demand. Producers do not have an incentive to increase production because an additional unit of production would bring more cost than revenue. However, since the marginal cost is not usually perceived by users in road transportation, the equilibrium in the transportation
market lies beyond the efficient level of quantity and is obtained where the average cost equals the demand. Assuming a typical shape of the demand function, the graphical representation of the equilibrium point is given as (V, ACo) in Figure 2-4. The maximum level of economic efficiency is achieved at the volume V1, where the marginal cost curve intersects with the demand curve. This
optimal level can be achieved if the difference between the marginal cost and the average cost is charged to users. The optimal toll r for the two function forms is given in the following forms.
Power function:
- = c2 k v)k (2.10)
Piecewise linear function:
0 if V < V
r
j
undefined
if V = V(2.11)
C2 ( ) 1] if V > Vk
For the piecewise linear function, the toll becomes undefined in terms of V if V = Vk. As illustrated in Figure 2-4-b, the optimal congestion fee is the fee that holds the demand just at the capacity.
0 AC 00 AC opt toC AC ---- --- Co- ' -ACo - - - -~ -- - - D D co (=AC1 Volume V1 Vo V Volume Vk Vo V (=V1)
a. Power function b. Piecewise linear function
Figure 2-4: Optimal tolls
Source: Small (1992)[49]
2.3
Pricing Options
In practice, several technical and operational options are available for ways to collect tolls from users. In this section, various options both in technologies of toll collection systems and operational
2.3. PRICING OPTIONS
designs will be reviewed.
2.3.1
Technical Options
The key technology for congestion pricing is electronic toll collection (ETC). ETC is based on automatic vehicle identification (AVI), a functional area of Intelligent Transportation Systems (ITS). ETC allows the payment of tolls without making vehicles stop by identifying in-vehicle transponders with roadside detectors. This is a great advantage especially to a congestion pricing project aiming at environmental improvements since the vehicles would not emit additional pollutants or use additional energy at toll booths by stopping and accelerating. ETC is already used on some toll roads in the United States and abroad6 and has already been proved to be highly reliable. According to Pietrzyk (1994)[46], "Existing technology has been known to operate in the 93 to 98% reliability range while most vendors claim that the reliability of new technology to be introduced is in the range of 99.95 to 99.99%".
Basic Structure of ETC
An ETC system consists of vehicles with in-vehicle transponders (identification tags), a two-way microwave link, a roadside reader, and a central computer system (Figure 2-5).
The in-vehicle transponders (identification tags or IC cards) store the information needed for toll transactions, such as vehicle type, account ID, balance, etc. The road side reader transmits and receives information from the transponders, identifies the vehicle, and conducts the transaction. The central computer system is used to access account information and process the transaction requests.
Technical Systems and Accounting/Debiting Methods
Depending on the capabilities of in-vehicle transponders, ETC systems can be grouped into several categories. Generally, the less transponders are capable of processing data, the less each user has to pay to participate, but at the same time, the central system is required to shoulder more complex tasks.
The simplest type of transponder is called read-only, or one-way. The transponder only receives information from the roadside detector. Therefore, all the transactions are made at the central computer, which is operated by a central authority. Users have their accounts in the central operating authority and tolls are debited from them. The central agency is able to keep track of virtually every transaction made by users. An issue of privacy is often raised due to this characteristic of the simplest
6
Identification Tag Reader ._
Central _
Computer
Figure 2-5: Electronic toll collection (ETC)
Source: TRB (1994)[57]
ETC system. However, this read-only system is known to have the highest technical reliability and require the lowest installation cost on the users. Thus, the implementation is relatively easy.
The more complex type of transponders are capable of recording some information sent from roadside detectors. These are called read/write systems. The simplest type of read/write transpon-ders can only receive the transaction logs so that users can keep track of transactions every time they are made. This has the same problem of privacy as the simplest read-only transponders do since the transactions are still made at the central computer.
In order to avoid the privacy issue completely, transactions should be made on the vehicles. Therefore, transponders must have transaction capabilities. The smart card metering system, which undertake transactions directly on user-held cards, fits in this category. In this system, users can buy cards anonymously at shops or government offices, and fees are debited from those pre-paid cards every time their vehicles pass toll collection points. It is also possible to extend the use of cards to public transit fares.
Applications to Complex Pricing Schemes
The technological developments in ETC systems provide opportunities for applications of more com-plex pricing schemes like the "pollution-adjusted-rate" congestion pricing, which will be described in Chapter 4. As this pricing scheme requires vehicles to be charged with different amounts of tolls
2.4. EXPERIENCE AND CURRENT MOVEMENTS
depending on their emission characteristics and time of day, manual collections are quite difficult in practice. However, if each vehicle is mounted with a tag to which information on the vehicle's emission characteristics is input, variable charges can be collected from the vehicles automatically.
2.3.2
Operational Design Options
Operation of congestion pricing could take several forms depending on the geographic area covered and types of facility included. In practice, congestion pricing is categorized in six basic forms[57]:
" Point pricing
Users passing a point at a specific time are charged fees for passing that point regardless of the distance traveled on a specific route.
* Cordon pricing
Users wishing to enter a congested area are charged fees at each entry point into the area.
" Zone pricing
Users traveling within a cordoned area also pay fees.
" Higher charges for parking in congested areas
This puts particular emphasis on parkers traveling during the most congested period.
" Charges for distance traveled
Users traveling within a congested area or on a congested route are charged based on the distances they travel.
" Congestion-specific charges
Users would be charged for both time spent and distance traveled.
The choice of these options should depend on goals of congestion mitigation level and the charac-teristics of current congestion problems, transportation systems and users, and institutional frame-work. They also require different costs and efforts for implementation and operation, and generated revenues also vary.
2.4
Experience and Current Movements
2.4.1
The Case of Singapore
Singapore has implemented unique transportation policies since the successful introduction of the Area Licensing Scheme (ALS) in 1975. The ALS is virtually the only working congestion pricing
scheme of this scale in the world and is often cited as an effective means of transportation demand management. With the recent advances in smart card and communication technologies, the gov-ernment has decided to fully automate the system. This is going to be a leading application of an Electronic Toll Collection (ETC) system; it is planned to be implemented by 1997.
The Singapore government has been attempting to solve the congestion problem by using demand management policies heavily depending on fiscal and monetary disincentives. Along with the ALS, the Certificate of Entitlement (COE) system, which mandates a person to purchase a certificate before buying a car, has proven to be effective to discourage the auto ownership.
The Area Licensing Scheme (ALS)
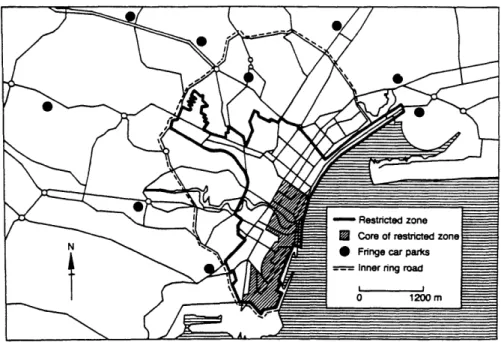
The ALS was introduced in June 1975 to discourage the widespread use of private cars for commuting purposes by imposing restrictions between 7:30 a.m. and 9:30 a.m. on entering a cordoned area of the Central Business District, called the "restricted zone" (See Figure 2-6). The system was operated by manual supervision at various entry points into the restricted zone. A city shuttle bus service was inaugurated with 15 fringe car parks built to encourage park-and-ride for those traveling into the restricted zone. Parking fees inside the restriction zone were raised in May 1975. Soon after the introduction of the ALS, the total number of motor vehicles entering the restricted zone had dropped significantly, but there was still a heavy concentration of traffic after the restriction times[34].
The pricing control was only applied during the morning peak hours and to private cars and taxis in the original scheme. This objective was revised in June 1989 to the use of ALS as a traffic management tool to curtail congestion. The new scheme was to charge vehicles for the use of road space at times and in places when and where they cause congestion. Hence, the restriction was extended to the evening peak hours and to include goods vehicle, non-scheduled bus, and motorcycle. From January 1994, the ALS was further extended. The area covered was increased, and the restrictions became effective all day. The four-passenger rule for cars exempted from the ALS fee was abandoned because drivers were ingeniously borrowing passengers to pass the gantry points. Table 2.1 shows how the system has changed over the past two decades of operation.
Effects on Transportation Systems
The most significant effect of the ALS is the reduction of traffic both into and out of the restricted zone during the restricted hours. When the original ALS was implemented in 1975, the inbound traffic entering the restricted zone during the restricted hours dropped 44% from about 74,000 to 41,500 vehicles (all classes). Since goods vehicles were not restricted under the original ALS, the number of those vehicles entering the restricted zone increased, and the inbound traffic climbed back
2.4. EXPERIENCE AND CURRENT MOVEMENTS
Table 2.1: Changes of ALS
Sources: Menon, Lam, and Fan (1993) and Low (1995) [39, 34]
Original ALS(1975-) Revised ALS (1989-) Revised ALS (1994-) Objective Manage the Congestion Pricing Congestion Pricing
widespread use of private cars
Restricted Zone 610 ha in 1975; 725 ha (More than 725 ha) (Area) increased to 710 ha
after 1986
Restricted Hours 7:30-10:15 a.m. 7:30-10:15 a.m. All day 4:30-6:30 p.m.
Restricted Vehicles Private car, company Private car, company All vehicle (private car, and taxi car, taxi, goods and public)
vehicle, non-scheduled bus, and motorcycle
Daily ALS Fees S$2 for taxi; S$5 for S$3 for car, taxi, S$3 from 7:30 a.m. private car; and S$10 goods vehicle, and to 6:30 p.m.
for company car non-scheduled bus; S$2 from 10:15 a.m. (cars owned by S$1 for motorcycle; to 4:30 p.m.
companies for and S$6 for company business purpose) car
Figure 2-6: Restricted zone for the Singapore's ALS
Source: Lewis (1993)[33]
to nearly 60,000 vehicles in 1985. However, the total inbound traffic during the restricted hours had been capped at below 70% of the pre-ALS level although employment in the restricted zone had grown by 30% between 1975 and 1989.
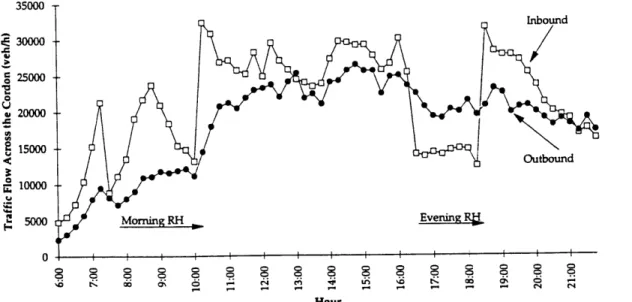
The revision in 1989 to include all vehicles except for scheduled buses and emergency vehicles reduced the number of goods vehicles and motorcycles during the restricted hours. The extension of restricted hours to include evening peak hours resulted in about 45% reduction in inbound traffic for all vehicles and about 30% reduction in outbound traffic during the period. Although the ALS effectively reduced the volume of traffic during the restricted hours, the traffic volumes in between those peak periods were high and had sharp peaks right before and after the restricted hours (Figure 2-7).
The ALS had created a high volume of traffic during the day time as some drivers avoided the restricted hours. Similarly, the traffic volumes outside the restricted zone during the restricted hours had increased as more vehicles avoided the restricted zone. The average speed along the ring road outside the restricted zone was 19 km/h as compared to 31 km/h in the restricted zone during the evening restricted hours in 1989. One of the criticisms of the ALS is that it has not really improved traffic conditions but merely pushed them somewhere else. However, an opposing argument for this criticism could be the strong impacts of the ALS on the mobility within the restricted zone and the
2.4. EXPERIENCE AND CURRENT MOVEMENTS 35000 Inbound 30000 c25000 U 20000 15000--Outbound 10000 5000 Morning RH Evening Rf I.r. Hour
Figure 2-7: Variations in hourly traffic volumes entering and leaving the restricted zone (February 1990)
Source: Menon, Lam, and Fan (1993)[39]
positive effects on the modal split. Within the restricted zone, the reduced traffic resulted in an increase in travel speeds during the restricted hours.
The implementation of the revised ALS in 1989 had brought an increase in travel speed during the evening restricted hours from 25 km/h to 32 km/h in average.
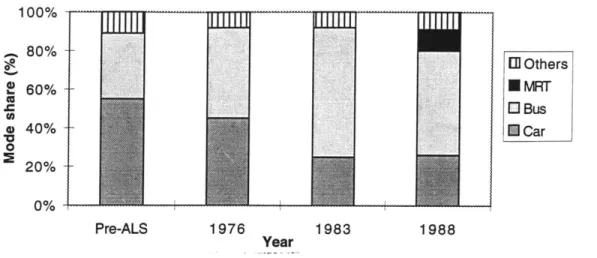
The modal split for the three major transportation modes to the restricted zone was affected by the ALS, resulting in a shift of private car users to public transit. As shown in Figure 2-8, the transit share of work trips to restricted zone increased from 33% in pre-ALS years to 69% in 1983. The large increase in the bus mode must have been a result of the restriction on private car use as some people were forced to change to a public transit. Also, the improved bus service resulting from the increased travel speed in the restricted zone must have contributed. The opening of Mass Rapid Transit (MRT) in 1988 attracted about 11% of users, but the modal split between public transit and private cars did not change considerably from 1983 to 1988.
Costs and Revenues
The capital cost of the original ALS totaled S$6.6 million in 1975. In addition, there was a monthly operating cost that averaged about S$59,000 in the first years. For the revised ALS, the capital costs amounted to only S$170,000, mainly for the installation of overhead gantries at a few additional
100% 80%-810% 1 Others 60% -MRT E0 Bus e 40% - Car 0 20% 0% -Pre-ALS 1976 1983 1988 Year
Figure 2-8: Variations in modal split of work trips to the restricted zone
Source: Menon. Lam, and Fan (1993)[39]
entry points to cover an expanded restricted zone. However, the increased manpower requirements for both the morning and evening restricted hours pushed the average monthly operating costs to about S$295,000, more than five times of the original ALS. The revenue from the ALS is mainly in the sale of licenses and the collection of fines. In Singapore, revenues related to motor vehicles and collected by the Registry of Vehicles and the Customs and Excise Department7 account for S$2.9 billion, about one-fifth of the total tax revenue in 1993. The ALS has been bringing a large portion of the government's revenue with low, capital and operating costs.
2.4.2
The Case of Hong Kong
With the real GDP growth rate averaging about 7.6% from 1975 to 1994, Hong Kong has gone through a rapid motorization. The number of registered vehicles grew at a rate of 5.2% a year in the same 20-year period, while the population grew only by 1.6% per year. Despite the government's high investment in transportation construction projects, public roads have only increased by 2.2% annually. This rapid motorization has caused rising problems including congestion, and the gov-ernment has implemented several demand management measures. The first registration tax (FRT) and annual vehicle license fees (ALFs) have helped reduce auto ownership and are still in effect. However, electronic road pricing (ERP), or a congestion pricing program tested in 1985, was not
7
Motor vehicle related tax includes motor vehicle taxes (additional registration fees, road tax, special tax on diesel engines, passenger vehicle seating fees, non-motor vehicle licenses), motor vehicle import duty, and gasoline tax[34].
2.4. EXPERIENCE AND CURRENT MOVEMENTS
implemented due to political difficulties.
Demand Management in Hong Kong
Reacting to the rapid motorization, the government of Hong Kong launched the first Green Paper on internal transportation policy in 1974. The Green Paper set out to implement a tripartite transportation policy: to improve the road system, to expand and improve public transportation, and to use road space more economically. One effective way proposed to enhance efficient use of road space was a fiscal measure to restrain auto ownership. The first registration tax (FRT), or a purchase tax, was raised by 50% to 15% of the cost, insurance, and freight (CIF) value on all private cars and motorcycles. Annual vehicle license fees (ALFs) were almost tripled, with the highest levels targeted mainly at private cars[27]. Although the FRT and the ALFs led to a decline in the
number of private vehicles, the number of goods vehicles increased instead since goods vehicles were exempted from those charges.
The total number of vehicles started to rise again in 1976 and kept rising until the FRT and the ALFs were increased drastically in 1982. The FRT was doubled to 70%-90% of a vehicle's value (CIF), and ALFs were tripled. The number of private cars declined yearly from 1982 to 1986, but it grew beyond the 1982 peak in 1990. Similarly, the number of motorcycles registrations also declined for six years from 1981, but it exceeded the 1981 peak in 1994.
Electronic Road Pricing (ERP)
The government of Hong Kong announced in 1983 that it would start the world's first technical feasibility study of electronic road pricing (ERP) through 1985. This pilot project was based on a system of automatic vehicle identification (AVI) technology with a passive electronic number (license) plate (ENP), the size of a video cassette, mounted underneath the vehicle. When a vehicle passes over a toll location, electronic loops embedded under the road surface detects the moving vehicle's ENP and relays the vehicle's identification code to the computers in the control center through roadside equipment (Figure 2-9). At the control center, a management and accounting system processes the data and bills road users automatically on a monthly basis. A closed-circuit television system was used to detect violators by photographing the license plates of their vehicles. The system was test-run in the Central/Admiralty area for a period of 8-12 months: 2,600 vehicles were fitted with ENPs, and 18 toll locations were equipped. Of the 2,600 vehicles tested, a half were government-owned vehicles, a quarter were buses, and the rest were owned by volunteers. The control center handled approximately 30,000 transactions per day[59].
Electronic loops under road surface Roadside equipment linked to computer
Figure 2-9: Schematic illustration of Hong Kong's electronic road pricing (ERP) system
2.4. EXPERIENCE AND CURRENT MOVEMENTS
characteristics (Figure 2-10 and Tables 2.2 and 2.3).
Area Other characteristics Scheme zones toll locations
A 5 130
B 5 115 Additional directional surcharge of HK$1 C 13 185 Commercial vehicles were excluded
Table 2.2: Characteristics of cordon schemes
Source: Lewis (1993)[33]
Category Shoulder Peak Inter-peak Off-peak Tidal surcharge Hours 7:30-8:00 8:00-9:30 9:30-17:00 19:00-7:30 Applied for
17:00-19:00 Saturday and peak and
inter-I_ _ Sunday (all day) peak periods Tolls HK$1, HK$2, HK$2, HK$4, HK$1, HK$2, No charge HK$1
or HK$3 or HK$6 or HK$3
Table 2.3: Hours and the amount of tolls
Source: Lewis (1993)[33]
The pilot project was a technical success "with 99.7% of reliability" [271. Accompanying eval-uation projected that the gross revenue would be HK$395 million in Scheme A, HK$465 million in Scheme B, and HK$540 million in Scheme C (all in 1985 Hong Kong dollars)[27]. It is also forecasted that peak period traffic would be reduced by 20% and congestion would be reduced sig-nificantly [20]. Overall impacts were estimated to be very positive. The revenue was estimated to be far more than the annualized capital and operating costs of HK$49 million (Scheme B) to HK$52 million (Scheme C).
Despite the greatly successful pilot project, the government could not move on to the full imple-mentation for several reasons. One factor was suspicion that it was just a government revenue-raising scheme. Another factor was privacy. Since the use of vehicle-mounted transponders enabled author-ities to track citizens, the public reacted sensitively given the 1984 Sino-British Joint Declaration on the future of Hong Kong. Some evaluators believed that the government made a tactical error in developing the program during a time of decline in stocks and property values and after major public transit improvements had already eased congestion.
Figure 2-10: The cordon schemes tested in Hong Kong
2.4. EXPERIENCE AND CURRENT MOVEMENTS
2.4.3
The Case of Japan
Although Japan has not adopted congestion pricing schemes, several analyses were conducted during the 1970's for large cities including Tokyo, Osaka, and Sapporo[60]. Currently, congestion pricing has been emphasized in the "New Traffic-Congestion Mitigation Action Program," which was published by the national government in 1993 as a part of the 11th Five-Year Road Improvement Program. Congestion pricing may be accepted relatively easily in Japan since an extensive toll road system has been used since 1952, and people are used to paying for much higher amounts of tolls than the United States.
The Toll Road System
The toll road system was first adopted on a full scale in 1952. This system functions by borrow-ing the necessary funds for planned construction from the special account of the fund application department, and then repaying the loan with toll fees levied from the users of the completed road. As of January 1993, approximately 4,900 mi (7,900 kin) of toll roads were operating (Figure 2-11), and these roads, including urban expressways, inter-city highways, and bridges between islands, are operated by several public bodies such as Japan Highway Public Corporation, designated city ex-pressway public corporations (including Metropolitan and Hanshin Exex-pressway), Honshu-Shikoku Bridge Authority, local road public corporation, and local public bodies[28].
The levels of tolls are set based on the following principles:
" Redemption principle
The total cost of construction, maintenance and management, interest payments, and other expenses should be recovered over the collection period (redemption period).
* Fairness and validity principle
Tolls are substantially higher than American tolls, and they are divided into several vehicle groups depending on their sizes. ETC systems are not introduced widely, but a pre-paid card called "high-way card", which is debited manually at toll booths and gives some discount compared to a cash
payment, has become quite popular.
New Traffic-Congestion Mitigation Action Program
The New Traffic-Congestion Mitigation Action Program, a five-year emergency action plan, was drawn up in 1993 as a part of the 11th Five-Year Road Improvement Program. It emphasizes the
Figure 2-11: Toll roads in Japan
![Figure 2-9: Schematic illustration of Hong Kong's electronic road pricing (ERP) system Source: OECD (1988)[45]](https://thumb-eu.123doks.com/thumbv2/123doknet/14454197.519296/38.918.193.753.308.791/figure-schematic-illustration-hong-kong-electronic-pricing-source.webp)