HAL Id: hal-02190771
https://hal.archives-ouvertes.fr/hal-02190771
Preprint submitted on 22 Jul 2019
HAL is a multi-disciplinary open access
archive for the deposit and dissemination of
sci-entific research documents, whether they are
pub-lished or not. The documents may come from
teaching and research institutions in France or
L’archive ouverte pluridisciplinaire HAL, est
destinée au dépôt et à la diffusion de documents
scientifiques de niveau recherche, publiés ou non,
émanant des établissements d’enseignement et de
recherche français ou étrangers, des laboratoires
A loss of photons along the line-of-sight can explain the
Hubble diagram for quasars
Yves-Henri Sanejouand
To cite this version:
Yves-Henri Sanejouand. A loss of photons along the line-of-sight can explain the Hubble diagram for
quasars. 2019. �hal-02190771�
A loss of photons along the line-of-sight
can explain the Hubble diagram for quasars
Yves-Henri Sanejouand
∗Facult´
e des Sciences et des Techniques, Nantes, France.
July 18
th, 2019
Abstract
In order to explain the Hubble diagram for quasars, an alternative to ΛCDM is proposed, namely, a sim-ple Newtonian cosmological model where the loss of photons along the line-of-sight mimics the cosmic distance-duality relation, up to z ≈ 0.2. According to this model, after ≈ 3 Gyr of travel, half of the photons emitted by a galaxy have been lost. Keywords: distance modulus, distance duality.
Introduction
According to ΛCDM, the nowadays standard cos-mological model, the dimming of supernovae of type Ia is due to an accelerated expansion of the space-time metric [1, 2]. However, the redshift of the farthest observed type Ia supernova is ≈ 1.4 [3] and it has recently been shown that, at higher red-shifts, the Hubble diagram for quasars can not be handled by ΛCDM, with a statistical significance of 4σ [4]. Of course, these latter data can be ac-commodated by extended versions of the model, through the adjustment of additional free parame-ters, like the equation of state parameter w [4].
Hereafter, it is shown that the loss of photons along the line-of-sight is a possible alternative for explaining the Hubble diagram for quasars, at least in the context of a pair of Newtonian cosmological models. It is then shown that the cosmic distance duality relation [5] can be used to single out one of them.
Cosmological model
Let us assume that τ (z), the age of the Universe at redshift z, is approximately given by:
τ (z) = 1 H0(1 + z)
(1) where H0 is the Hubble constant. Eqn 1, which
is for instance a consequence of the linear-coasting cosmological model [6, 7, 8], has noteworthy proved able to cope with the age of objects that, according to ΛCDM, seem significantly older than the Uni-verse itself [9, 10, 11].
Let us also assume that, during its travel, a pho-ton ages as the Universe does, namely:
∆t = τ (0) − τ (z) (2) where ∆t is the time taken by the photon to fly from a source at redshift z to an observer on Earth. Since the speed of light, c0, is constant, with eqn 1
and 2, Dc, the light-travel distance, is so that [12]:
Dc=
c0
H0
z
1 + z (3)
Moreover, let us assume that DL, the luminosity
distance, has the following, rather general form: DL= Dc(1 + z)ne
1
2∆tτp (4)
where n is a half-integer, τp being the photon
life-time along the line-of-sight.
In the context of Newtonian cosmological mod-els, as a consequence of the energy loss of photons during their travel, n = 12. However, if, as pre-dicted by metric theories of gravity like ΛCDM,
time-dilation of remote events is a general phe-nomenon [13, 14, 15], then n = 1. Both cases are considered hereafter.
Observables
Distance modulus
With eqn 2, 3 and 4, µ, the distance modulus: µ = 5 log10(DL) + 25 becomes: µ = 5 log10z(1 + z)n−1+ αTH τp z 1 + z + µ0 (5) where TH = H0−1 is the Hubble time, with µ0 =
5 log10(c0TH) + 25 and α = 2.5 log10e.
Distance duality
If there is no photon loss along the path between a source at redshift z and an observer on Earth, metric theories of gravity predict that [5, 16]:
DL= DA(1 + z)2
where DAis the angular distance. Deviations from
this so-called cosmic distance duality relation can be quantified using the following quantity [17]:
η(z) = DL DA(1 + z)2
(6) In practice, such deviations have been measured using single-parameter functional forms [16, 17] like, as considered herein:
η(z) = 1 + η0z (7)
In the context of Newtonian cosmological mod-els, DA = Dc. Thus, with eqn 1, 2 and 4, eqn 6
becomes: η(z) = (1 + z)n−2e12 TH τp z 1+z (8)
Datasets
Quasars
A homogeneous sample of 1598 quasars [4] with luminosity-distances determined using their rest-frame X-ray and UV fluxes [18, 19] was considered.
Since such luminosity-distances are rather noisy, the dataset was sorted by increasing values of the redshift and 16 subsamples of 101 quasars1were
an-alyzed, using the median redshift and luminosity-distance of each subsample.
Galaxy clusters
η0 (eqn 7) has been determined by several groups,
using various datasets [20]. The following two mea-sures are considered hereafter:
• η0= −0.15 ± 0.07 [21]. This measure was
ob-tained with a cosmological model-independent approach, using the gas mass fraction, from the Sunyaev-Zeldovich effect, and X-ray sur-face brightness observations of 38 massive galaxy clusters spanning redshifts between 0.14 and 0.89.
• η0= −0.08 ± 0.10 [22]. This measure was
ob-tained using the gas mass fraction, from the Sunyaev-Zeldovich effect, of 91 massive galaxy clusters spanning redshifts between 0.1 and 1.4, luminosity distances coming from super-novae of the Union 2.1 compilation [3] with similar redshifts.
Results
Quasars
With eqn 5, when n = 12, a least-square fit of the median distance modulus of the 16 subsamples of quasars yields:
TH
τp
= 3.2 ± 0.4
with µ0= 18.0 ± 0.2.
On the other hand, when n = 1, TH
τp = 1.0 ± 0.4, µ0 = 18.4 ± 0.2. As illustrated in Figure 1,
in both cases, the fit matches the data nicely, with a root-mean-square of the residuals of 0.2. Note that several other simple cosmological models have already proven able to pass this test [23].
Figure 1: The distance modulus of quasars, as a function of redshift. Each point (filled circle) is the median of 101 values, the error bars showing the corresponding interquartiles. Plain line: least-square fit of these 16 median values, when n = 12. Dashed line: when n = 1.
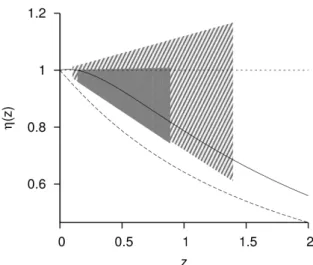
Distance duality
With the TH
τp values determined above, eqn 8 can be plotted as a function of redshift. As shown in Figure 2, n = 1 is not found consistent with ob-servational data, since it yields values more than 2σ away from both measurements, on the whole redshift range considered.
On the other hand, n = 1
2 matches the data
comfortably. Interestingly, while ΛCDM predicts η(z) ≥ 1 [5], it has been noticed that mea-surements of η(z) tend to yield values below one [17, 20, 21, 24], like when n = 12.
Discussion
How are photons lost ?
TH
τp = 3.2 means that half of the photons are lost after ≈ 3 Gyr of travel (assuming TH = 13.3 Gyr
[25]). As briefly detailed below, their loss along the line-of-sight can for instance be due to absorption. It could also have a less mundane origin.
Absorbers
Photons can be absorbed along the line-of-sight. Indeed, it has been suggested that gray
intergalac-1With only 83 quasars in the highest-redshift subsample.
Figure 2: Compatibility with the cosmic distance duality relation, as a function of redshift. Grey and hatched sectors: measurements obtained using the gas mass fraction of 38 or 91 globular clusters, re-spectively, the lower and upper limits of each sector being 2σ away from the average value. Horizon-tal dotted line: minimum value expected within the frame of metric theories of gravity like ΛCDM. Plain and dashed lines: values expected if pho-tons are lost along the line-of-sight, when n = 12 or n = 1, respectively.
tic dust could account for the dimming of type Ia supernovae [26]. However, in particular because the luminosity-distances of quasars considered herein have been determined by comparing their X-ray and UV fluxes [4], to be relevant, such absorption would have to exhibit little dependence upon pho-ton frequency.
Photon decay
It has also been suggested that photons could have a finite lifetime [27, 28], e.g. by decaying into lighter particles like massive neutrinos [29], thus reducing their flux along the line-of-sight.
Is time-dilation universal ?
In the context of the Newtonian cosmological mod-els considered herein, the fact that observations support n = 12 likely means that X-ray and UV fluxes from quasars have not experienced
time-dilation. As a matter of fact, while it has been found that light-curves of type Ia supernovae are dilated by a (1+z) factor [30, 31, 32], no such time-dilation was observed in the light curves of quasars [33, 34].
Conclusion
As shown in Figure 2, when a loss of photons along the line-of-sight is taken into account, η(z) ≈ 1 is also expected within the frame of a simple Newto-nian cosmological model (n = 12), up to z ≈ 0.2. However, above this value, η(z) is predicted to be significantly lower than one, while metric theories of gravity like ΛCDM predict η(z) ≥ 1 [5].
In any case, the present study shows that the combination of the Hubble diagram for quasars with the cosmic distance duality relation is a pow-erful test for cosmological models.
Nevertheless, as Figure 2 suggests, more accu-rate data, over a wider range of redshifts, would be welcome. They could for instance be obtained using the Sunyaev-Zeldovich effect for galaxy clus-ters and luminosity-distances of samples of quasars with similar redshifts.
Acknowledgements
I thank Guido Risaliti, for providing the latest dataset of QSO luminosity-distances, and Georges Paturel, for fruitful discussions.
References
[1] Riess, A.G., Filippenko, A.V., Challis, P., Clocchiatti, A., Diercks, A., Garnavich, P.M., Gilliland, R.L., Hogan, C.J., Jha, S., Kirshner, R.P. et al. (1998). Observational evidence from supernovae for an accelerating universe and a cosmological constant. A. J. 116(3), 1009– 1038. https://arxiv.org/abs/astro-ph/ 9805201.
[2] Perlmutter, S., Aldering, G., Goldhaber, G., Knop, R.A., Nugent, P. et al. (1999). Ω and Λ from 42 high-redshift supernovae. Ap. J. 517(2), 565–586. https://arxiv.org/abs/ astro-ph/9812133.
[3] Suzuki, N., Rubin, D., Lidman, C., Aldering, G., Amanullah, R. et al. (2012). The Hubble Space Telescope Cluster Supernova Survey. V. Improving the Dark-energy Constraints above z > 1 and Building an Early-type-hosted Su-pernova Sample. Ap. J. 746(1), 85. https: //arxiv.org/abs/1105.3470.
[4] Risaliti, G. & Lusso, E. (2019). Cosmolog-ical constraints from the Hubble diagram of quasars at high redshifts. Nat. Astr. 3(3), 272. https://arxiv.org/abs/1811.02590. [5] Bassett, B.A. & Kunz, M. (2004).
Cos-mic distance-duality as a probe of exotic physics and acceleration. Phys. Rev. D 69(10), 101305. https://arxiv.org/abs/astro-ph/ 0312443.
[6] Kolb, E.W. (1989). A coasting cosmology. Ap. J. 344, 543–550.
[7] Benoit-L´evy, A. & Chardin, G. (2008). Obser-vational constraints of a Milne Universe. arXiv 0811, 2149. https://arxiv.org/abs/0811. 2149.
[8] Melia, F. & Shevchuk, A.S.H. (2012). The Rh = ct universe. Month. Not. Roy. Astron.
Soc. 419(3), 2579–2586. https://arxiv.org/ abs/1109.5189.
[9] Sethi, G., Dev, A. & Jain, D. (2005). Cos-mological constraints on a power law universe. Phys. Lett. B 624(3-4), 135–140. http:// arxiv.org/abs/astro-ph/0506255.
[10] Yu, H. & Wang, F. (2014). Reconciling the cosmic age problem in the Rh = ct universe.
Eur. Phys. J. C 74(10), 3090.
[11] Sanejouand, Y.H. (2019). No obvious change in the number density of galaxies up to z ≈ 3.5. HAL 2019, 02019920. https://hal. archives-ouvertes.fr/hal-02019920v1. [12] Sanejouand, Y.H. (2014). A simple
Hubble-like law in lieu of dark energy. arXiv 1401, 2919. https://arxiv.org/abs/1401.2919. [13] Wilson, O.C. (1939). Possible applications of
supernovae to the study of the nebular red shifts. Ap. J. 90, 634.
[14] Schr¨odinger, E. (1939). Nature of the nebular redshift. Nature 144, 593.
[15] Schr¨odinger, E. (1939). The proper vibrations of the expanding universe. Physica 6(9), 899– 912.
[16] Uzan, J.P., Aghanim, N. & Mellier, Y. (2004). Distance duality relation from x-ray and Sunyaev-Zel’dovich observations of clus-ters. Phys. Rev. D 70(8), 083533. https: //arxiv.org/abs/astro-ph/0405620. [17] Holanda, R.F.L., Lima, J.A.S. & Ribeiro,
M.B. (2010). Testing the Distance–Duality Re-lation with Galaxy Clusters and Type Ia Su-pernovae. Ap. J. letters 722(2), L233. https: //arxiv.org/abs/1005.4458.
[18] Risaliti, G. & Lusso, E. (2015). A hubble dia-gram for quasars. Ap. J. 815(1), 33. https: //arxiv.org/abs/1505.07118.
[19] Lusso, E. & Risaliti, G. (2016). The tight re-lation between X-ray and ultraviolet luminos-ity of quasars. Ap. J. 819(2), 154. https: //arxiv.org/abs/1602.01090.
[20] Holanda, R., Busti, V. & Alcaniz, J. (2016). Probing the cosmic distance duality with strong gravitational lensing and supernovae ia data. J. Cosmol. Astrop. Phys. 2016(02), 054. [21] Holanda, R., Goncalves, R. & Alcaniz, J. (2012). A test for cosmic distance duality. J. Cosmol. Astroph. Phys. 2012(06), 022. [22] Gon¸calves, R., Bernui, A., Holanda, R. &
Al-caniz, J. (2015). Constraints on the duality relation from act cluster data. A & A 573, A88.
[23] L´opez-Corredoira, M., Melia, F., Lusso, E. & Risaliti, G. (2016). Cosmological test with the QSO Hubble diagram. Int. J. Mod. Phys. D 25(05), 1650060. https://arxiv.org/abs/ 1602.06743.
[24] Liang, N., Li, Z., Wu, P., Cao, S., Liao, K. & Zhu, Z.H. (2013). A consistent test of the distance–duality relation with galaxy clusters and Type Ia Supernovae. Mon. Not. Roy. As-tron. Soc. 436(2), 1017–1022.
[25] Riess, A.G., Casertano, S., Yuan, W., Macri, L., Anderson, J., MacKenty, J.W., Bowers, J.B., Clubb, K.I., Filippenko, A.V., Jones, D.O. et al. (2018). New parallaxes of galac-tic cepheids from spatially scanning the ble space telescope: Implications for the hub-ble constant. Ap. J. 855(2), 136. https: //arxiv.org/abs/1801.01120.
[26] Aguirre, A. (1999). Intergalactic dust and observations of type Ia supernovae. Ap. J. 525(2), 583. https://arxiv.org/abs/ astro-ph/9904319.
[27] Heeck, J. (2013). How stable is the photon ? Phys. rev. lett. 111(2), 021801. https: //arxiv.org/abs/1304.2821.
[28] Colafrancesco, S. & Marchegiani, P. (2014). Probing photon decay with the Sunyaev-Zeldovich effect. A & A 562, L2.
[29] Lesgourgues, J. & Pastor, S. (2006). Massive neutrinos and cosmology. Phys. Rep. 429(6), 307–379.
[30] Leibundgut, B., Schommer, R., Phillips, M., Riess, A., Schmidt, B., Spyromilio, J., Walsh, J., Suntzeff, N., Hamuy, M., Maza, J. et al. (1996). Time dilation in the light curve of the distant type Ia supernova SN 1995K. Ap. J. 466(1), L21–L24.
[31] Foley, R.J., Filippenko, A.V., Leonard, D.C., Riess, A.G., Nugent, P. & Perlmutter, S. (2005). A definitive measurement of time dila-tion in the spectral evoludila-tion of the moderate-redshift type Ia supernova 1997ex. Ap. J. let-ters 626(1), L11.
[32] Blondin, S., Davis, T.M., Krisciunas, K., Schmidt, B., Sollerman, J., Wood-Vasey, W., Becker, A., Challis, P., Clocchiatti, A., Damke, G. et al. (2008). Time dilation in type Ia supernova spectra at high redshift. Ap. J. 682(2), 724.
[33] Hawkins, M. (2001). Time dilation and quasar variability. Ap. J. letters 553(2), L97. https: //arxiv.org/abs/astro-ph/0105073. [34] Hawkins, M. (2010). On time dilation in
quasar light curves. Mon. Not. Roy. Astron. Soc. 405(3), 1940–1946.