HAL Id: hal-01297129
https://hal.archives-ouvertes.fr/hal-01297129
Preprint submitted on 2 Apr 2016
HAL is a multi-disciplinary open access
archive for the deposit and dissemination of
sci-entific research documents, whether they are
pub-lished or not. The documents may come from
teaching and research institutions in France or
abroad, or from public or private research centers.
L’archive ouverte pluridisciplinaire HAL, est
destinée au dépôt et à la diffusion de documents
scientifiques de niveau recherche, publiés ou non,
émanant des établissements d’enseignement et de
recherche français ou étrangers, des laboratoires
publics ou privés.
Gamma-Ray Bursts
Denis Gialis
To cite this version:
Denis Gialis. On the Signature of Highest Energy Particles in Gamma-Ray Bursts. 2008.
�hal-01297129�
Astronomy & Astrophysics manuscript no. DG2008˙aa ° ESO 2008c May 11, 2008
On the Signature of Highest Energy Particles in Gamma-Ray
Bursts
D. Gialis
Ph. D., Universit´e J. Fourier, Grenoble - FRANCE
ABSTRACT
The launch of Fermi observatory opens new possibilities to develop diagnosis of Gamma-Ray Burst parameters, es-pecially during their prompt emission. In this paper, first, we focus on the issue of the observability of the electron distribution cut-off, which is very sensitive to magnetic field parameters (intensity, turbulence level...). Its observability mainly depends on the importance of the Self-Synchro-Compton emission and, of γ-γ absorption process, that we cal-culate by taking account of the important stratification of the medium. Actually we found wide possibilities to observe or deduce the electron distribution cut-off and thus constrain magnetic parameters in the outflow of the burst. Then, we also focus on the possible gamma signature of the cosmic ray production during the prompt emission, through their synchrotron emission around a few GeV. Again we look at the γ-γ absorption process and found nevertheless favorable conditions (particularly if B ∝ 1/r) to observe this signature for some range of magnetic parameters, when the Compton parameter is sufficiently small (Y < 10−2).
Key words. gamma rays: bursts - radiation mechanisms: non-thermal - magnetic fields
1. Introduction
The interpretation of the Gamma-Ray Burst (hereafter GRB) prompt emission is one of the most important challenge for the “standard” internal shock model (see e.g. Piran (2005)). Also, a key ingredient, on the way of understanding, is the magnetic field; its intensity, its turbulence level and its temporal evolution in the outflow are crucial for both the particle acceleration processes and the resulting synchrotron and Self-Synchro-Compton (hereafter SSC) high energy emissions. We think that future Fermi observations of GRBs will provide us with some very interesting elements of diagnosis, that we want to emphasize here. In our investigation, and according to previous work (Gialis & Pelletier (2005)), we first intend to clarify and to develop some constraints on the particle acceleration efficiency in the internal shocks, following the characteristics of the magnetic field. In Sec. 2, we determine the local cut-off energy for both the accelerated particle energy distribution and their synchrotron emission and we show that the possible observation of a global energy cut-off, in the electronic synchrotron spectrum, would give us some indications on the magnetic field. In another hand, we have to take into account opacity effects, which could occur in GRB outflows and, which could prevent any observational signature relating to distribution cut-off. In Sec. 3, we then discuss about the γ-γ absorption between the highest energy photons produced by the electronic population, and the lower energy ones, and we look at which conditions it could play an important role, especially in hiding the electron distribution cut-off. In last section, we focus on the acceleration of hadronic particles, like protons: because the usual Fermi acceleration process, at internal and external shocks, seems to be inefficient to reach the UHECR energy range (see e.g. Lemoine et al. (2006), and Gialis & Pelletier (2003)), we first examine some properties of a secondary acceleration process by scattering off relativistic hydro-magnetic fronts, as previously proposed (Gialis & Pelletier (2004)). In this context, we conclude about the possibility to observe a synchrotron signature for UHECRs, depending on the magnetic parameters, against the γ-γ absorption and for a sufficiently small Compton parameter (Y < 10−2) corresponding to a magnetic dominated outflow.
2. Evolution of the electronic distribution cut-off during the prompt emission
2.1. Theoretical framework and magnetic parameters
The internal shock model was first introduced (see e.g. Rees & M´esz´aros (1994)) to describe the evolution of an unsteady ultra-relativistic outflow produced by an inner engine (black hole surrounded by a magnetized torus) during a time ∆tw. The simplest version of this model assumes that the collimated outflow is constituted by a set of layers ejected
at different times, with different Lorentz factors of the order of 102to 103, in order to solve the well-known “compactness
problem”. The average Lorentz factor ¯Γ can reach the value of the baryonic loading parameter η = E/Mbc2, where E is
the total energy of the burst and Mb the baryonic mass carried into the outflow.
Internal shocks occur when slower layers catch up with faster ones. These shocks are mildly relativistic, with a relative Lorentz factor in the co-moving frame . 2. For a typical size r0= 107 cm of the inner engine, and an average
Lorentz factor ¯Γ in the observer frame, shocks occur at a distance rb ' ¯Γ2r0 or η2r0, η being the baryonic parameter
(E/Mbc2). In this internal shock phase, the width, ∆R, of the layers is proportional to the distance r from the black
hole. Assuming that the layers are optically thin to e−-γ interactions beyond r
b, particles can be accelerated in the
layers via first and second order Fermi processes, which constitute the origin of the GRB prompt emission. The internal shock stage lasts until the deceleration radius is reached, i.e. the distance where the interaction with the surrounding medium produces an external and a reverse shock.
In our model, the profile of the mean magnetic field follows a power-law shape, B ∝ r−α (see Appendix 1). The
parameter that we consider as the less constrained is the intensity of the magnetic field at some point, either at the origin scale r0of a few gravitational radii, or at the beginning of the acceleration stage in the internal shocks at rb. The other
important index that controls the particle acceleration efficiency as a function of the particle energy is the index of the turbulent spectrum β (e.g. β = 5/3 for Kolmogorov theory). The efficiency of the Fermi acceleration process is directly related to the efficiency of particle scattering off magnetic irregularities. The most efficient acceleration is obtained with the so-called Bohm scaling, which corresponds to β = 1. This efficiency also scales with the level of magnetic irregularities ηt≡ < δB2> / < B2>. In the following, we argue that the three parameters α, β and ηt can be determined by Fermi
observations of GRB prompt emission, in particular through the measurement of the position of Epeak(i.e the maximum
of the ν Fν spectrum) and its evolution with time (see Appendix 1). More generally, the evolution of the synchrotron
spectrum and the value of the maximum synchrotron emitted energy all simply depend on these three parameters. 2.2. Acceleration processes and characteristic time
The acceleration processes are all collisionless, and they mainly depend on the local magnetic field irregularities. In this paper, we do not hypothesize on the geometrical configuration of the magnetic field. We only assume an evolution profile for the magnetic field intensity, B ∝ r−α with α ∈ [1, 2], and the existence of a turbulent component. Following
previous works (Gialis & Pelletier (2003)), we introduce a Kolmogorov turbulence spectrum such that < δB2>∝
Z kmax
kmin
k−5/3dk , (1)
where kmin' 2π/∆R. The upper bound kmaxis given by the cyclotron pulsation of the non-relativistic protons and the
Alfv`en speed: kmax ' ωcp/VA with ωcp= e B/mpc and 0.1 c . VA< c. A particle of charge q, with an energy ², can be
scattered off by Alfv`en waves only if its Larmor’s radius, rL= ²/|q| B, is greater than ∼ 2π/kmax, thus a particle of mass
m is accelerated only if its Lorentz factor is & γmin = (|q|/e)(mp/m) (VA/c) (Lacombe (1977)). We want to emphasize
this theoretical estimate which is based on the physical description of the acceleration process in a turbulent magnetic field. A similar result is usually obtained by invoking the fraction of energy which is injected in the electronic population, though it is not well known (see e.g. Pe’er & Waxman (2004)). Also, thermal protons can be accelerated while electrons are injected in Fermi acceleration processes only if their Lorentz factors & 102 to 103.
The lower bound of the synchrotron energy spectrum, in the co-moving frame, corresponding to a minimal electronic Lorentz factor γe,min close to a few 102, is thus given by
²low syn' 0.29 ³ γe,min 400 ´2 µ Bb 105G ¶ µ r rb ¶−α keV. (2)
However, in a mildly relativistic internal shock (with a Lorentz factor γ? ' 1.5), electronic and hadronic temperatures,
respectively Te and Tp, are of the same order: Te ' Tp ' γ?mpc2. Since γe,min < mp/me, a large fraction of the
electronic population is injected in the acceleration process when a slow cooling regime occurs (see Appendix 2). According to the Diffusive Shock Acceleration (DSA) theory (see e.g. Drury (1983), Blandford & Ostriker (1978), or Bell (1978)), we will assume that mildly relativistic internal shocks produce a power law energy distribution for the accelerated particles1, with a density of particles per unit of energy dn
p/d² ∝ ²−p, with p ∈ [2, 3[. Then, a thermal
elec-tronic distribution, with a maximum close to ²e
min= γe,minmec2, is extended by such a power law distribution for ² > ²emin.
Casse et al. (2002) (see also Gialis & Pelletier (2003)) showed that the characteristic acceleration time, which is propor-tional to the particle mean free path, mainly depends on both the particle rigidity and the magnetic turbulence level. For a Kolmogorov spectrum, it is given by
tacc' 6.6 × 10⁻²
¯ `
c, (3)
where the mean free path, ¯`, of a particle is given by ¯ ` = rL ηt µ rL `c ¶−2/3 . (4)
1 However, we think that this power law could be modified by considering a continuous second order Fermi process in the shocked
In this last expression, we define `c' ∆R, as the magnetic correlation length and, ηt≡<δB
2>
<B2>, the magnetic turbulence
level. At this point, it is important to stress the importance of the magnetic field intensity (via particle Larmor’s radius), its evolution with the distance (B ∝ r−α) and its turbulence level: these parameters are not only essential in the definition
of the characteristic acceleration time taccwhich controls the efficiency of the acceleration process for both leptons and
hadrons, but they also determine the magnetic confinement capabilities of the medium and, consequently, they play a key role in the problem of Ultra-High Energy Cosmic Ray generation.
2.3. Cut-off energy and electron cooling regimes
The upper bound of the energy distribution is obtained by comparing the local acceleration time taccwith both the
synchrotron cooling time, tsyn, and the co-moving dynamical time tdyn ' r/η c. Here, we assume that other cooling
processes, like e.g. the inverse Compton cooling for electrons, are negligible. Thus, according to the magnetic field evolution with the distance r, if tsyn> tdyn at rb, the energy of particles is only limited by the expansion, during all the
internal shock stage. Now, if tsyn< tdyn at rb, the energy limitation follows two stages of evolution. For usual magnetic
parameters, this last case seems to apply to the electronic population, as we will demonstrate below.
The electron energy distribution cut-off (see Appendix 1), due to the synchrotron cooling, can be written (in c.g.s units) ²e max' 1.9 × 10⁷ ³ κ0 10 ´−3/4 η1/2(B brαb)−5/4rs1, (5)
where Bb' 105G is the magnetic field intensity at rb (' η2r0), the index s1= (5α − 2)/4, and we define the turbulence
parameter κ0' 2.2×10⁻¹/ηt. At the very beginning of the internal shock phase, we obtain an electronic maximal Lorentz
factor close to 400. The corresponding cut-off energy of synchrotron photons at rb, namely ²eb,syn, does not depend on
the index α of the magnetic field intensity: ²e b,syn' 0.31 ³ κ0 10 ´−3/2 ³ η 100 ´−1µ Bb 105G ¶−3/2 ³ r0 107cm ´−1 keV, (6)
in the co-moving frame. The observational signature of such a cut-off energy could be observed at the very beginning of the prompt emission where the instantaneous electronic synchrotron spectrum could lie in a narrow energy band (10 - 100 keV) for a terrestrial observer. It is noteworthy that this cut-off energy is also independent of η in the observer frame. Finally, because ²low
synat rb has to be ≤ ²eb,syn, we obtain a strong constraint on the upper bound of the magnetic
field intensity Bb: Bb. 1.0 × 10⁵ ³ κ0 10 ´−3/5 ³ r0 107cm ´−2/5³ γe,min 400 ´−4/5 ³ η 100 ´−2/5 G, (7)
or, for the turbulence parameter, κ0. 10 µ Bb 105G ¶−5/3 ³ r0 107cm ´−2/3³ γe,min 400 ´−4/3 ³ η 100 ´−2/3 . (8)
From Eq. (7), we deduce that only high magnetic field intensity (Bb & 105 G) requires an high turbulence level (i.e
κ0 ' 10, see above). Thus, because the magnetic field at rb can vary from 103 to 107 G depending on the magnetic
properties of the central engine, one has to consider different levels of turbulence when studying particle acceleration processes in the internal shocks (see Sec. 3).
The evolution of the cut-off energy of synchrotron photons, with the distance r and beyond rb, is given by
²max syn = ²eb,syn µ r rb ¶2s1−α . (9)
Eq. (9) is valid until what we could name the “cooling radius” rc, where the co-moving dynamical time becomes shorter
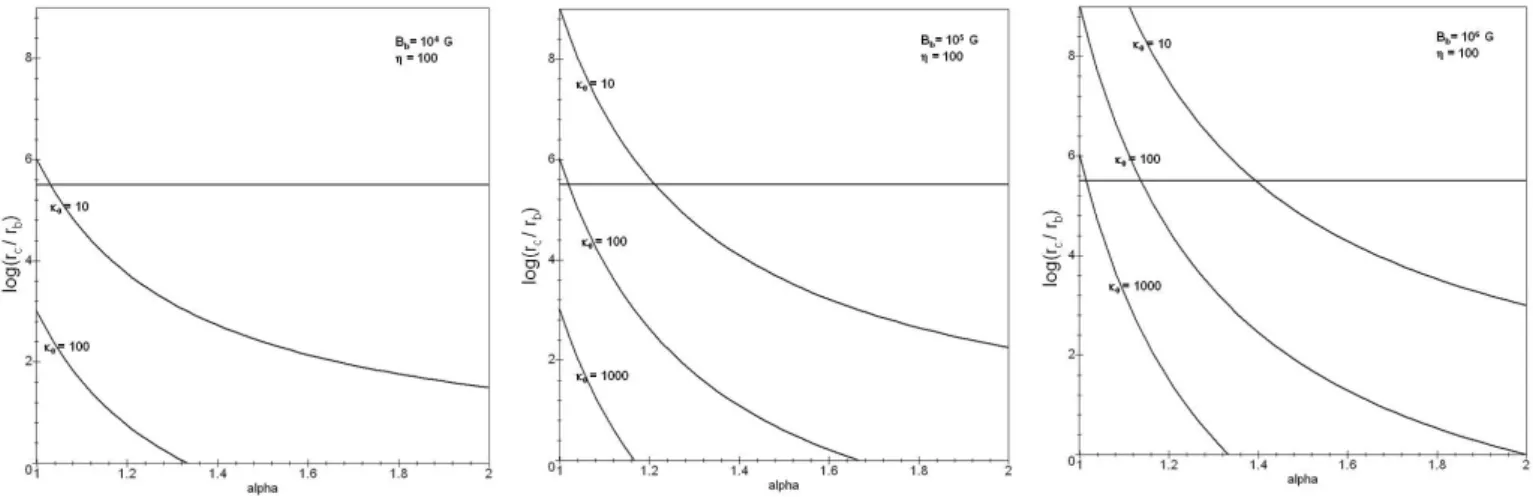
than the cooling synchrotron time. The cooling radius is such that rc' µ 1.0 × 10⁻²⁴ ³ κ0 10 ´−3 η−2 (B brbα) 3 ¶ 1 3α−2 cm. (10)
The variations of this radius with the magnetic parameters α, Bb, and κ0are strong important (see Fig. 1). For example,
on one hand, no transition occurs for an index α close to 1 and for a high turbulence level (κ0 ' 10): the synchrotron
limitation prevails and the cooling radius is moved away beyond the deceleration radius, namely rd. On the other hand,
for a low turbulence level (κ0≥ 100) with α > 1.5, the cooling radius is smaller than rb and the limitation is only due
to expansion.
Beyond the cooling radius, and until the deceleration radius, the cut-off energy of the electronic distribution is (in c.g.s units) ²e max' 1.9 × 10⁻¹¹ ³ κ0 10 ´−3 η−1B brbαrs2, (11)
with the index s2= 1 − α. Thus, we obtain a new evolution for the cut-off energy with the distance r, and beyond rc: ²max syn = ²ec,syn µ r rc ¶2s2−α . (12)
In Appendix 2, we detail the calculation of the electronic synchrotron spectrum which is locally produced at the distance r, by taking into account both the previous cut-off energy and the variation of the electronic cooling regime.
In the co-moving frame, and at the cooling radius rc, the cut-off energy of the corresponding synchrotron spectrum only
depends on the turbulence level. Indeed, Eq. (9) and (10) yield ²ec,syn ' 10 ³ κ0 10 ´−3 MeV. (13) The energy ²e
c,syn is now considered as the cut-off energy of the whole electronic synchrotron spectrum (Gialis & Pelletier
2005) when one neglects absorption processes like e.g. γ-γ interactions (see Sec. 3). A direct observation of its spectral signature, in the GeV range, would provide a very good estimate of the turbulence level. Moreover, as suggested by Eq. (10) and by the Fig. 1, the determination of the duration separating the very beginning of the prompt emission and the observation of the highest energy synchrotron photons, i.e ∆t ' (rc− rb)/η2c for a terrestrial observer, could constitute
a very interesting observational test to constrain the index α of the magnetic field evolution law in the outflow. Sec. 3 will examine the possible absorption of high energy photons in γ-γ interactions with the lower energy photons.
Fig. 1. Variation of the cooling radius rcwith the magnetic field intensity, the turbulence level and the index α. The horizontal
line corresponds to about the deceleration radius i.e the end of the internal shock stage.
3. Pair production process and high energy cut-off in synchrotron spectrum
In the internal shock stage of GRBs, the highest energy synchrotron photons can interact with lower energy photons to create some e+-e− pairs. The resulting absorption can prevent any observational signature, in the synchrotron spectrum,
of an high energy cut-off in the electronic distribution. In this section, we will assume that effects from a possible Compton Inverse process are negligible, which holds for magnetic dominated GRB outflows.
3.1. General considerations
Many studies of pair production process have been made (see e.g. Granot et al. (2008)) in GRB internal shock model, but the evolution of the magnetic field during the expansion is not generally taking into account. Indeed, the threshold energy of this process is very dependent on the magnetic field parameters. We propose here an analytical estimation of pair production effects by using our previous results concerning the synchrotron spectrum and its evolution with time. We consider a possible interaction of a photon having a high energy ²h with a photon having a lower energy ²`. These
energies will be expressed in the co-moving frame. The cross section depends on the angle θ between their directions of propagation. Then, the cross section is given by (Gould & Schr´eder (1967))
σγγ(²h, ²`, µ) ' 3 16σT(1 − β 2) · (3 − β4) ln µ 1 + β 1 − β ¶ − 2β (2 − β2) ¸ , (14)
where β = µ 1 − 2(mec2)2 (1 − µ) ²h²` ¶1/2 , (15) and µ = cos θ.
The threshold energy for this interaction is such that ²th=
2(mec2)2
(1 − µ) ²h, (16)
and σγγ is maximal for β =
√
2/2: σmax
γγ ' 0.26 σT. In our case, the co-moving threshold energy depends on r and, for
the highest energy photons (see Eq. (9) and (12)), we have
²th(r) = 2(mec2)2 (1−µ) ²e b,syn ³ r rb ´α−2s1 for rb≤ r ≤ rc 2(mec2)2 (1−µ) ²e c,syn ³ r rc ´α−2s2 for r ≥ rc . (17)
At rc, for κ0= 10 and for a head-on interaction (µ = −1), ²th' 26 keV in the co-moving frame, and whatever α.
For a sufficient low energy photon density, the highest energy photons can create pairs only when ²th(r) ≤ ²maxsyn i.e
between the radii
rth,min= Ã mec2 ²e b,syn ! 1 2s1−α rb, (18) and rth,max= µ mec2 ²e c,syn ¶ 1 2s2−α rc, (19)
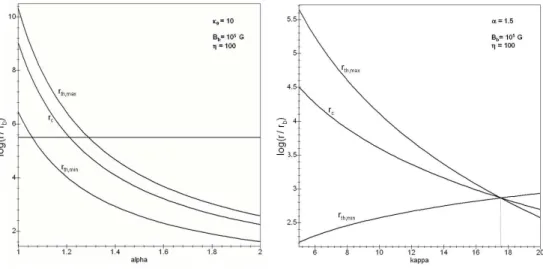
with rc ∈ [rth,min, rth,max]. As illustrated in the Fig. 2, these radii are relevant only for a set of magnetic parameters:
for example, for α close to 1, there is no possibility of γ-γ absorption. This is a specific case where the cut-off in the electronic distribution could have an observational signature (see Fig. 3), only if the turbulence is weak enough (κ0À 10). For a higher turbulence level (κ0. 10), this cut-off could only be observable for α & 1.2 (i.e when rc< rd).
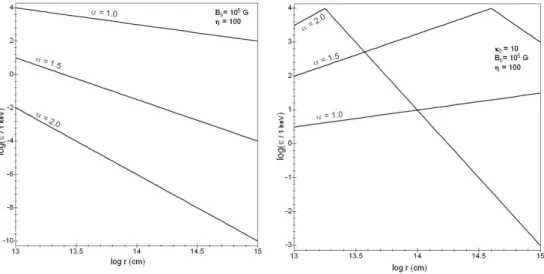
Fig. 2. Left: Variation of the threshold radii with the index α for an usual turbulence level. The horizontal line corresponds to a distance of about the deceleration radius i.e the end of the internal shock stage. Right: Variation of the threshold radii with the turbulence level for α = 1.5.
When the γ-γ absorption is possible, i.e when rth,min< deceleration radius, we have to examine the cut-off energy in the
synchrotron spectrum. For a high energy photon, the mean free path, `γγ(²h), is such that
`−1 γγ(²h) = 1 2 Z 1 −1 dµ(1 − µ) Z ²max syn ²th σγγ(²h, ²`, µ) dnγ(²`) d²` d²`, (20)
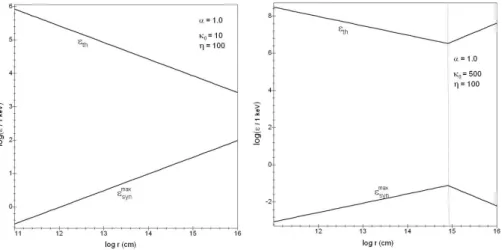
Fig. 3. The case α = 1.0 (i.e B ∝ r−1) with B
b= 105G: comparison of the maximum energy (co-moving) of synchrotron photons
with the corresponding threshold energy of the pair creation process, for two different turbulence levels. No pair creation process is possible.
where nγ(²`) is the number of photons per cm−3 at the energy ²`.
Following Gould & Schr´eder (1967), we introduce s = ²`/²th= s0Θ, with Θ = 12(1 − µ) and, s0= ²`²h/(mec2)2. Thus,
we can write `−1 γγ(²h) = 3 8σT µ m2 ec4 ²h ¶2Z ∞ m2e c4 ²h ²−2` dnγ(²`) d²` d²` Z s0(²`) 1 s ¯σ(s) ds , (21) with ¯σ(s) ' 16 σγγ
3 σT ' 1 if s & 1, and ¯σ(s) ' ln(s)/s if s À 1. Also, we can define the internal optical depth, namely τγγ(²h, r), as the ratio between the co-moving dynamical time, tdyn, and the mean time between two pair production
interactions, i.e `γγ(²h)/c.
3.2. Absorption estimate in GRB outflows
Considering now that the resulting photon distribution, in the outflow and expressed in the co-moving frame, is well described by a Band’s function (Band et al. (1993)), we have2:
dnγ d²` ' K η Liso γ ∆tw 4π r2∆R E2 peak F µ η ²` Epeak ¶ , (22)
where Epeak (' 100 keV) is the energy for which the observed ν Fν spectrum is maximum, Lisoγ ' 1051 erg·s−1 is the
observed isotropic γ-ray luminosity and, F (x) = ½ xαB exp (−(2 + α B) x) for x ≤ x0 xβBxαB−βB 0 exp (−(2 + αB) x0) for x ≥ x0 , (23)
with x0 = (αB− βB)/(2 + αB), and the normalization constant K = (
R
x F (x)dx)−1. The Band’s parameters, α B and
βB, depend on the GRB and, their mean values are close to −1 and −2.2 respectively (Preece et al. (2000)). Moreover,
following the previous section, the resulting photon distribution could exhibit a cut-off energy at ²e
c,syn. Assuming that
σγγ' σmaxγγ , and that γ-γ interactions occur only at the threshold energy:
`−1 γγ(²h) ' 0.26 σT Z ²e c,syn 0 ²`δ(²`− ²th)dnγ d²` d²`, (24)
where ²th' (mec2)2/²h, and δ, Dirac’s function. Then, in the co-moving frame, we deduce the internal optical depth
τγγ(²h, r) ' K 0.26 σTη Lisoγ ∆tw(mec2)2 4π r2E2 peak²h F µ η (mec2)2 Epeak²h ¶ . (25)
At the distance r, this expression is valid only for photons with an energy ²h > ²m' m2ec4/²maxsyn, the minimal energy
threshold. The energy of cut-off, namely ²cut, is defined by τγγ(²cut, r) = 1 for ²cut> ²m.
The possibility to have an observational signature, in the synchrotron spectrum, of the cut-off energy relating to the electronic distribution, is determined by both the choice of the magnetic parameters (turbulence level, index α and intensity Bb) and the duration ∆tw and/or the luminosity of the bursts. As it is illustrated, for example, on Fig. 4
and 5, for high turbulence level, the γ-γ absorption could only occur during a short while around rc comparing to the
internal shock phase duration. We could thus distinguish two situations: first, when ²cut> ²ec,syn at the distance rc, we
could directly observe the photons with the highest cut-off energy, ²e
c,syn, and obtain the occuring date of this maximum
(see Sec. 2.3). When ²cut < ²ec,syn around rc, we could deduce ²ec,syn by determining the slopes (2s1− α and 2s2− α,
see Eq. (9) and (12)) of the evolution, with time, of the cut-off energy in the photon spectrum when there is no γ-γ absorption i.e during the largest part of the internal shock stage. It is important to note that the original observational test that we propose here, is only based on the observation of the cut-off energy of the resulting synchrotron spectrum which evolves during all the internal shock phase: in fact, we don’t need to observe the precise shape of the spectrum. In both cases, observations by Fermi observatory could easily constrain magnetic parameters.
Finally, for a low turbulence level (κ0> 100), the γ-γ absorption does not affect the synchrotron spectrum (see Fig.
6), but the highest cut-off energy of the electronic distribution, can yield an observational signature at rb: according to
Eq. (11), it is noteworthy that this cut-off energy at rb is not dependent on the index α, and does not correspond to
any transition between two different energy limitations (i.e rc). However, because of a too strong adiabatic cooling (see
Eq. (7) and (8)), this situation would be incompatible with the acceleration process in the internal shocks: indeed, this process could not simply start.
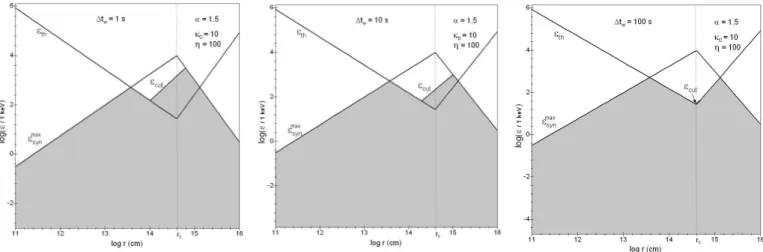
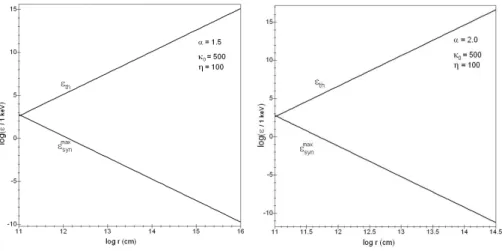
Fig. 4. The case α = 1.5 (i.e B ∝ r−3/2) with B
b = 105 G, Epeak = 100 keV, αB = −1 and βB = −2.2, for different burst
durations ∆tw: comparison of the maximum energy (co-moving) of synchrotron photons with the corresponding threshold energy
of the pair creation process (²th = ²m), and the cut-off energy ²cut. The upper boundary of the grey zone is the energy of the
highest synchrotron photons which are observable. For a high turbulence level, the γ-γ absorption is important, and the cut-off relating to the electronic distribution, at rc, is unobservable.
Fig. 5. The case α = 1.3 (i.e B ∝ r−1.3) with B
b= 105 G, Epeak= 100 keV, αB= −1 and βB = −2.2, for different burst durations
∆tw: comparison of the maximum energy (co-moving) of synchrotron photons with the corresponding threshold energy of the
pair creation process (²th = ²m), and the cut-off energy ²cut. The upper boundary of the grey zone is the energy of the highest
synchrotron photons which are observable. For a high turbulence level, the γ-γ absorption is important only for very long bursts, and the cut-off relating to the electronic distribution, at rc, could be easily observable.
Fig. 6. Comparison of the maximum energy (co-moving) of synchrotron photons with the corresponding threshold energy of the pair creation process (²th= ²m) for a low turbulence level, and for Bb= 105G: there is no γ-γ absorption.
4. Synchrotron emission from UHECRs
In the previous section, we focused on the electronic population. Here, we intend to study the possibility of an obser-vational signature of Ultra-High Energy Cosmic Rays (UHECRs), produced in the internal shocks, via their synchrotron emission. In fact, we want to determine on which conditions the synchrotron photons from accelerated protons and, more particularly, from UHECRs, could be distinguished from leptonic synchrotron and SSC components, without undergoing γ-γ absorption.
4.1. Efficiency of UHECR acceleration processes
Following our previous works (Gialis & Pelletier (2003), and Gialis & Pelletier (2004)), let us first consider the energy of the accelerated protons resulting from usual Fermi’s process, as described at the very beginning of Sec. 2: because tsyn > tdyn at rb, we deduce that the only energy limitation results from the expansion3. Also, contrary to electrons,
protons undergo a single cooling regime during all the expansion: the slow one (see Appendix 2). Then, the energy distribution of protons is such that dnp/d² ∝ ²−p, with p ∈ [2, 3[, between ²0' 1 GeV and, ²pmax, the highest energy that
protons can achieve in the co-moving frame. According to Eq. (11) and with rb' η2r0, we have
²p max' 1.2 × 10⁶ ³ κ0 10 ´−3 ³ η 100 ´ ³ r 0 107cm ´ µ Bb 105G ¶ µ r rb ¶s2 GeV, (26)
3 We assume that the outflow is always transparent to p-p interactions beyond a few r
b(see Gialis & Pelletier (2003)), and we
with the index s2= 1 − α. This is the same energy limitation as for electrons, because it depends only on the charge of
the particle, and not on its mass. Whatever any reasonable magnetic parameters, it shows that protons cannot achieve the UHECR energy range4, by considering a such scenario for Fermi’s process, as it was suggested by Waxman (1995).
To produce UHECRs, a secondary acceleration process is required. As it has been proposed by Gialis & Pelletier (2004), the protons, pre-accelerated in the internal shocks, could be scattered off multiple magnetized fronts, the internal shocks themselves, and could undergo a kind of “second order” Fermi process, which is efficient in this mildly relativistic regime.
The scenario is the following one: each internal shock can be described as a magnetized front in the resulting shocked layer. These magnetized fronts can propagate in both opposite directions in the co-moving frame. Thus, protons are not only accelerated by diffusion process on both sides of the internal shocks, but they can also undergo an acceleration mechanism directly by reflection or scattering off the mildly relativistic magnetized fronts. Also, at each scattering, the cosmic rays have an energy gain of order γ2
∗, where 1 < γ∗ . 2 is the average relative Lorentz factor of a front in the
co-moving frame. Because of the magnetic field strength and the relativistic expansion of the layer width, the accelerated protons could be confined in their initial layer, until they reach the local confinement energy limit, given by Hillas’ criterium. Because of the anisotropy of their angular distribution function, the particles could mainly escape downstream or upstream of their layer, and consequently stay in the relativistic flow. Then, cosmic rays can be accelerated again, out of their initial layer, when they encounter other magnetized layers. As we have previously seen in a Monte-Carlo simulation (Gialis & Pelletier (2004)), the escaping probability out of the collimated wind flow is weak enough during the acceleration stage from rb to a few hundreds of rb.
This secondary acceleration process could be efficient to produce UHECRs: the reason is that the characteristic accel-eration time of this process is of the order of the time separating two layer collisions, which is much smaller than the synchrotron cooling time, tsyn, and the dynamical time, tdyn, for a sufficient number of layers, namely Ns. Let us write
this acceleration time, in the co-moving frame, for a flow with NsÀ 1;
tacc'
Lcom− Ns∆R
c Ns
' m tdyn, (27)
where Lcom= c ∆twr/η r0 is the co-moving length of the flow, ∆R = r/η, the width of a layer, and
m =c ∆tw
Nsr0 − 1 . (28)
Assuming that 0.5Nmax
s < Ns< Nsmax, with Nsmax= c ∆tw/r0, we deduce that 0 < m < 1.
Writing ˙² ' ²/tacc, for a particle of energy ², we obtain the time for which, a particle, with an initial energy ²0 at t0,
achieve an energy ²; t = t0 µ ² ²0 ¶m < t0 µ ² ²0 ¶ . (29)
Consequently, a proton with ²0 ' 106 GeV (see Eq. (26)), at a few rb, achieve the UHECR energy range (² = 108
GeV) at the time t . 102t
b, in the co-moving frame, where tb = rb/η c. At last, it is interesting to mention that the
characteristic time, tpγ, of p-γ interaction cooling is such that tpγ/tacc & r/rb for r > rb: thus, we can neglect this
cooling process for UHECRs, even if a resulting high energy neutrino emission may be possible (Gialis & Pelletier (2003)). Numerical simulations showed that such an acceleration process extends the energy distribution of protons until the local confinement energy limit, i.e ²cl ' e B ∆R. Then, the corresponding cut-off energy for synchrotron photons,
produced by these UHECRs, is
²maxp,syn' 1.0 ³ η 100 ´2³ r0 107cm ´2 µ Bb 105G ¶3 µ r rb ¶2s2−α GeV, (30)
in the co-moving frame. However, according to the acceleration process, UHECRs cannot be produced before a few tens of rb. Also, because of the magnetic field decrease, the emitted synchrotron photons will have a lower energy, and the
energy cut-off of these photons would be equal to a few tens of MeV in the co-moving frame, i.e a few GeV for a terrestrial observer, for α close to 1. In fact, the energy range of the hadronic synchrotron peak is very sensitive to the index α of the magnetic field decrease (see Fig. 7): from Eq. (9) and (30), and for a dominant leptonic emission (see Sec. 4.2), we deduce that synchrotron signature of UHECRs would be compromised for a magnetic field evolution very different from B ∝ r−1. For this reason, hereafter, we will assume an index α very close to 1.
4.2. Comparison between hadronic and leptonic synchrotron emissions
First, we examine observability of an UHECR synchrotron component by comparing the hadronic and leptonic luminosities. Their ratio can be simply expressed by
Lp syn Le syn = µ me mp ¶2 Np Ne < γ2 p > < γ2 e > , (31)
where Npand Neare the numbers of emitting particles and, γpand γetheir Lorentz factors. In the case of non-relativistic
shocks, we could have NpÀ Ne, but no generation of UHECRs would be possible in our Fermi acceleration scenario. The
situation is quite different in mildly relativistic internal shocks: in fact, because of an higher temperature (see Sec. 2.2), a large fraction of the electronic population is injected in the acceleration process and then, produce an higher synchrotron emission. Also, in Eq. (31), we can assume Np ' Ne. For energy distributions ∝ γ−2, inserting Eq.(5), we obtain
Lp syn Le syn ' µ me mp ¶2 γp,minγp,max γe,minγe,max ' 1.8 × 10 −3 ³ γe,min 400 ´−2 µr rb ¶−s1 , (32)
in the synchrotron cooling stage (r < rc). An hadronic synchrotron component seems to be undetectable. However, for α
close to 1, the energy range of hadronic and leptonic components are very different around the distance (∼ 100 rb) where
the UHECR population is formed: indeed, rc À 100 rb and the cut-off energy for hadronic and leptonic synchrotron
components are respectively around a few GeV and a few hundreds of keV for a terrestrial observer (see Fig. 7). Thus, because this emission would begin around a few hundreds of tb/η, i.e a few tens of ms after the very beginning of
the prompt emission, in the observer frame, hadronic synchrotron photons could be detectable if one can observe the evolution of the spectrum with time as it was previously suggested in Sec. 3.2.
4.3. SSC and pair creation effects on observability
Concerning a possible pair creation process, the energy of threshold, for this synchrotron photons, is ²pth'(mec 2)2 ²max p,syn ' 2.6 × 10⁻¹ ³ η 100 ´−2 ³ r0 107cm ´−2 µ Bb 105G ¶−3 µ r rb ¶α−2s2 keV, (33)
beyond ∼ 100 rb. Thus, for α close to 1, there is no γ-γ absorption, because ²pth is always À ²maxsyn, the cut-off energy of
the electronic synchrotron spectrum, whatever the distance r (see Fig. 8).
Let us now investigate the possible obstacle to the observation of the synchrotron emission of UHECRs due to the SSC emission. This depends on the Compton parameter Y ≡ Us/UB, i.e the ratio between the energy densities
of the synchrotron radiation and of the magnetic field. Indeed, the synchrotron spectrum is Comptonized such that a second bump at few 100 MeV range is generated (see below); its luminosity peak is almost the synchrotron luminosity peak multiplied by Y . Actually the real parameter is weakened by the Klein-Nishina regime, which mostly amounts to multiply Y by the fraction of soft photons of energy below the threshold of pair creation. Anyway this does not change the order of magnitude. However, the synchrotron spectrum is not simply duplicate; its high energy part decays more rapidly (its index is more or less increased by 1). Nevertheless, this SSC emission can totally hide the high energy cut-off of the leptonic synchrotron spectrum for Y & 10−2, unfortunately; and thus we cannot determine directly the electron
distribution cut-off. But an indirect determination is not excluded, as explained previously when discussion about the γ-γ absorption (see 3.2).
The dominant electronic population has a Lorentz factor ¯γe . 103 during all the expansion, and, in the outflow,
the most important photon field corresponds to the Epeak i.e photons with energy ²peak ' few keV in co-moving
frame. Thus, the SSC-peak is estimated around 100 MeV (' η ¯γ2
e²peak in terrestrial observer frame), and the hadronic
synchrotron spectrum could be observed around a few GeV as predicted above, provided that the Compton parameter Y be sufficiently small (< 10−2), which is consistent with the requirement of a magnetic dominated outflow suitable for
Fig. 7. Comparison of the cut-off energy, ²max
p,syn, of the UHECR synchrotron spectrum (left), with the cut-off energy, ²maxsyn, of the
electronic synchrotron spectrum (right), for different magnetic index α, and in the co-moving frame.
Fig. 8. Comparison of the threshold energy, ²pth, with the cut-off energy, ²max
syn, of the electronic synchrotron spectrum, for α = 1,
and in the co-moving frame. There is no possible γ-γ absorption.
5. Discussion and conclusion
The analysis we have made allows to draw several unexpected conclusions about a possible diagnosis of magnetic field parameters (turbulence level, index α and intensity Bb) and particle acceleration processes in the internal shock stage,
by taking the observational limitations due to γ-γ absorption and SSC process into account. We proposed to estimate these magnetic field parameters by studying some observational consequences of their variations and, more particularly, by determining the evolution of the cut-off energy of the synchrotron part of the electronic spectrum. We then detailed on which conditions the signatures of accelerated leptonic and hadronic population of particles could be observed during the GRB prompt emission.
Let us summarize our results:
– First, we show that the electronic synchrotron spectrum which can be observed at the very beginning of the internal shock phase by Fermi observatory could lie in a narrow energy band (10-100 keV) for a terrestrial observer. Moreover, the cut-off energy of this spectrum places constraints upon both magnetic field intensity and its turbulence level, that we determined (see Eq. (7) and (8)).
– For a magnetic field (B ∝ r−α) with an index 1 ≤ α . 1.2 and by considering an high level of magnetic field
turbulence (ηt ' 10−2), we cannot observe any highest cut-off energy in the electronic synchrotron spectrum,
corresponding to ²e
c,syn, because the cooling radius, rc, would be too far from the inner engine. In another hand,
this case would be the most favourable to observe an early high energy synchrotron signature from UHECRs, with a cut-off energy around a few GeV, on the condition that there is no too strong SSC component in this energy range (in fact, when Y < 10−2), in the internal shocks at the same moment. It is noteworthy that the magnetic field
decreases in 1/r in two important cases: one case corresponds to the existence of a large scale mean field anchored in a central rotator (this is then a toroidal field that dominates at large distance), the other case corresponds to the amplification of the magnetic field to equipartition at each shock (Pmag ∼ P ∼ ρ γ?c2with ρ ∝ 1/r2).
– For 1.2 . α . 1.4, the electronic synchrotron spectrum could reveal an highest cut-off energy just before the end of the prompt emission, despite the pair creation process with gamma photons of lower energy and for a Compton parameter Y < 10−2. This cut-off energy, around 1 GeV for the terrestrial observer, could be directly observable for
sufficient short GRBs (i.e ∆tw < a few tens of seconds) and for reasonable luminosity (i.e Lisoγ ' 1051 erg·s−1), by
the new Fermi observatory.
– For 1.4 . α . 2, we cannot observe directly any highest cut-off energy in the electronic synchrotron spectrum, but this energy could be easily deduced from the observation of the instantaneous cut-off energy during the prompt emission stage and, more particularly, from its variations with time, as described in Sec. 3.2.
– For a low level of turbulence (ηt < 10−3), and whatever the magnetic field index α, there is no γ-γ absorption.
However, the highest energy cut-off of the electronic synchrotron spectrum does not correspond to the previous cut-off energy ²e
c,syn, and it only results from the comparison between tacc and tdyn at the very beginning of the
internal shock stage (i.e at rb). Also, it is important to note that this early cut-off energy is not dependent on the
magnetic field index. In this case, the electronic population would undergo a pure slow cooling regime, but the adiabatic cooling is too strong and the acceleration process cannot start.
– At last, for a low turbulence level, the UHECR generation could be also compromise, because of inefficiency of the primary acceleration process in the internal shocks (see Eq. (26) with κ0À 10) and, consequently, a too weak energy
of injection in any secondary acceleration process.
We emphasize that any observability of the electron distribution cut-off or of the UHECR synchrotron emission would stem from a detailed analysis of the spectrum temporal evolution; no single zone modeling of the emissions will provide with this important diagnosis. The diagnosis of magnetic parameters through the spectrum evolution seems already at hand with Fermi observations.
Appendix 1: Cut-off energy of the electronic population in the internal shock stage
The Fermi acceleration (first and second order) in the internal and midly relativistic shocks was first considered by Waxman (1995) with a characteristic acceleration time proportional to Larmor’s time of accelerated particles (Bohm scaling). We showed in a previous paper (Gialis & Pelletier 2003) that, in a more realistic situation, Fermi’s acceleration time in the internal shocks depends on the mean free path of the particle, namely ¯`, in an irregular magnetic field. Assuming a turbulence spectrum of magnetic perturbations that follows a power law of index β, on both sides of the shock, we have ¯ ` = rL ηt µ rL `c ¶1−β , (34)
for Larmor’s time rL< `c, with ηt≡ <δB
2>
<B2> the turbulence level, and `c the magnetic correlation length, which is of the
order of the layer thickness i.e ' r/η beyond the radius rb. Eq. (34) is known in weak turbulence theory and has been
extended into the regime of strong turbulence (Casse et al. 2002). Then, the acceleration time taccis given by
tacc' 21−β|µ|1−β 3πβ(β − 1) ¯ ` c, (35)
where µ is the cosine of the pitch angle.
We suppose that layers start to expand by carrying a magnetic field the intensity of which decays like r−α (1 ≤ α < 2),
and is equal to Bb' 105G at rb. According to the equation (35), the acceleration time, in the co-moving frame, for an
electron is (c.g.s units) tacc' C1(β) ³ κ0 10 ´ η1−β (B brbα)β−2²2−βr(β−1)+α (2−β), (36)
where ² is the energy of the electron, e is elementary charge, κ0(≡ |µ|
1−β
2π ηt ), the ratio of the acceleration time over Larmor’s time for rL= `c, and the coefficient
C1(β) =20 (2π)
1−βeβ−2
3 (β − 1) c . (37)
The acceleration process is clearly more efficient for a value of α close to 1 i.e for a slow decaying magnetic field. In the internal shock stage, we obtain the electron maximal energy by comparing the acceleration time with the char-acteristic synchrotron loss time. This energy, namely ²syn and calculated in the co-moving frame, is the synchrotron
limitation ²syn= C2(β) ³ κ0 10 ´ 1 β−3 η1−ββ−3 (Bbrα b) β β−3 rs1, (38)
where the index s1 can be written as
s1=
1 + β (α − 1)
3 − β , (39)
and the coefficient C2(β) as
C2(β) = µ 6π m2 ec3 σTC1(β) ¶ 1 3−β . (40)
For α = 1, and a Kolmogorov scaling with β = 5/3, this limitation can be expressed as ²syn= 210³ κ0 10 ´−3/4 ³ η 100 ´−2 µ Bb 105G ¶−5/4³ r0 107cm ´−5/4 ³ r 1011cm ´3/4 MeV. (41)
Another limitation comes from adiabatic cooling due to the relativistic expansion of the layer. Comparing the character-istic dynamical time (' r/c η) with the acceleration time leads to a new limitation for the energy of the electrons. This expansion limitation, namely ²exp and calculated in the co-moving frame, is such that
²exp= (c C1(β)) 1 β−2 ³ κ0 10 ´ 1 β−2 η−1B brbαrs2, (42)
where the index s2 is equal to 1 − α. For α = 1, and β = 5/3, we have
²exp= 1.2 × 10⁹ ³ κ0 10 ´−3 ³ η 100 ´ µ Bb 105G ¶ ³ r 0 107cm ´ MeV. (43)
The transition radius rc between these two limitations can be easily obtained:
rc= Λ(α, β) ³ κ0 10 ´ 1 (β−2) (3α−2) η2−3α2 (Bbrα b) 3 3α−2 , (44)
where the coefficient is such that Λ(α, β) = µ 20 (2π)1−β 3 (β − 1) ¶ 3−β (β−2) (3α−2) µ9π m2 ec4(β − 1) 10 σT(2π)1−βe ¶ 1 2−3α . (45)
For α = 1 and β = 5/3, the distance may be close to rd;
rc = 1.0 × 10²⁰³ κ0 10 ´−3 ³ η 100 ´4 µ Bb 105G ¶3 ³ r0 107cm ´3 cm . (46)
Thus, during the expansion, the electron energy distribution undergoes a two stage self-similar evolution, that depends on magnetic parameters.
For an electron in a magnetic field B, the synchrotron emission reaches a maximum power close to the cut-off energy ²max' h e B
4 m3
ec5
²2, (47)
where ² is the energy of the electron.
According to Eq. (38), for rb≤ r ≤ rc, this energy, in the observer frame, can be expressed as
²synmax' h e 4m3 ec5 C22(β) ³ κ0 10 ´ 2 β−3 η3−β1+β (Bbrα b) 3(1−β) 3−β r2s1−α. (48)
And Eq. (42) leads to the evolution for r ≥ rc, which is ∝ r2−3α;
²syn max' h e 4m3 ec5 (c C1(β)) 2 β−2 ³ κ0 10 ´ 2 β−2 η−1 (B brαb)3r2−3α. (49)
The energy ²c at the break radius rc is given by
²c ' 4.4 × 10⁻⁸ (c C1(β)) 2 β−2 µ 20 (2π)1−β 3 (β − 1) ¶β−3 β−2 µ9π m2 ec4(β − 1) 10 σT(2π)1−βe ¶ ³κ 0 10 ´ 1 β−2 η . For r ' rb and according to Eq. (48), one can write the initial ²synmax, namely ²ipeak, as
²ipeak∝ η λ 3−βη 2 3−β t µ Ω c ∆tw r0 ¶3 2 β−13−β ³ MBH5/2Emag−3/2 ´β−1 3−β , (50)
where Emagis the magnetic energy released by the burst, MBHthe mass of the inner black hole, and λ = 5−3β+6α (β−1).
Assuming that Emag∝ E and MBH∝ E, this relation yields to a kind of Amati’s law involving β only:
²ipeak∝ E
β−1
Appendix 2: Determination of the local electronic synchrotron spectrum
In this Appendix, we propose to determine the electronic distribution and the resulting synchrotron spectrum locally produced, which both depend on the distance from the central engine: we usually distinguish two cooling regimes for the electronic population (Sari et al. (1998), Gupta & Zhang (2007)) separating by the condition tsyn= tdyn corresponding
to a critical Lorentz factor:
γcr' 2.3³ η 100 ´ µ Bb 105G ¶−2 µ r rb ¶2α−1 . (52)
An electron, with a Lorentz factor γe, undergoes a fast cooling regime if γe> γcr and, a slow cooling regime otherwise.
The transition radius, rt, for which γcr= γe,min, is
rt' " 174 ³ γe,min 400 ´ ³ η 100 ´−1 µ Bb 105G ¶2#2α−11 rb. (53)
Obviously, whatever α ∈ [1, 2], rb< rt< rc. Then, because of the outflow evolution during the expansion, we show that
accelerated electrons undergo these two cooling regimes (see Fig. 9). Indeed, let be f (², t), the electronic distribution, at a time t in the co-moving frame. According to the acceleration process, the continuity equation, for the fast cooling regime, can be simply expressed as
∂f ∂t +
∂
∂²( ˙² f ) ∝ ²
−p, (54)
by assuming that tacc ¿ tsyn, and only considering synchrotron losses, i.e ˙² ∝ ²2. In the stationary case (∂/∂t ≡ 0), we
deduce that f (², t) ∝ ²−(p+1). In slow cooling regime, the distribution is mainly governed by the acceleration process, i.e
f (², t) ∝ ²−p. Thus, during the expansion, and in the co-moving frame, we derive the following results, without taking
account of the thermal component for ² < ²e
min:
- When γe,min> γcr, which is always the case at the very beginning of the internal shock phase,
dne d² ∝ ½ ²−2 for ² cr< ² < ²emin ²−(p+1) for ²e min< ² < ²emax , (55) where ²e
min= γe,minmec2 and ²cr= γcrmec2. This is a “pure” fast cooling regime for all the accelerated electrons. The
corresponding synchrotron photon distribution, in the co-moving frame, is dnγ d² ∝ ²−2/3 for ² < ²cr syn ²−3/2 for ²cr
syn< ² < ²lowsyn
²−(p+2)/2 for ²low
syn< ² < ²maxsyn
, (56)
where we define ²cr
syn' 3h e B γcr2/(4π mec) for γcr> 1. More precisely, the scaling is the following one
²cr syn' 9.2 × 10⁻⁶ ³ η 100 ´2 µ Bb 105G ¶−3 µ r rb ¶3α−2 keV. (57)
- When γe,min< γcr< γe,max, which is always the case between rtand rc,
dne d² ∝ ½ ²−p for ²e min< ² < ²cr ²−(p+1) for ² cr< ² < ²emax . (58)
This situation mixes the two cooling regimes for the accelerated electron population and, the synchrotron photon distri-bution, in the co-moving frame, is
dnγ d² ∝ ²−2/3 for ² < ²low syn ²−(p+1)/2 for ²low syn< ² < ²crsyn ²−(p+2)/2 for ²cr
syn< ² < ²maxsyn
. (59)
- When γcr> γe,max, which is always the case beyond the cooling radius rc,
dne
d² ∝ ²
−p for ²e
min< ² < ²emax. (60)
This is a “pure” slow cooling regime for the accelerated electrons. Here, the synchrotron photon distribution is simply dnγ d² ∝ ½ ²−2/3 for ² < ²low syn ²−(p+1)/2 for ²low
syn< ² < ²maxsyn
. (61)
The resulting synchrotron photon distribution can be numerically calculated by the integration of the previous local distributions, all along the outflow. The obtained result is really different from the previous works (see e.g. Gupta & Zhang (2007)) because it takes into account both the important stratification of the outflow and a precise cut-off energy, in the local electronic synchrotron spectrum, resulting from a detailed analysis of the acceleration process. This point will be fully detailled in a forthcoming paper. However, in this paper, we have just assumed that the resulting photon distribution is given by a phenomenological Band’s function (Band et al. (1993)).
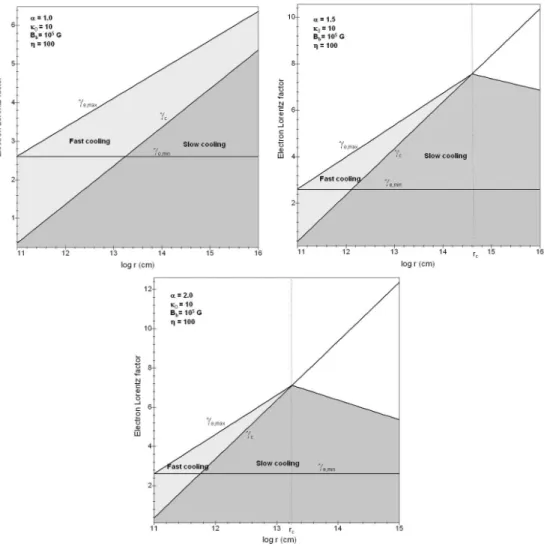
Fig. 9. Variation of the upper (γe,max) and lower (γe,min) bounds for the electronic Lorentz factor distribution, for three different
magnetic field index α, and beyond rb. The critical Lorentz factor, γcr, separates the accelerated electron distribution in two
different regimes: the fast cooling regime and the slow one.
References
Asano, K. & Inoue, S. 2007, ApJ, 671, 645
Band, D., Matteson, J., Ford, L., et al. 1993, ApJ, 413, 281 Bell, A. R. 1978, MNRAS, 182, 147
Blandford, R. D. & Ostriker, J. P. 1978, ApJL, 221, L29
Casse, F., Lemoine, M., & Pelletier, G. 2002, Phys. Rev. D, 65, 023002 Drury, L. O. 1983, Reports of Progress in Physics, 46, 973
Gialis, D. & Pelletier, G. 2003, Astrop. Phys., 20, 323 Gialis, D. & Pelletier, G. 2004, A & A, 425, 395 Gialis, D. & Pelletier, G. 2005, ApJ, 627, 868
Gould, R. J. & Schr´eder, G. P. 1967, Phys. Rev., 155, 1404
Granot, J., Cohen-Tanugi, J., & do Couto e Silva, E. 2008, ApJ, 677, 92 Gupta, N. & Zhang, B. 2007, MNRAS, 380, 78
Lacombe, C. 1977, A&A, 54, 1
Lemoine, M., Pelletier, G., & Revenu, B. 2006, ApJL, 645, L129 Pe’er, A. & Waxman, E. 2004, ApJ, 613, 448
Piran, T. 2005, Reviews of Modern Physics, 76, 1143
Preece, R. D., Briggs, M. S., Mallozzi, R. S., et al. 2000, ApJS, 126, 19 Rees, M. J. & M´esz´aros, P. 1994, ApJL, 430, L93
Sari, R., Piran, T., & Narayan, R. 1998, ApJL, 497, L17+ Waxman, E. 1995, Phys. Rev. Lett., 75, 386