Publisher’s version / Version de l'éditeur:
ASHRAE Journal, 35, February 2, pp. 34-36, 1993-02
READ THESE TERMS AND CONDITIONS CAREFULLY BEFORE USING THIS WEBSITE.
https://nrc-publications.canada.ca/eng/copyright
Vous avez des questions? Nous pouvons vous aider. Pour communiquer directement avec un auteur, consultez la première page de la revue dans laquelle son article a été publié afin de trouver ses coordonnées. Si vous n’arrivez pas à les repérer, communiquez avec nous à [email protected].
Questions? Contact the NRC Publications Archive team at
[email protected]. If you wish to email the authors directly, please see the first page of the publication for their contact information.
NRC Publications Archive
Archives des publications du CNRC
This publication could be one of several versions: author’s original, accepted manuscript or the publisher’s version. / La version de cette publication peut être l’une des suivantes : la version prépublication de l’auteur, la version acceptée du manuscrit ou la version de l’éditeur.
Access and use of this website and the material on it are subject to the Terms and Conditions set forth at
Changes in air leakage levels of six Canadian office buildings
Shaw, C. Y.; Reardon, J. T.; Cheung, M. S.
https://publications-cnrc.canada.ca/fra/droits
L’accès à ce site Web et l’utilisation de son contenu sont assujettis aux conditions présentées dans le site LISEZ CES CONDITIONS ATTENTIVEMENT AVANT D’UTILISER CE SITE WEB.
NRC Publications Record / Notice d'Archives des publications de CNRC:
https://nrc-publications.canada.ca/eng/view/object/?id=c88ec981-012a-471e-9071-8132751d0ea7 https://publications-cnrc.canada.ca/fra/voir/objet/?id=c88ec981-012a-471e-9071-8132751d0ea7
National Research Conseil national Council Canada de recherches C- .
..
;[Ki;:: p3.p"' ANAL'Y'SE
Institute for lnstitut de --. -.. gev Crei.i_lhtlz3t3
Research in recherche en
Construction construction
ANALYZED
Changes in Air Leakage
Levels of six Canadian Office
Buildings
by
C.Y. Shaw, J.T. Reardon, and
M.S.
Cheung
Reprinted from:
ASHRAE Journal
February
1
993
(IRC Paper No.
3206)
ASHRAE JOURNAL
February1993
Changes
in
air leakage levels
of six Canadian off ice buildings
Old o f f e buildings can be succesfully retrofted to improve
their airtightness and reduce their energy consumption
By
C.I.: Shaw, Ph.D.;
AT.
Reardon, Ph.D.; and
M.S.
Cheung, Ph.D.
Member ASHRAE'ith a long severe winter, To assess the potential for retrofit- ings A,
B,
D, E, F and G2 These buildings, most Canadian buildings ting old office buildings in Canada. which are 10 to 26 stories high, were built will likely experience some This article briefly describes the 1991 between 1964 and 1974, and they were deterioration of their enve- test procedures and the test results. As men- previously tested between 1970 and 1974. A lopes as they age. As air leakage is now sus- tioned, six buildings in the Ottawa area detailed description of the buildings is pected to be the major cause for such were tested. These are identified as Build- given in Table 1.deterioration, it is common for airtighten- ing to be included in the repairs of such buildings.
In addition, because of its direct rela- tionship with energy usage, airtightening is also usually included in energy conserva- tion retrofits of existing buildings. As a result, the airtightness of old buildings can be very much different from when they were new.
About 20 years ago, eight new office buildings in the Ottawa area were tested to measure their air leakage characteristics.'J Because these and many other buildings of similar age are still in use, a follow-up fan pressurization test was conducted in 1991 on six of the eight buildings to determine the changes in the airtightness levels of such buildings.
The objectives of the 1991 test were: To determine the changes in the buildings' airtightness characteristics because of. applied retrofit measures (if applicable); and
Table 1. Description of Test Buildings
Building A B D E F G
Year built 1970 1964 1971 1968 1973 1974 No. of typical floors 9
-
17 20 21 16 25 Area, m2 3264 1161 644 1200 1400 1628 (ft2) (35,137) (1 2,498) (6,932) (1 2,917) (1 5,070) (1 7,525) Window area (% wall area) 38 33 26 35 52 26 Ratio of roof to total wall 31% 12% 8% 11% 15% 11% Window type Fixed Openable Fixed Fixed Fixed Fixed sealed sealed sealed sealed sealed sealed double double double double double double glazing glazing glazing glazing glazing glazingWall construction 1 2 3 4 5 6
1. Precast concrete; 203 mm (8 in.) tile; 51 mm (2 in.) insulation; air space; 152 mm (6 in.) tile; piaster
2. Precast concrete panel; 51 mm (2 in.) tik; insulation
3. Metal panel; air space; 51 rnrn (2 in.) insulation; 508 rnrn (20 in.) concrete 4. Metal panel; 51 mm (2 in.) insulation
5. Precast concrete panel; 25 mm (1 in.) insulation 6. Precast concrete panet 25 rnrn (1 in.) insulation
About the authors
CY. Shaw is a senior research officer with the J.T. Reardon is an associate research officer M.S. Cheung is the manager of the Research, Institute for Research in Construction, with the Institute for Research in Construe- Development and Demonstration Division, National Research Council Canada, Ottawa, tion, National ~ mCouncil Canada. He h Public Works Canada, Ottawa, Ontario. He Ontario, Canada. He received his PhD in received his p h ~ in mechanical engineering received his PhD in civil engineering from engin- from the U n i e t y of from the University of Waterloo. the University of Calgary. Cheung is a mem- Ottawa. Shaw is a member of the Association ber of the American Society of Civil Engi-
of Professional Engineers of the province of neers and the Canadian Society for Civil
Measurement method ness values of the six buildings, respectively. C = flow coefficient, L/s m2 (Pa)0.65 The test method for the 1991 test was Except for Building A, all data lie within a [cfm/ft2 (in. ~ a t e r ) ~ . ~ ~ ] the same as that developed for the original
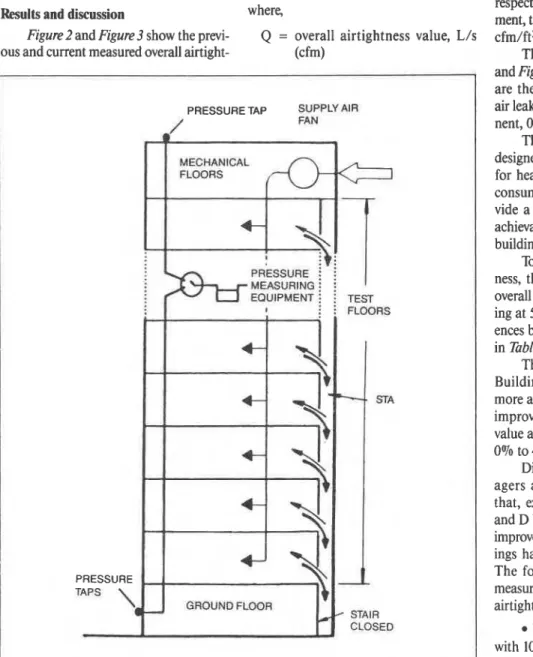
st~dies.'.~ Briefly, it involves pressuriz- ing the test building using the building's supply air systems with 100% outside air (Figure 1 ).
All the return and exhaust fans are turned off during the test. Supply airflow rates are varied and the corresponding pres- sure differences created across the building envelope at the ground and roof levels are measured and recorded.
The air leakage characteristics of the test buildings are then determined by plot- ting the airflow rates against the average value of the pressure differences measured at the ground and roof levels. The detailed test procedures are included in Shawl and Tamura and S h a ~ . ~
narrow band.
Building A is only half as high as the other buildings and its roof area is about twice that of the other buildings. Therefore, the leakage through the roof and basement may play a larger role in Building A's overall air leakage than in the other buildings.
For this reason, Building A may not be representative of the same category of tall buildings as the others that typically have a smaller roof-to-wall area ratio (see
Table 1 ).
Ignoring Building A, the data were fitted to the standard air leakage equation with a flow exponent of 0.65:2
A = area of exterior wall, m2 (ft2) AP = pressure difference across enve-
lope, Pa (in. water)
Three
curves were obtained, represent- ing the lower and upper limits and the aver- age value The values of the flow coefficient for the lower limit, average value and the upper limit were 0.106, 0.147 and 0.205 L/s.
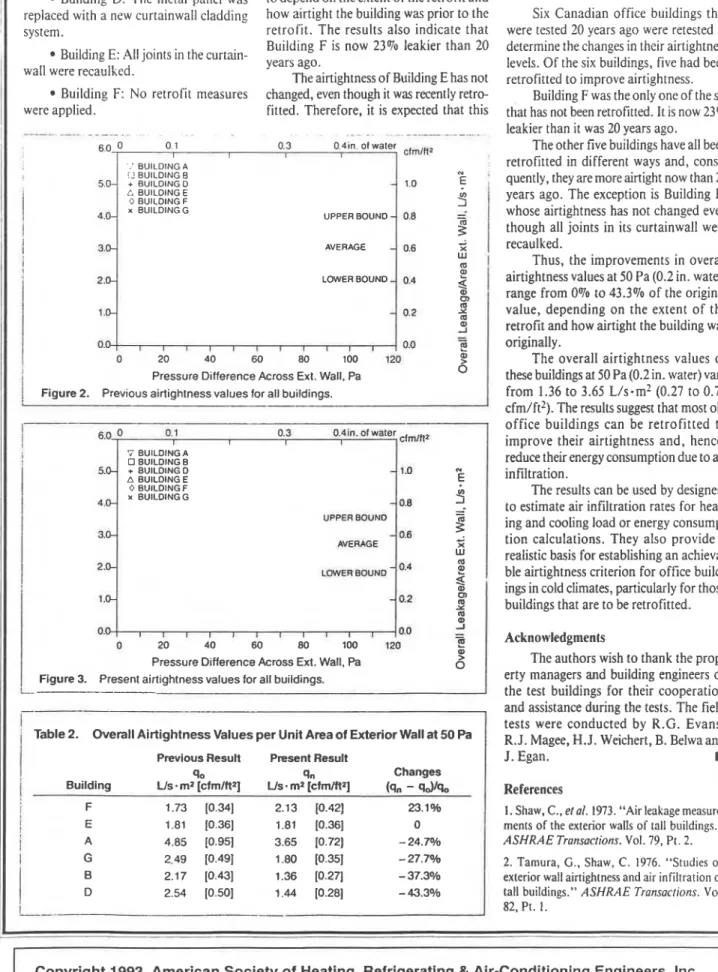
m2 (Pa)0.65, respectively. In English units of measurement, the values were 0.753, 1.045 and 1.457 cfm/ft2. (in. ~ a t e r ) O . ~ ~ , respectively.For comparison, the corresponding flow coefficients for the previous study were 0.137.0.185 and 0.249 L/s-m2 *(Pa)0.65
PRESSURE TAP SUPPLY *IR
FAN
Figure 1. Text building set-up
.
,where, respectively. In English units of measure- Results and discussion ment, the values were 0.974,1.315 and 1.770
Figure2 and Figure 3 show the previ- Q = overall airtightness value, L/s cfm/ft2 (in. ~ a t e r ) O . ~ ~ respectively. ous and current measured overall airtight- (cfm) The upper limits shown in Figure 2
and Figure3, which appear to be too high, are the result of fitting the data to the air leakage equation with a constant expo- nent, 0.65.
The above coefficients can be used by designers to estimate air infiltration rates for heating load, cooling load or energy consumption calculations. They also pro- vide a realistic basis for establishing an achievable airtightness criterion for office buildings.
To determine the changes in airtight- ness, the previous and current measured overall airtightness values of each build- ing at 50 Pa (0.2 in. water) and the differ- ences between the two tests are compared in Table 2.
The results indicate that, except for Building F, the building envelopes are more airtight now than 20 years ago. The improvement in the overall airtightness value at 50 Pa (0.2 in. water) ranges from 0% to 43.3% of the original value.
Discussions with the property man- agers and building engineers indicate that, except for Building F, Buildings B and D have been extensively retrofitted to improve airtightness. The other three build- ings have also been partially retrofitted. The following summarizes the retrofit measures applied to improve the buildings' airtightness.
Building A: A new vapor barrier with 100 mm (4 in.) thick rigid insulation was installed for the 10th floor and part of the 9th floor.
- I
!
II
I!
I
. . . . . . . . . . - - . . . - . - . . . - - - . . . . --- .- -. . - - - - -. . . . . . . . . . . . .Changes in air leakage levels
- - I
. . -- . . . -- ~ - - -. . . - . . - --
Building B: All windows were re- * Building G: A new roof was building would have been much leakier
caulked and resealed. All vertical columns installed. than before if i t had not been retrofitted.
were sealed from the inside. The degree of improvement appears
Building D: The metal panel was to depend on the extent of the retrofit and Summary
replaced with a new curtainwall cladding how airtight the building was prior to the Six Canadian office buildings that
system. retrofit. The results also indicate that were tested 20 years ago were retested to
Building F is now 23% leakier than 20 determine the changes in their airtightness
Building E: All joints in the curtain-
years ago. levels. Of the six buildings, five had been
wall were recaulked.
The airtightness of Building E has not retrofitted to improve airtightness.
Building F: No retrofit measures changed, even though it was recently retro- Building F was the only one of the six
were applied. fitted. Therefore, it is expected that this that has not been retrofitted. It is now 23%
- -
-
. .-
-. - - - . - . . .-
. . - . . .. . - - - -. leakier than it was 20 years ago.6.0 O 0 1 0.3 0.4in. of water
I I I I clmlA2 The other five buildings have all been
I
I
;I retrofitted in different ways and, conse-
m '
1.0 E
;
quently, they aremoreairtight now than 205.0-
-1
4 , s x BUlLDlNGG UPPER BOUND
-
0.8-
1 3.0- AVERAGE
-
-
;
'
: BUILDING A
L? BUILDING B
+ BUILDING D
-
whose airtightness has not changed even though all joints in its curtainwall were recaulked. O BUILDING E 9 BUILDING F
>
!
Building U s . mz [cfmlttz] U s-
mz [cfm/ft2] (q,-
qdlq,j
F 1.73 10.341 2.13 [0.42] 23.1 % E 1.81 10.361 1.81 10.361 0 I I A 4.85 [0.95] 3.65 10.721-
24.7% G 2.49 10.491 I .80 [0.35]-
27.7% B 2.17 10.431 1.36 [0.27]-
37.3%i
2.54 (0.501 1.44 10.281-
43.3% I_-
years ago. The exception is Building E,
1
0.6Thus, the improvements in overall
/
airtightness values at 50 Pa (0.2 in. water)2.0- LOWER BOUND
-
0.4s
t . ~
-
0.2 2 mOD 1 1 1 1 1 1 1 1 , 1 , 0.0 =
0 20 40 60 80 100 120
$
I
Pressure Difference Across Ext. Wall. Pa
'
Figure 2. Previous airtightness values for all buildings.6.0
*
0.1 D.3 0.4tn. of water dm,RtI
1 1 I I : ! 7 BUILDING A BUILDING B 5.01 + BUILDING D-
1D N a BUILDING E E 0 BUILDING F x BUlLDlNGG 4 .o--
0.e3
-
UPPER BOUND-
30--
0.6 #€RAGE-
2 . c LbWEA BOUND-
0.4 2s
-
0.2 m Y m al 0.0,
0.0 -I-
-
0 20 40 60 80 100 120 0 )Pressure Difference Across Ext. Wall. Pa
6
Figure 3. Present airtightness values for all buildings.--
.- -
-
-> - --Copyright 1993, American Society of Heating, Refrigerating & Air-conditioning Engineers, Inc., 1791 Tullie Circle NE, Atlanta, GA 30329. Reprinted by permission from ASHRAE Journal.
References
1. Shaw, C., el 01. 1973. "Air leakage measure- ments o f the exterior walls of tall buildings."
ASHRAE Transacfions. Vol. 79, Pt. 2. 2. Tamura, G., Shaw, C. 1976. "Studies on
range from 0% to 43.3% of the original value, depending on the extent of the retrofit and how airtight the building was originally.
The overall airtightness values of these buildings at 50 Pa (0.2 in. water) vary from 1.36 to 3.65 L/s-m2 (0.27 to 0.72 cfm/ft2). The results suggest that most old office buildings can be retrofitted to improve their airtightness and, hence, reduce their energy consumption due to air infiltration.
The results can be used by designers to estimate air infiltration rates for heat- ing and cooling load or energy consump- tion calculations. They also provide a realistic basis for establishing an achieva- ble airtightness criterion for office build- ings in cold climates, particularly for those buildings that are to be retrofitted. Acknowledgments
The authors wish to thank the prop- erty managers and building engineers of the test buildings for their cooperation
I
exterior wall airtightness and air infiltration of tall buildings." ASHRAE Transaclions. Vol.
82, Pt. 1.
1
I
Table 2. Overall Airtightness Values per Unit Area of Exterior Wall a t 50 Pa
Previous Result Present Result
‘lo %I Changes
and assistance during the tests. The field tests were conducted by R.G. Evans,
R. J. M ~
H.
J. weichert, ~ ~ B. ~Belwa and ,OVERALL AIR TIGHTNESS VALUES
r40
1
0.1 PRMOUS 0.3
.
'0.4 in. of water6.0 - I I I I
'.
u E V Uv
m P K ; A BITIU)ING B 5.0-
+
BUIlDING D-
1.0 A BJIlDING E V 0 auIIDm F X m P K ; GPrwsum Difference Across ExtWoll, Pa
Figure 1 Overall airtightness values
-
all hildings0 0.1 PRESPTT 0.3 0.4 in. of m w 6.0 I I 1 I u V BJIIDING A 0 m I N G B 0 20 40 60 80 160 120
Pressure Diffarcnce Acrom Ext.Woll. Po