HAL Id: hal-01577130
https://hal.archives-ouvertes.fr/hal-01577130
Submitted on 24 Aug 2017HAL is a multi-disciplinary open access archive for the deposit and dissemination of sci-entific research documents, whether they are pub-lished or not. The documents may come from teaching and research institutions in France or abroad, or from public or private research centers.
L’archive ouverte pluridisciplinaire HAL, est destinée au dépôt et à la diffusion de documents scientifiques de niveau recherche, publiés ou non, émanant des établissements d’enseignement et de recherche français ou étrangers, des laboratoires publics ou privés.
Elena, Otmane Lamrabet, A. Willemsen
To cite this version:
Dominique Schneider, Guillaume Beslon, José-Luis Carrasco, Santiago F. Elena, Otmane Lamrabet, et al.. EvoEvo Deliverable 1.5 : Analysis of evolvability (part 2). [Research Report] INRIA Grenoble - Rhône-Alpes. 2016. �hal-01577130�
Page 1 of 14
EvoEvo Deliverable 1.5
Analysis of evolvability (part 2)
Due date: M36
Person in charge: Dominique Schneider
Partner in charge: UJF
Workpackage: WP1 (Experimental observation of EvoEvo in action)
Deliverable description: Analysis of evolvability (part 2): Evolvability: determination of viral adaptive constraints; genetic characterization of the restructuration of bacterial regulatory networks.
Revisions:
Revision no. Revision description Date Person in charge
1.0 E. coli part 15/09/16 O. Lamrabet and D. Schneider (UJF)
2.0 TEV part 05/10/16
A. Willemsen, J.L. Carrasco, S.F.
Elena (CSIC)
Page 2 of 14
Table of Contents
1.
INTRODUCTION 3
2.
1. EVOLVABILITY AT THE POPULATION LEVEL IN THE TEV MODEL 3
2.1.
EXPERIMENTAL SETUP AND FLUORESCENT MARKER STABILITY UPON PASSAGING OF TEV-‐EGFP 4
2.2.
WHOLE-‐GENOME SEQUENCING OF THE EVOLVED LINEAGES 5
2.3.
VIRAL ACCUMULATION AND WITHIN-‐HOST COMPETITIVE FITNESS 7
3.
2. EVOLVABILITY AT THE REGULATORY NETWORK LEVEL IN THE E. COLI MODEL 9
3.1.
IDENTIFICATION OF COMPENSATORY MUTATIONS 9
3.2.
CHARACTERIZATION OF COMPENSATORY MUTATIONS 11
4.
CONCLUSION 13
Page 3 of 14
1. Introduction
A system is said to be evolvable if it can be modified through genetic change in a way that enhances survival and reproduction. For natural selection to act, the system must show heritable phenotypic variation. Yet, genetic robustness implies that the system produces little phenotypic variation in response to genetic variation. Therefore, robustness might limit evolutionary optimization and innovation (Lenski et al., 2006). In this vein, theoretical work has postulated that buffering mechanisms can lead to maladaptation compared to what would be achieved in their absence (Frank, 2007). Also, the analysis of gene expression noise in yeast suggests that noise control may indirectly increase mutational robustness, which might in turn hamper evolvability at the level of gene expression (Lehner, 2008). On the other hand, genetic robustness facilitates the accumulation of neutral or nearly neutral variation by relaxing the intensity of natural selection. This accumulated diversity can become visible to selection upon changes in the environment or genetic background, and thus be the source of evolutionary innovation. Computer simulations on simple population genetics models predict that genetic robustness can sometimes facilitate access to new adaptive peaks provided that occasional failures of robustness mechanisms occur (Kim, 2007). The view that robustness can foster evolvability has also been supported by lattice protein models and PCR-based mutagenesis experiments showing that protein variants with increased thermodynamic stability have increased genetic robustness and are more likely to evolve new catalytic capabilities (Bloom et al., 2006). Task 1.2 will build on the preliminary results of Task 1.1 to study evolvability and its interactions with robustness. It is divided in two sections that will address evolvability at two different levels using the most appropriate experimental model: evolvability at the population level in the TEV model, and at the regulatory network level in the E. coli model.
When between-host selection pressures predominate, theory suggests that high virulence could hinder between-host transmission of microparasites, and that virulence therefore will evolve to lower levels that optimize between-host transmission. Highly virulent microparasites could also curtail host development, thereby limiting both the host resources available to them and their own within-host effective population size. Therefore, high virulence might restrain evolvability. To test this hypothesis, we evolved TEV carrying an eGFP fluorescent marker in Nicotiana benthamiana and Datura stramonium, for which it has a large difference in virulence. We compared the results to those previously obtained in the natural host, Nicotiana tabacum (Zwart et al. 2014), where we have shown that carriage of
eGFP has a high fitness cost. After over half a year of evolution, we have sequenced the
genomes of the evolved lineages and measured their fitness.
2. 1. Evolvability at the population level in the TEV model
As a first exploration of the effects of virulence on microparasite evolution, we evolved TEV in N. benthamiana and D. stramonium. By serially passaging each independent lineage in a single plant, our study maximizes within-host selection. To immediately gauge whether adaptive evolution might be occurring, we passaged a TEV variant expressing a marker
Page 4 of 14 protein (Fig. 1.1), the enhanced GFP (eGFP). This exogenous sequence increases TEV genome to a size just over 10 kb. Upon long-duration passages in N. tabacum, the eGFP is quickly lost due to its strong fitness cost, and its loss is reliably indicated by a loss of eGFP fluorescence (Zwart et al., 2014). Therefore, we can use the time to eGFP loss in the virus population as a real-time indicator of adaptation. To determine the frequency of eGFP loss and host-specific mutations in each viral lineage, the ancestral virus and evolved lineages were sequenced by Illumina. According to the above hypothesis, we expect that adaptive evolution would occur more quickly in the host species for which TEV has lower virulence, D.
stramonium, than in the host species for which it has high virulence, N. benthamiana. Hence,
we expected that in D. stramonium (i) the eGFP marker would be lost more rapidly, (ii) there would be more sequence-level convergent evolution, and (iii) there would be larger increases in within-host competitive fitness. However, the results clashed with these simple hypotheses, exemplifying the extent to which a host species jump can be a game changer for RNA virus evolutionary dynamics.
Fig. 1.1. Schematic representation of TEV-eGFP. The eGFP gene is located between P1
and HC-Pro genes. Proteolytic cleavage sites were provided at both ends of eGFP.
2.1. Experimental setup and fluorescent marker stability upon
passaging of TEV-eGFP
TEV-eGFP was mechanically passaged in N. benthamiana and D. stramonium, as described in (Zwart et al., 2014. In this previous study we noted that 9-week long passages led to rapid deletion of eGFP as well as rapid convergent evolution in N. tabacum. We therefore chose to use similar long passages to maximize the effects of selection in general, and in particular because we intended to use the loss of eGFP as a real time measure of adaptation. Although 9-week passages could be performed in D. stramonium, for N. benthamiana this was not possible due to virus-induced host mortality: plants died after 6 weeks of infection. We performed three 9-week passages in D. stramonium and five 6-week passages in N.
benthamiana. All ten D. stramonium lineages were completed, whereas only 6/10 N. benthamiana lineages were completed. Based on previous results, we expected that the
exogenous eGFP would be rapidly purged (Dolja et al., 1993; Majet et al., 2013; Swart et al., 2014), and as such would serve as a first indicator of the occurrence of TEV adaptation. However, the usefulness of fluorescence for determining the integrity of the eGFP marker was limited in both hosts, by (i) the high levels of autofluorescence in the highly symptomatic
N. benthamiana leaves, and (ii) the patchy fluorescence in the D. stramonium tissue.
Therefore, unlike for TEV-eGFP in N. tabacum, the fluorescent marker was of limited use here. Nevertheless, all N. benthamiana lineages appeared to have some fluorescence until the end of the evolution experiment, and we observed a loss of fluorescence in only 1/10 D.
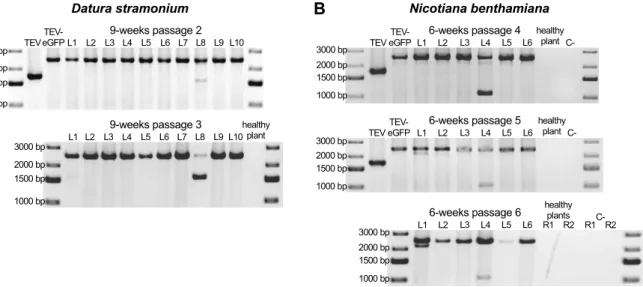
Page 5 of 14 After each passage, RNA was extracted from the collected leaf tissue, and RT-PCR with primers flanking the eGFP insert was performed. This RT-PCR assay can therefore detect deletions in the eGFP, even when deletions extend well into the downstream HC-Pro gene (Zwart et al., 2014). In general, the RT-PCR results confirmed the fluorescence microscopy results: a large deletion was detected only in the one D. stramonium lineage with a loss of fluorescence (Fig. 1.2A; 9-weeks passage 2 L8). This deletion variant went to a high frequency in the subsequent passage (Fig. 1.2A; 9-weeks passage 3 L8). For N.
benthamiana lineages, we did detect a low-frequency deletion in the eGFP in one lineage
(Fig. 1.2B; 6-weeks passage 4 and 5 L4), but this deletion is so large that this variant is most likely no longer capable of autonomous replication. The deletion size is around 1500 nt, which means that after deleting the entire eGFP, around 800 nt are deleted from HC-Pro, which has a size of 1377 nt in total.
Fig. 1.2. Deletion detection in the eGFP gene. Agarose gels with RT-PCR products of the
region encompassing the eGFP gene. The TEV and TEV-eGFP are shown for comparative purposes. The negative controls are healthy plants and PCR controls (C-). (A) TEV-eGFP in D. stramonium has 10 independent lineages (L1-L10). A deletion encompassing the
eGFP gene was detected in one lineage (L8) in the second 9-week passage. This deletion
went to a high frequency in the subsequent passage. (B) TEV-eGFP in N. benthamiana has six independent lineages (L1-L6). A deletion bigger than the size of eGFP was detected in one lineage (L4) in the fourth 6-week passage. This deletion was not fixed in the two subsequent passages. A small deletion was detected in the fifth and sixth 6-week passage in L1.
2.2. Whole-genome sequencing of the evolved lineages
All evolved and the ancestral TEV-eGFP lineages were fully sequenced by Illumina (SRA accession: SRP075180). The deletion observed by RT-PCR (Fig. 1.2A) in one of the D.
stramonium lineages was confirmed by a low number of reads mapping inside the eGFP
gene (median coverage: 111.5), compared to a higher average coverage outside this region (median coverage P1 gene: 19190, median overall genome coverage: 18460). The large deletion included the N-terminal region of HC-Pro, as observed for other deletions that occur after gene insertions before this gene (Zwart et al., 2014; Willemsen et al., 2016). For all other lineages in D. stramonium and N. benthamiana, coverage over the genome was largely
Page 6 of 14 uniform and similar to the ancestral virus population, indicating that there were indeed no genomic deletions present at appreciable frequencies.
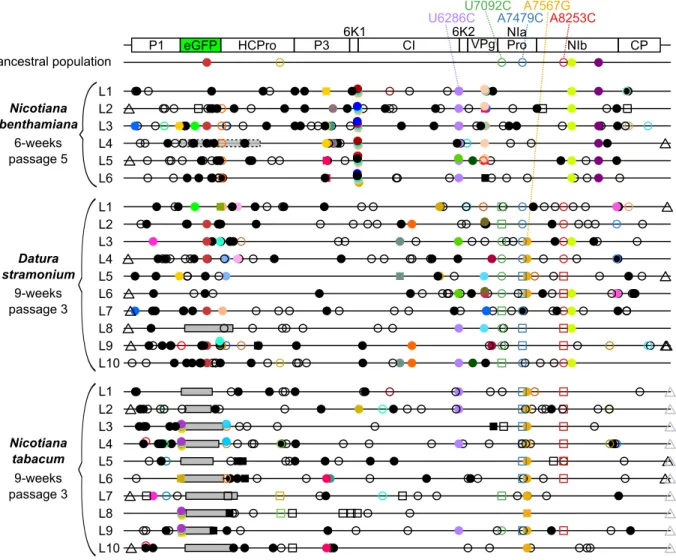
Single nucleotide mutations were detected from a frequency as low as 1%, comparing the evolved TEV-eGFP lineages in N. benthamiana and D. stramonium to the ancestral population (Fig. 1.3). This detection was also performed for evolved TEV-eGFP lineages in
N. tabacum, that were sequenced in a previous study (Zwart et al., 2014). In the evolved N. benthamiana lineages 165 unique mutations were found (median: 34.5, range: 27 - 47). In
the evolved D. stramonium lineages 239 unique mutations were found (median: 31.5; range: 16 - 35). In the evolved N. tabacum lineages, 183 unique mutations were found (median: 21.5; range: 17 - 36). Note that fixed single nucleotide mutations (frequency > 50%) are also detected in the evolved lineages (squared symbols in Fig. 1.3), as the detection was done over the ancestral population. Hence, it allows us to compare the mutations that arose by evolving TEV-eGFP in the different hosts. We detected only one mutation (U6286C; CI/Y2096H) that is shared between all three hosts. The synonymous mutations U7092C, A7479C and A8253C, that are shared between D. stramonium and N. tabacum, are present in the highest number of lineages and reach higher frequencies comparing all shared mutations detected in the three hosts.
Fig. 1.3. Genomes of the TEV-eGFP lineages evolved the three different hosts as
Page 7 of 14 50%) and the circle represent mutations that are not fixed (< 50%). Filled symbols represent nonsynonymous substitutions and open symbols represent synonymous substitutions. The triangles represent mutations that are present in either the 3’UTR or 5’UTR. Black substitutions occur only in one lineage, whereas color-coded substitutions are repeated in two or more lineages. Grey boxes with continuous black lines indicate genomic deletions in the majority variant of the virus population. The grey transparent box with dotted black lines in L4 of N. benthamiana indicates a genomic deletion in a minority variant. The latter box was drawn to indicate the size of the deletion, assuming that the deletion starts at the first position of eGFP.
Host-specific mutations were mostly found in the evolved TEV-eGFP lineages of N.
benthamiana (Fig. 1.3). In this host, a total number of 7 specific mutations were detected, all
of them being nonsynonymous. In D. stramonium no host-specific mutations were detected. And in N. tabacum only one host-specific mutation was detected in the 3’UTR. Note that host specific mutations were defined as mutations detected in at least half of the evolved lineages.
2.3. Viral accumulation and within-host competitive fitness
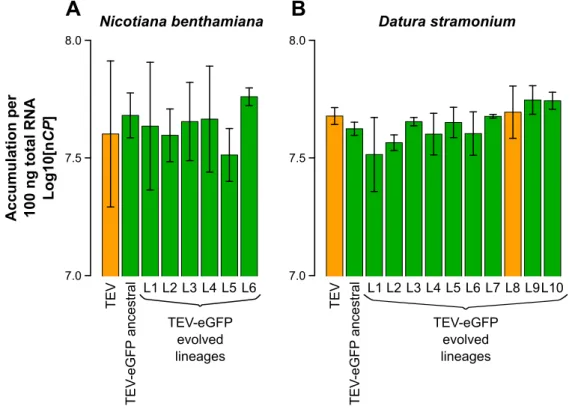
We measured virus accumulation 10 dpi. In both host species, we found no statistically significant differences between TEV, TEV-eGFP and the lineages of TEV-eGFP evolved in that host (Fig. 1.4).
Fig. 1.4. Virus accumulation of the evolved and ancestral lineages. Virus accumulation, as
determined by accumulation experiments and RT-qPCR at 10 dpi, of TEV, the ancestral TEV-eGFP, and the evolved TEV-eGFP lineages in N. benthamiana (A) and D. stramonium (B). TEV and the evolved lineage with a deletion in the eGFP gene (B; L8) are indicated with the orange bars. The ancestral TEV-eGFP and the evolved lineages with an intact eGFP gene are indicated with the green bars. No significant differences between TEV and TEV-eGFP ancestral
Page 8 of 14 were found, nor between these and the evolved lineages (t-test with Holm-Bonferroni correction for multiple tests). Error bars represent SD of the plant replicates.
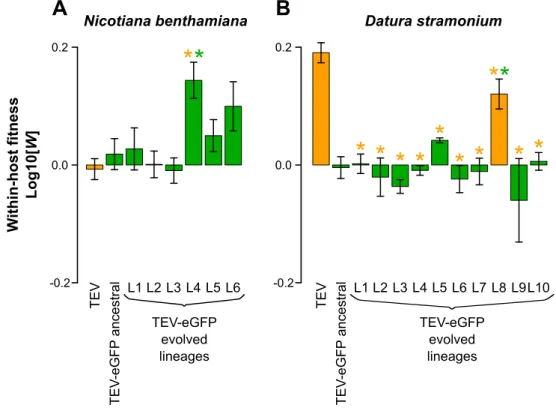
We then measured within-host competitive fitness by means of head-to-head competition experiments against TEV-mCherry (Zwart et al., 2011). Here we observed differences between TEV and TEV-eGFP in the two different hosts. Whereas the TEV-eGFP had lower fitness than the wild-type virus in D. stramonium (Fig. 1.5A), there was no difference in N.
benthamiana (Fig. 1.5B). Our results therefore suggest that although there is a fitness cost
associated with the eGFP gene in N. tabacum (Zwart et al., 2014) and D. stramonium, there is none in N. benthamiana.
For only 1/10 of the evolved lineages in D. stramonium, we observed a significant increase in competitive fitness compared to the ancestral TEV-eGFP (Fig. 1.5A, L8). This lineage is the only one to have a deletion in the eGFP. In N. benthamiana, 1/6 lineages had a significant increase in within-host fitness (Fig. 1.5B, L4). However, this increase in fitness probably is not associated with the large genomic deletion. Moreover, another lineage of N.
benthamiana, where we did not detect any deletion, also appeared to have increased in
fitness (Fig. 1.5B, L6), however, after the Holm-Bonferroni correction not significantly. Interestingly, the lineage that did increase its fitness significantly (L4) is the only lineage that contains mutations in the 6K2 protein in this host. Therefore, we speculate that single-nucleotide variation is one of the main driving forces for an increase in TEV-eGFP fitness in
N. benthamiana.
Fig. 1.5. Within-host competitive fitness of the evolved and ancestral lineages. Fitness (W)
determined by competition experiments and RT-qPCR of the different viral genotypes with respect to a common competitor; TEV-mCherry. W was determined at 10 dpi, of TEV, the ancestral TEV-eGFP, and the evolved TEV-eGFP lineages in N. benthamiana (A) and D.
Page 9 of 14 indicated with the orange bars. The ancestral TEV-eGFP and the evolved lineages with an intact eGFP gene are indicated with the green bars. The orange asterisks indicate statistical significant differences of the evolved lineages as compared to TEV (t-test with Holm-Bonferroni correction for multiple tests). The green asterisks indicate statistical significant differences of the evolved lineages as compared to the ancestral TEV-eGFP (t-test with Holm-Bonferroni correction for multiple (t-tests). Not indicated in the figure is that TEV and TEV-eGFP ancestral tested significantly different in D. stramonium (B; t-test:
t4 = 13.438, P < 0.001) while not in N. benthamiana (A; t-test: t4 = −1.389, P = 0.237). Error
bars represent SD of the plant replicates.
3. 2. Evolvability at the regulatory network level in the E. coli model
During a long-term evolution experiment (LTEE), twelve populations are propagated by daily transfers from a common Escherichia coli ancestor for more than 60,000 generations in a constant glucose-limited environment. Adaptation of E. coli during the LTEE has been shown to involve the rewiring of global regulatory networks (Hindré et al., 2012). In particular, the CRP-controlled regulon has been shown to be increasingly important during evolution (Cooper et al., 2008). Deletions of the global regulatory crp gene have been introduced in both the ancestor of the LTEE and two independently evolved clones, one sampled from each of two of the twelve populations after 20,000 generations (Cooper et al., 2008). Deleting
crp had a much more dramatic effect on both the growth in the evolution environment and
the global transcription profile of the two evolved clones than of the ancestor. Because the sequence of the crp gene was unchanged after 20,000 generations during evolution, these differences indicated epistatic interactions between crp and mutations at other loci that accumulated during evolution (Cooper et al., 2008).
This deliverable included evolution experiments that used strains constructed during the previous tasks to study evolvability at the regulatory network level in the E. coli experimental model. The objective will be to characterize the genetic restructuration of bacterial regulatory networks. We propagated crp-deleted strains in environments, determined during Task 1.1, in which they have large fitness defects (D1.3, due at M20). We selected evolved clones with restored fitness (D1.4, du at M22) and sequenced their genome to investigate the underlying molecular mechanisms (D1.5, due at M36). These experiments allow us to understand how regulatory networks can be rewired after perturbation to provide new adaptive abilities to bacterial cells.
3.1. Identification of compensatory mutations
Four crp-deleted strains were propagated by daily transfers for 100 generations in DM1000. The four genetic backgrounds in which crp was deleted and that were used here are: the ancestor clone (Anc), one 2000-generation evolved clone from each of the Ara-1 (1164A) and Ara+1 (1158C) populations, and the ancestral clone in which we moved the Ara-1 topA allele (AnctopA-1) that interferes with the crp deletion (see Deliverable 1.2 section 2.2.3). Five replicate populations were propagated for each of the four strains. Mixed populations were sampled after 33, 66 and 100 generations and frozen at -80°C. Moreover, 3 individual clones were isolated from the 100-generation mixed population and also frozen at -80°C. The growth defects associated with the crp deletion were restored after 100 generations of evolution in all genetic backgrounds (see D1.3 and D1.4).
Page 10 of 14 To identify compensatory mutations allowing the growth restoration of the crp-deleted strains, we selected three 100-generation evolved clones from the AnctopA-1
Δcrp strain (AnctopA -1
Δcrp-1A, AnctopA-1Δcrp-4A, and AnctopA-1Δcrp-5C), and four 100-generation evolved clones from the 1158CΔcrp strain (1158CΔcrp-1A, 1158CΔcrp-2B, 1158CΔcrp-3C, and 1158CΔcrp-5A). We extracted genomic DNA from each of these 7 clones. Their genome sequences were determined and analyzed using the Breseq pipeline (Deatherage & Barrick. 2014). We identified the mutations that were substituted during evolution and that may be involved in the restoration of the growth rate defects associated with the crp deletion (Table 1). A high level of parallelism was observed with mutations identified in identical genes in several independently evolved clones from different ancestral strains. In particular, we observed mutations in the promoter regions of ptsG, involved in glucose transport (Shin et al., 2003; Jahreis et al., 2008) and manX, encoding a secondary glucose transporter (Plumbridge, 2002). We then sequenced ptsG and manX in the other evolved crp-deleted clones and found additional mutations in ptsG. In total, mutations in ptsG were found in 16 of the 18 evolved crp-deleted clones that were analysed, including 14 mutations in the ptsG promoter region and 2 in the coding region (Table 1). No additional mutation was found in
manX. Thus, it was highly likely that these mutations compensated the crp deletion, resulting
in increased fitness in the evolution environment.
Table 1: Mutations identified in evolved clones after 100 generations of evolution of
crp-deleted strains
Ancestor Evolved clones Gene Type Change Gene function
AncΔcrp AncΔcrp-‐1C ptsG SNP C-‐>T glucose PTS permease AncΔcrp-‐2A ptsG SNP C-‐>T AncΔcrp-‐3C ptsG SNP C-‐>T AncΔcrp-‐4A ptsG SNP C-‐>T AncΔcrp-‐5C ptsG SNP C-‐>T 1158CΔcrp 1158CΔcrp-‐1A* ptsG Deletion Δ15 bp glucose PTS permease 1158CΔcrp-‐2B* ptsG SNP C-‐>A
1158CΔcrp-‐3C* yeeJ IS_Insertion IS150 adhesin 1158CΔcrp-‐4A pstG Insertion 2 bp
glucose PTS permease 1158CΔcrp-‐5A* ptsG SNP C-‐>A
yihS IS_Insertion IS150 sulfoquinovose isomerase
1164AΔcrp 1164AΔcrp-‐2A ptsG SNP C-‐>T (A7V)** glucose PTS permease 1164AΔcrp-‐4C ptsG SNP G-‐>A 1164AΔcrp-‐5C ptsG SNP T-‐>C AnctopA-‐1Δcrp AnctopA-‐1Δcrp-‐1A* ptsG SNP C-‐>T glucose PTS permease AnctopA-‐1Δcrp-‐2A ptsG SNP G-‐>A (A5T)**
AnctopA-‐1Δcrp-‐3B ptsG Deletion Δ37 bp
AnctopA-‐1Δcrp-‐4A* manX SNP A-‐>G mannose PTS permease AnctopA-‐1Δcrp-‐5C* ptsG SNP C-‐>T glucose PTS permease *for these evolved clones, the entire genome was sequenced. For the other evolved clones, only the two ptsG and
manX genes were sequenced. **in these two cases, the mutation affected the coding region of ptsG. Therefore,
the corresponding amino-‐acid change is given in parentheses.
Page 11 of 14
3.2. Characterization of compensatory mutations
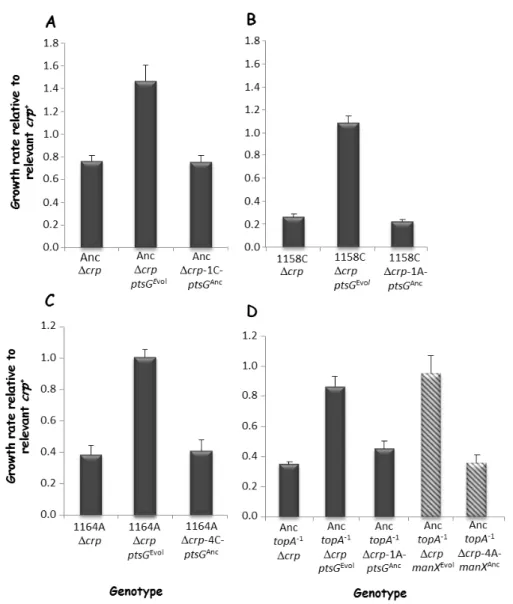
To demonstrate their involvement in growth restoration, candidate mutations in the promoter regions of ptsG and manX, isolated from different evolved crp-deleted clones, were introduced by allelic exchange into the corresponding crp-deleted clone that was used as ancestor of the 100-generation evolution experiment. We then measured the growth rate of each constructed strain compared to the corresponding ancestor strain (Fig. 2.1). After introduction of the different mutations, the growth rate was increased and similar to the one of the evolved clones (Fig. 2.1). The opposite experiments were also performed where the evolved ptsG and manX alleles were replaced by their ancestral counterparts in the crp-deleted evolved clones (Fig. 2.1). These replacements decreased the growth rates. Therefore, these mutations are responsible for growth restoration after deletion of crp.
Fig. 2.1. Effect of evolved ptsG and manX alleles on growth rates in DM1000. (A)
AncΔcrp and isogenic construct except for ptsG. (B) 1158CΔcrp and isogenic constructs except for ptsG. (C) 1164AΔcrp and isogenic construct except for ptsG. (D) AnctopA
-1
Δcrp and isogenic constructs except for manX (hatched histograms) or ptsG. The relative growth rate of each crp-deleted strain and derived isogenic constructed strains is given
Page 12 of 14 compared to the corresponding parental crp+ strain. Data are means from three independent experiments, with error bars showing standard errors.
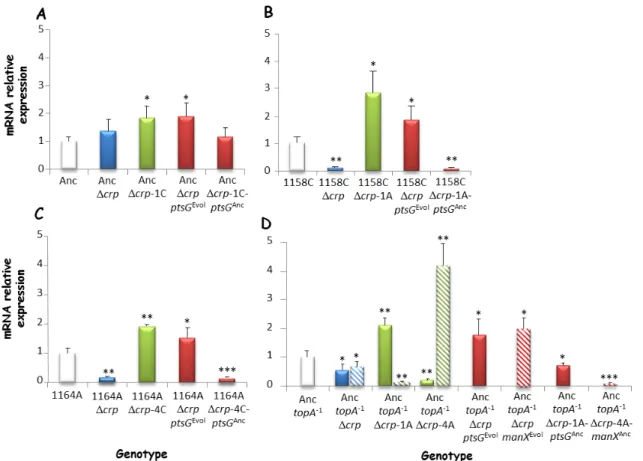
We then wanted to know the molecular mechanisms underlying the restoration of growth associated with these mutations. Since most ptsG and manX mutations occurred in the promoter regions and affected sites known to be bound by transcription factors such as Mlc and Fis (Shin et al., 2003; Plumbridge 2000), we investigated the effects of these mutations on the transcription level of ptsG and manX. Interestingly, we observed a significant increase of the transcriptional level of ptsG and manX in evolved clones and in the constructed strains bearing the evolved alleles compared to their direct ancestor (Fig. 2.2). Higher expression of each of the two genes can therefore explain the restoration of the growth rate after deletion of crp.
Fig. 2.2. Expression levels of the ptsG and manX genes. Transcription levels were
measured by quantitative real-time PCR (qRT-PCR) for the four crp-deleted strains (blue), derived evolved clones (green), and isogenic constructs (red). They are given relative to the relevant parental strain not deleted for crp (white histograms): (A) Anc, (B) 1158C, (C) 1164A, and (D) AnctopA-1. The qRT-PCR experiments were performed on cDNAs produced using equal amounts of total RNAs. Data are means from three independent experiments, with error bars showing standard errors. *p < 0.05, **p < 0.005, ***p < 0.0005.
Since ptsG is involved in glucose transport, we measured the uptake rate for the evolved and constructed strains using the alpha-methyl-glucoside (α-MGlc) glucose analogue (Manché et al., 1999). The different mutations in ptsG resulted in a significant increase in glucose uptake. Therefore, our results explain how these mutations restored the growth rate of
crp-Page 13 of 14 deleted strains after 100 generations of evolution. These mutations increased the uptake of glucose that was presumably highly altered after the deletion of crp. Moreover, this mechanism is universal since it occurred in four different genetic backgrounds.
4.
Conclusion
• The results of the TEV evolution experiments do not lend support to the hypothesis that high virulence impedes microparasites’ evolution. Rather, they exemplify that jumps between host species can be game changers for evolutionary dynamics. When considering the evolution of genome architecture, host species jumps might play a very important role, by allowing evolutionary intermediates to be competitive.
• We demonstrated here that regulatory networks are highly evolvable in bacteria. Indeed, deletion of a central hub of regulatory networks, namely crp, in four genetic backgrounds resulted in strong growth alteration in a glucose environment. This growth alteration was readily reversed after only 100 generations of evolution in that environment. We isolated evolved clones and sequenced their genomes to identify the mutations that may be responsible for that growth restoration. This allowed us to understand how evolvable regulatory networks are and to determine the molecular mechanisms allowing the rewiring of regulatory networks. The compensatory mutations affected a small number of genes, all involved in glucose uptake. The mutations had a strong regulatory effect by increasing the transcription of these target genes, thereby allowing for a strong increase in glucose uptake.
• Therefore, rewiring of perturbed regulatory networks involves additional regulatory changes that influence and restore the altered phenotype that was associated with the initial genetic perturbation.
5. References
Bloom JD, Labthavikul ST, Otey CR, Arnold FH. 2006. Protein stability promotes evolvability.
Proc. Natl. Acad. Sci. USA 103(15):5869-5874.
Cooper TF, Remold SK, Lenski RE, Schneider D. 2008. Expression profiles reveal parallel evolution of epistatic interactions involving the CRP regulon in Escherichia coli. PLoS Genet. 4: e35.
Deatherage DE, Barrick JE. 2014. Identification of mutations in laboratory evolved microbes from next-generation sequencing data using breseq. Methods Mol Biol 1151:165–188.
Dolja VV, Herndon KL, Pirone TP, Carrington JC. 1993. Spontaneous mutagenesis of a plant potyvirus genome after insertion of a foreign gene. J Virol 67:5968–5975.
Frank SA. 2007. Maladaptation and the paradox of robustness in evolution, PLoS ONE 2:e1021.
Hindré T, Knibbe C, Beslon G, Schneider D. 2012. New insights into bacterial adaptive abilities by in vivo and in silico experimental evolution. Nat. Rev. Microbiol. 10: 352-365.
Page 14 of 14 Jahreis K, Pimentel-Schmitt EF, Bruckner R, Titgemeyer F. 2008. Ins and outs of glucose transport systems in eubacteria. FEMS Microbiol Rev 32:891–907.
Kim Y. 2007. Rate of adaptive peak shifts with partial genetic robustness, Evolution 61(8):1847-1856.
Lehner B. 2008. Selection to minimise noise in living systems and its implications for the evolution of gene expression. Mol. Syst. Biol. 4:170.
Lenski RE, Barrick JE, Ofria C. 2006, Balancing robustness and evolvability. PLoS Biol. 4:e428.
Majer E, Daròs JA, Zwart M. 2013. Stability and fitness impact of the visually discernible Rosea1 marker in the Tobacco etch virus genome. Viruses 5:2153–2168.
Manché K, Notley-McRobb L, Ferenci T (1999) Mutational Adaptation of Escherichia coli to Glucose Limitation Involves Distinct Evolutionary Pathways in Aerobic and Oxygen-Limited Environments. Genetics 153(1):5-12.
Plumbridge J. 2002. Regulation of gene expression in the PTS in Escherichia coli: the role and interactions of Mlc. Curr Opin Microbiol 5:187–193.
Shin D, Cho N, Heu S, Ryu S. 2003. Selective Regulation of ptsG Expression by Fis. J Biol
Chem 278:14776-8.
Willemsen A, Zwart MP, Tromas N, Majer E, Daros JA, Elena SF. 2016. Multiple barriers to the evolution of alternative gene orders in a positive-strand RNA virus. Genetics 202:1503– 1521.
Zwart MP, Daròs JA, Elena SF. 2011. One is enough: in vivo effective population size is dose-dependent for a plant RNA virus. PLoS Pathog 7:e1002122.
Zwart MP, Willemsen A, Daros J-A, Elena SF. 2014. Experimental evolution of pseudogenization and gene loss in a plant RNA virus. Mol Biol Evol 31:121–134.