HAL Id: hal-00304041
https://hal.archives-ouvertes.fr/hal-00304041
Submitted on 18 Mar 2008HAL is a multi-disciplinary open access
archive for the deposit and dissemination of sci-entific research documents, whether they are pub-lished or not. The documents may come from teaching and research institutions in France or abroad, or from public or private research centers.
L’archive ouverte pluridisciplinaire HAL, est destinée au dépôt et à la diffusion de documents scientifiques de niveau recherche, publiés ou non, émanant des établissements d’enseignement et de recherche français ou étrangers, des laboratoires publics ou privés.
Source-receptor relationships between East Asian sulfur
dioxide emissions and Northern Hemisphere sulfate
concentrations
J. Liu, D. L. Mauzerall, L. W. Horowitz
To cite this version:
J. Liu, D. L. Mauzerall, L. W. Horowitz. Source-receptor relationships between East Asian sulfur diox-ide emissions and Northern Hemisphere sulfate concentrations. Atmospheric Chemistry and Physics Discussions, European Geosciences Union, 2008, 8 (2), pp.5537-5561. �hal-00304041�
ACPD
8, 5537–5561, 2008Source-receptor relationships for East
Asian sulfate J. Liu et al. Title Page Abstract Introduction Conclusions References Tables Figures ◭ ◮ ◭ ◮ Back Close
Full Screen / Esc
Printer-friendly Version Interactive Discussion
Atmos. Chem. Phys. Discuss., 8, 5537–5561, 2008 www.atmos-chem-phys-discuss.net/8/5537/2008/ © Author(s) 2008. This work is distributed under the Creative Commons Attribution 3.0 License.
Atmospheric Chemistry and Physics Discussions
Source-receptor relationships between
East Asian sulfur dioxide emissions and
Northern Hemisphere sulfate
concentrations
J. Liu1, D. L. Mauzerall1, and L. W. Horowitz2
1
Woodrow Wilson School of Public and Int. Affairs, Princeton Univ., Princeton, NJ, USA
2
Geophysical Fluid Dynamics Laboratory, Princeton, NJ, USA
Received: 18 January 2008 – Accepted: 13 February 2008 – Published: 18 March 2008 Correspondence to: D. L. Mauzerall ([email protected])
ACPD
8, 5537–5561, 2008Source-receptor relationships for East
Asian sulfate J. Liu et al. Title Page Abstract Introduction Conclusions References Tables Figures ◭ ◮ ◭ ◮ Back Close
Full Screen / Esc
Printer-friendly Version Interactive Discussion
Abstract
We analyze the effect of varying East Asian (EA) sulfur emissions on sulfate concen-trations in the Northern Hemisphere, using a global coupled oxidant-aerosol model (MOZART-2). We conduct a base and five sensitivity simulations, in which sulfur emis-sions from each continent are tagged, to establish the source-receptor (S-R)
relation-5
ship between EA sulfur emissions and sulfate concentrations over source and down-wind regions. We find that from west to east across the North Pacific, EA sulfate con-tributes approximately 80%–20% of sulfate at the surface, but at least 50% at 500 hPa. In addition, EA SO2 emissions account for approximately 30%–50% and 10%–20%
of North American background sulfate over the western and eastern US, respectively.
10
The contribution of EA sulfate to the western US at the surface is highest in MAM and JJA, but is lowest in DJF. Reducing EA SO2 emissions will significantly decrease the
spatial extent of the EA sulfate influence over the North Pacific both at the surface and at 500 mb in all seasons, but the extent of influence is insensitive to emission in-creases, particularly in DJF and JJA. We find that EA sulfate concentrations over most
15
downwind regions respond nearly linearly to changes in EA SO2emissions, but sulfate
concentrations over the EA source region increase more slowly than SO2 emissions, particularly at the surface and in winter, due to limited availability of oxidants (mostly H2O2). We find that similar estimates of the S-R relationship for trans-Pacific transport
of EA sulfate would be obtained using either sensitivity or tagging techniques. Our
find-20
ings suggest that future changes in EA sulfur emissions may cause little change in the sulfate induced health impact over downwind continents but SO2emission reductions
may significantly reduce the sulfate related climate cooling over the North Pacific and the United States.
ACPD
8, 5537–5561, 2008Source-receptor relationships for East
Asian sulfate J. Liu et al. Title Page Abstract Introduction Conclusions References Tables Figures ◭ ◮ ◭ ◮ Back Close
Full Screen / Esc
Printer-friendly Version Interactive Discussion
1 Introduction
Sulfate aerosol is an important component of fine particulate matter (PM2.5, diameter
≤2.5 µm), which is associated with increased risk of adverse health outcomes including premature mortality (Pope et al., 2002; Pope et al., 2004). In addition, sulfate aerosols scatter sunlight, reduce visibility, affect regional climate, and harm ecosystems
(Gun-5
ther, 1992; Giorgi et al., 2003; Park et al., 2004; Marmer et al., 2007; Koch et al., 2007a). Sulfate aerosols are produced by gas phase oxidation of SO2 by OH radicals and by aqueous phase oxidation of SO2 by H2O2 (Martin and Damschen, 1981) and
O3 (Feichter et al., 1996). Since most anthropogenic sulfate is produced by
oxida-tion of SO2, many industrialized nations have stringently regulated SO2 emissions to
10
protect human health and ecosystems (Dutkiewicz et al., 2000; Moldan et al., 2001). However, the benefits of sulfur emission control partly depend on the linearity of the source-receptor (S-R) relationship between SO2emissions and sulfate concentrations (Oppenheimer et al., 1985; Dutkiewicz et al., 2000). Generally, the relationship be-tween SO2 emissions and sulfate concentrations is linear near minor SO2 sources,
15
but nonlinear near major SO2sources because of limited availability of oxidants (Hilst, 1992; Berglen et al., 2004).
Due to rapid industrialization, anthropogenic SO2 emissions from East Asia (EA),
particularly China, have increased substantially in recent decades and are projected to increase further by nearly 50% between 1990 and 2030 (Klimont et al., 2001).
How-20
ever, China has realized that it is urgent to mitigate SO2emissions and has designed
the Acid Rain Control Zone and SO2Pollution Control Zone Program (i.e. the Two Con-trol Zone Strategy) to efficiently conCon-trol sulfur pollution (Hao et al., 2001). Therefore, future SO2 emissions from EA are highly uncertain and significant increases or
de-creases are possible (Streets, 2007). These changes underscore the need to establish
25
quantitative S-R relationships between EA SO2 emissions and sulfate concentrations
over source and downwind regions.
ACPD
8, 5537–5561, 2008Source-receptor relationships for East
Asian sulfate J. Liu et al. Title Page Abstract Introduction Conclusions References Tables Figures ◭ ◮ ◭ ◮ Back Close
Full Screen / Esc
Printer-friendly Version Interactive Discussion
sulfur from fuels (e.g., replacing high-sulfur with low-sulfur coal; removing sulfur from gasoline) and reducing end-of-pipe emissions (e.g., installing scrubbers) (Conrad and Kohn, 1996; NAPAP, 2005; Carlson et al., 2000). These strategies have been widely used in the US to reduce SO2emissions (Carlson et al., 2000), and are believed to be
the affordable strategies by the Two Control Zone Program to mitigate SO2 emissions
5
in China (Hao et al., 2001). Unlike improving energy efficiency (which reduces energy use), reducing SO2 emissions by using low-sulfur coal or scrubbers does not reduce
other pollutants, such as NOx and VOCs (which are the precursors for atmospheric oxidants, such as OH, O3, H2O2) or carbon dioxide (CO2) the primary greenhouse
gas. Therefore, in this study we only change SO2emissions and leave the emissions
10
of other chemical species unchanged.
Two techniques are used by the atmospheric modeling community to establish the effect of regional emissions on global concentration distributions, namely tagging emis-sion tracers (Liu and Mauzerall, 2005, 2007; Liu et al., 2005) and conducting sensitivity studies (Chin et al., 2007; Park et al., 2004; Koch et al., 2007b; Heald et al., 2006).
15
The results using these two approaches can differ depending on the linearity of the chemical conversion of SO2to sulfate between the source and receptor regions. In this study, we use a coupled tagging-sensitivity approach to quantify the S-R relationship and compare the difference between these two techniques. Our objectives are: (1) to determine the effect of potential future increases or decreases in EA SO2 emissions
20
on sulfate concentrations over downwind regions (Sect. 3); (2) to quantify the linearity of the S-R relationship between EA SO2emissions and sulfate concentrations globally
(Sect. 4); and (3) to compare the source-receptor relationships obtained using tagging and sensitivity studies (Sect. 5).
2 Methods
25
We use the three-dimensional global chemical oxidant-aerosol (fully coupled) transport model MOZART-2 (Model of Ozone and Related Tracers, version 2) (Horowitz et al.,
ACPD
8, 5537–5561, 2008Source-receptor relationships for East
Asian sulfate J. Liu et al. Title Page Abstract Introduction Conclusions References Tables Figures ◭ ◮ ◭ ◮ Back Close
Full Screen / Esc
Printer-friendly Version Interactive Discussion
2003) driven with NCEP/NCAR reanalysis meteorology to simulate inter-continental transport of sulfate aerosols. The model is configured with a T62 (1.9◦×1.9◦) horizontal resolution and 28 hybrid vertical levels from the surface to 2.7 mb. Standard MOZART-2 emission inventories are used which represent global emissions in the early 1990s (Olivier, 1996; Horowitz et al., 2003). The sulfur emissions from EA account for
ap-5
proximately 21% of global total sulfur emissions. Detailed descriptions of the model and model evaluation are provided by Horowitz et al. (2003; 2006), Tie et al. (2005) and Ginoux et al. (2006).
MOZART-2 simulates sulfate production including both gas phase oxidation of SO2
by OH radicals and aqueous phase oxidation of SO2by H2O2(Martin and Damschen,
10
1981) and O3 (Feichter et al., 1996). In addition, naturally produced dimethyl sulfide (DMS) is oxidized to SO2by gas-phase reactions with OH and NO3radicals. Aqueous
oxidation of SO2 to sulfate depends on cloud water content and acidity, temperature,
and abundance of oxidizing agents (namely H2O2 and O3). When clouds are present, MOZART-2 first predicts the pH values based on the mixing ratios of SO2, CO2, HNO3,
15
sulfate, and NH3. It then uses the predicted pH and temperature to calculate the
tem-perature dependent effective Henry’s Law coefficients and aqueous reaction rate co-efficients (Tie et al., 2005). When the cloud pH is below 5, the reaction rate between SO2 and H2O2 is much faster than that between SO2 and O3 (Brasseur et al., 1999;
Seinfeld and Pandis, 1998). Removal processes for sulfur species include both dry
20
deposition and wet scavenging. The dry deposition velocities for SO2are from Feichter
et al. (1996) and are much faster over ocean (0.8 cm/s) and land (0.6 cm/s) than over snow (0.2 cm/s). The dry deposition velocities for sulfate are 0.2 cm/s (Feichter et al., 1996) over all surfaces. Wet deposition includes both in-cloud rainout and below cloud washout (Horowitz et al., 2003). In MOZART-2, the wet deposition rate for SO2is set
25
equal to that of H2O2. For sulfate, the wet deposition rates are set to 20% of that for the highly soluble gas HNO3(Horowitz, 2006).
In this study, we quantify S-R relationships using a coupled approach including tagged tracers and sensitivity simulations. We first conduct a baseline simulation with
ACPD
8, 5537–5561, 2008Source-receptor relationships for East
Asian sulfate J. Liu et al. Title Page Abstract Introduction Conclusions References Tables Figures ◭ ◮ ◭ ◮ Back Close
Full Screen / Esc
Printer-friendly Version Interactive Discussion
standard sulfur emissions. We then conduct five sensitivity simulations with anthro-pogenic sulfur emissions from EA reduced by 80%, 50%, 20%, and increased by 20% and 50% relative to the base simulation. In all cases, we tag the anthropogenic emis-sions of SO2 from the ten continental regions including North America (NA), South
America (SA), Europe (EU), the Former Soviet Union (FSU, excluding part of Russia
5
in the European domain), Africa (AF), Indian Subcontinent (IN), East Asia (EA), South-east Asia (SE), Australia (AU), and the Middle East (ME) as shown in Fig. 1 and track their conversion to sulfate (SO2−4 ). Each simulation covers the 2-yr period from 1990 to 1991 with the first year used for initialization.
Since this study uses meteorological inputs from the NCEP reanalysis (rather than
10
MACCM-3 as in Horowitz et al., 2003), we then evaluate simulated aerosol concentra-tions by comparing the model results with various observaconcentra-tions for sulfate, including the data collected by the Rosenstiel School of Marine and Atmospheric Science (RSMAS) at the University of Miami (Prospero, 1996) and by regional observation networks, namely the Interagency Monitoring of Protected Visual Environments (IMPROVE) in
15
the United States (http://vista.cira.colostate.edu/IMPROVE/), the Cooperative Program for Monitoring and Evaluation of the Long-range Transmission of Air Pollutants in Eu-rope (EMEP: http://www.emep.int), and the East Asian Monitoring Network (EANET:
http://www.eanet.cc). We average observations over 1980s–1990s for RSMAS data, over 1990 to 1992 for IMPROVE and EMEP data, and over 2000 to 2004 for EANET
20
(since many EANET observation stations did not begin to report data until 2003). Fig-ure 2 compares the MOZART-2 simulated sulfate concentrations with global tion networks. The MOZART-2 results are generally in good agreement with observa-tions, with annual mean sulfate concentrations within a factor of 2 of observations at 80% of the global stations considered.
ACPD
8, 5537–5561, 2008Source-receptor relationships for East
Asian sulfate J. Liu et al. Title Page Abstract Introduction Conclusions References Tables Figures ◭ ◮ ◭ ◮ Back Close
Full Screen / Esc
Printer-friendly Version Interactive Discussion
3 Global contribution of sulfate aerosol from EA
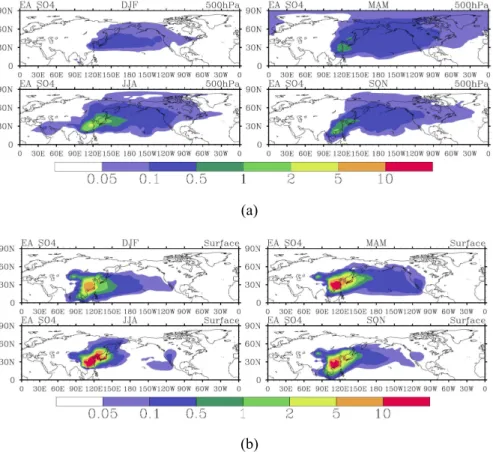
The simulated surface concentrations of EA sulfate (SO2−4 ) range from more than 10 µg m−3 over EA to less than 0.5 µg m−3 over the western US (Fig. 3). Seasons associated with relatively high EA sulfate concentrations at the surface over the south-western US (>0.1 µg m−3) are MAM (the northern hemispheric spring) and JJA (the
5
northern hemispheric summer). This differs from our previous findings, using idealized tracers, that trans-Pacific transport is strongest in winter-spring and weakest in sum-mer (Liu et al., 2005; Liu and Mauzerall, 2005) . Comparing Fig. 3a and b, in sumsum-mer the transport of EA sulfate to the central Pacific is weak at the surface but very strong at 500 mPa where strong westerlies prevail. The summer high EA sulfate
concentra-10
tion over the western US is the net result of a series of processes, including stronger convective transport over EA, faster sulfate production, faster wet removal, slower sur-face transport, and stronger subsidence (within summer highs) over the western US in summer than in winter. Most recent field work examining trans-Pacific transport (e.g. the 2002 Intercontinental Transport and Chemical Transformation campaign) and
mod-15
eling research (e.g. Heald et al., 2006) has focused on spring. Our finding suggests that additional investigation of EA influence on sulfate concentrations over the western US in summer may be worthwhile.
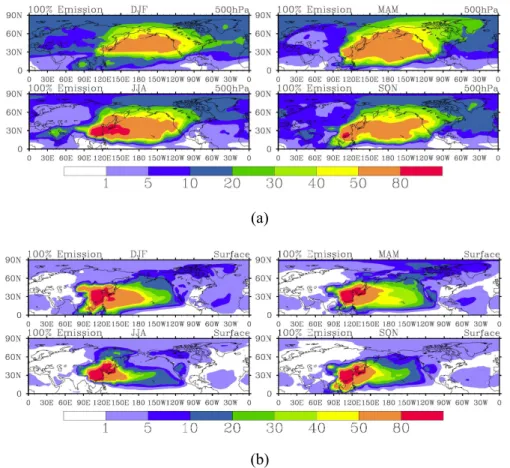
Figure 4 shows the fractional contribution of sulfate concentrations from EA in the base simulation each season. From west to east across the North Pacific, EA sulfate
20
contributes from 80% to 20% of total sulfate at the surface, but contributes at least 50% at 500 hPa. This indicates that EA sulfate is the dominant source of sulfate over the Pacific Ocean, particularly in the free troposphere. Sulfate aerosols directly scatter solar radiation and increase the albedo of clouds. They thus cool the Pacific air mass which could influence regional climate over the western US Investigation into linkages
25
between changing EA sulfate concentrations over the North Pacific and their impact on US climate would be valuable. Over the surface of the US, EA sulfate contributes more than 10% of total sulfate over the western US in MAM and JJA, but its influence is
ACPD
8, 5537–5561, 2008Source-receptor relationships for East
Asian sulfate J. Liu et al. Title Page Abstract Introduction Conclusions References Tables Figures ◭ ◮ ◭ ◮ Back Close
Full Screen / Esc
Printer-friendly Version Interactive Discussion
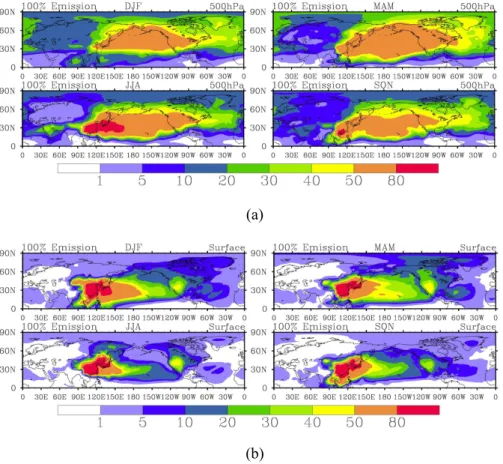
negligible over the eastern (<1%) due to the dominance of domestic sources (Fig. 4). Figure 5 shows the fractional contribution of the North American background sulfate (i.e., total sulfate concentrations minus NA sulfate concentrations) from EA. At the sur-face, EA sulfate accounts for 30%–50% and 10%–20% of background sulfate over the western and eastern US, respectively. Due to the differences in model use, emission
5
inventories and meteorological input, as well as the definition of “background sulfate” and “East Asian sources”, our result differs slightly from that of Park et al. (2004), who find that total East Asian pollution accounts for 30% of background sulfate over both western and eastern US At 500 mPa, EA sulfate accounts for more than 50% of NA background sulfate over the US (Fig. 5a).
10
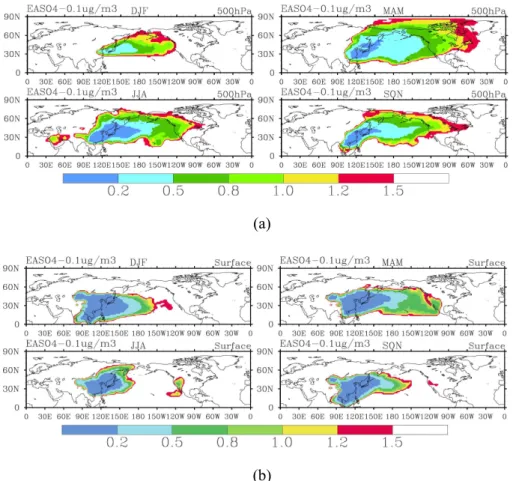
Figure 3 shows areas over the western US at both the surface and 500 hPa where for standard EA SO2emissions EA sulfate concentrations are at least 0.1 µg m−3(AEA0.1),
particularly in MAM and JJA. Figure 6 illustrates how the AEA0.1 changes with
in-creases/decreases in EA SO2 emissions. At the surface, the spatial extent of AEA0.1 is constrained to the North Pacific and is sensitive to EA emissions between 20% and
15
80% of standard EA emissions. Therefore, a decrease of EA SO2emissions will
signif-icantly decrease the spatial extent of EA sulfate over the surface of the North Pacific, but an increase in emissions will not significantly increase the horizontal extent of EA sulfate at the surface. The eastern boundary of AEA0.1 reaches the western US at
the surface only when EA SO2 emissions are larger than half of the standard
emis-20
sions (especially in MAM and JJA). Since most EA sulfate at low altitudes is efficiently removed by wet and dry deposition during transport over the North Pacific, further in-creases in EA sulfur emissions will not significantly increase sulfate concentrations at the surface over the US These results are supported by the measurements reported in Jaffe et al. (2005) and Prospero et al. (2003) which indicate that samples from Midway
25
Island in the North Pacific are significantly more influenced by Asian industrial sources of sulfur than measurements at Crater Lake in Oregon. This implies that a substantial loss of sulfate from Asian sources occurs over the Pacific Ocean due to precipitation scavenging. At 500 hPa (Fig. 6a), where sulfate removal is slower, increasing EA
emis-ACPD
8, 5537–5561, 2008Source-receptor relationships for East
Asian sulfate J. Liu et al. Title Page Abstract Introduction Conclusions References Tables Figures ◭ ◮ ◭ ◮ Back Close
Full Screen / Esc
Printer-friendly Version Interactive Discussion
sions cause the eastern boundary of AEA0.1 to expand from the western Pacific (20%
EA emissions) to the eastern US (150% EA emissions), particularly in MAM and SON. In addition, the spatial extent of AEA0.1 at 500 hPa is approximately twice as large as
that at the surface in JJA. These findings suggest that future changes in EA sulfur emissions may cause little change in sulfate induced health effects over the US but
5
may cause a significant change in the sulfate related climate impact over the North Pacific and the western US
4 Linearity of the S-R relationship
The linearity between SO2 emissions and sulfate concentrations is of importance to
both policymakers interested in reducing the impacts of sulfate exposure and scientists
10
eager to understand the oxidation rate of SO2 which depends on the concentrations of H2O2, OH, and O3. Here we quantitatively investigate the linearity of the response
of sulfate concentrations to changes in SO2 emissions. As SO2 emissions increase,
non-linearity may arise as oxidants are consumed increasingly quickly hence reducing the production efficiency of sulfate (Berglen et al., 2004; Koch et al., 2007b)
15
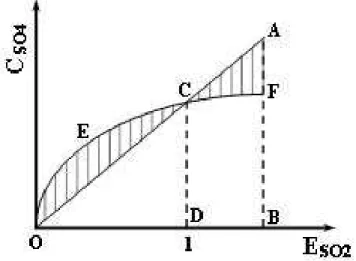
As shown in Fig. 7, when the S-R relationship is linear, sulfate concentrations in-crease proportionally with the inin-crease in SO2emissions (following line OA). However, if the increase in SO2 emissions decreases the availability of oxidants, the S-R
rela-tionship will follow the OECF curve, which is non-linear. The change of slope along OECF indicates the change of atmospheric oxidation power. To quantify the linearity
20
of the oxidation process, we define a cumulative linearity index (L) which indicates the percentage departure from linearity:
L = SOECS+ SCFA
OAB
× 100% (1)
SOABis the area of the triangle OAB associated with a linear S-R relationship (Fig. 7); SOEC(SOECD– SOCD) and SCFA(SCABD– SCFBD) are the shaded areas in Fig. 7,
ACPD
8, 5537–5561, 2008Source-receptor relationships for East
Asian sulfate J. Liu et al. Title Page Abstract Introduction Conclusions References Tables Figures ◭ ◮ ◭ ◮ Back Close
Full Screen / Esc
Printer-friendly Version Interactive Discussion
ing departure from linearity. When L=0, the S-R relationship is perfectly linear and the atmospheric oxidation power for SO2 is unchanged. When L6=0, the S-R relationship
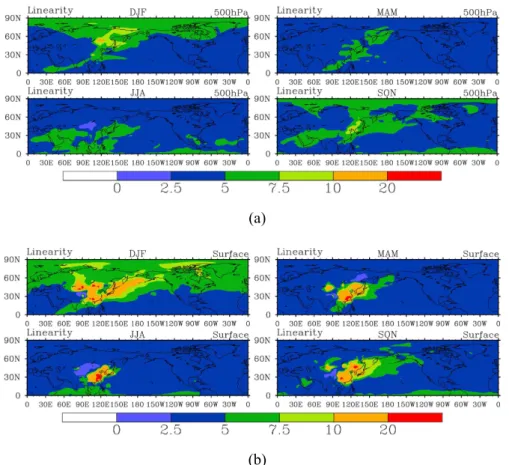
is non-linear. A larger|L| value implies lower linearity and lower oxidant availability. Figure 8 shows the distribution of L0−1.5(i.e., the linearity index obtained by varying EA emissions from 0 to 1.5 times the standard EA sulfur emissions) for the S-R
re-5
lationship between EA SO2 emissions and EA sulfate concentrations in the Northern
Hemisphere. In regions where SO2emissions are large, oxidant limitation results in in-complete conversion to sulfate, causing sulfate concentrations to increase more slowly than SO2 emissions; this results in the convex curve seen in Fig. 7 and a positive
value for L. Over EA, high L0−1.5 values (>10% and more than 20% over
southeast-10
ern China) are found at the surface in all seasons, indicating a persistent non-linear S-R relationship over EA and significant variations of atmospheric oxidation power for SO2. For example, in this study a 50% change (either increase or decrease) of EA
sulfur emissions is associated with 5–10% (1–2%), 2–5% (0.5–2), and 1–2% (0.5–1%) change in surface H2O2, OH, and O3 concentrations over EA (eastern Pacific) (not
15
shown). As shown in Fig. 8b, over the western Pacific the L0−1.5 values in JJA are low (<5%), indicating a higher atmospheric oxidation power for SO2than in other sea-sons. In addition, over the eastern Pacific and North America, the L0−1.5 values are low (<5%) in most seasons except winter (at high latitudes where oxidant levels are low). At 500 hPa (Fig. 8a), the L0−1.5 values are relatively low even over the EA source
20
region. Therefore, the S-R relationships between EA SO2 emissions and EA sulfate
concentrations are close to linear everywhere except at the surface over EA.
5 Direct and indirect effects of the change in EA SO2emissions
Changing SO2 emissions in EA leads to a direct change in EA sulfate and an indirect
change in sulfate from other sources, which cannot be distinguished using sensitivity
25
studies alone. Usually sensitivity studies represent the total change in sulfate concen-trations between a perturbation run in which EA SO2emissions are changed and the
ACPD
8, 5537–5561, 2008Source-receptor relationships for East
Asian sulfate J. Liu et al. Title Page Abstract Introduction Conclusions References Tables Figures ◭ ◮ ◭ ◮ Back Close
Full Screen / Esc
Printer-friendly Version Interactive Discussion
base run. Using our tagged regional sulfur tracers we identify a direct change in EA sulfate concentrations (due to production and transport of sulfate from SO2 emitted in EA). We also identify an indirect effect: the response of non-EA sulfate (i.e., the sulfate produced and transported from SO2emitted in regions other than EA) to the change in
EA SO2emissions.
5
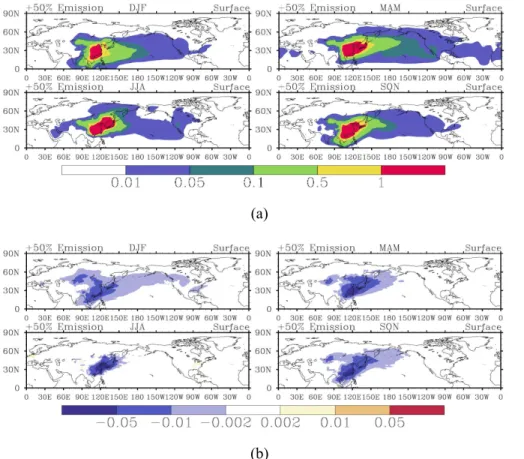
Figure 9 shows the direct and indirect changes in surface sulfate concentrations that result from increasing EA SO2 emissions by 50%. Raising EA SO2 emissions
has the direct effect of increasing EA sulfate concentrations across the Pacific Ocean (Fig. 6a) and the indirect effect of decreasing non-EA sulfate concentrations over East Asia (Fig. 6b). The negative indirect effect results from a reduction in the
concentra-10
tion of oxidants (particularly H2O2) which in turn slows down the oxidation of non-EA SO2. As shown in Fig. 9, the direct and indirect effects are both largest over the source
region and diminish downwind. However, the direct effect exceeds the indirect effect by more than a factor of 10 over the source region and North Pacific (particularly be-tween 20◦N–50◦N). Therefore, very similar trans-Pacific EA sulfate S-R relationships
15
are obtained using tagging and sensitivity techniques. At 500 hPa, the magnitudes of the direct effect are 0.1–0.5 µg m−3, 0.05–0.1 µg m−3, and less than 0.05 µg m−3 over the western Pacific, eastern Pacific and the United States (not shown). The indirect effect is negligible (<0.01 µg m−3).
6 Conclusions
20
We analyze the source-receptor relationships between sulfur emissions from East Asia and the resulting sulfate concentrations over both source and downwind regions, using the global oxidant-aerosol model (MOZART-2). We conduct a base simulation and five sensitivity simulations in which EA sulfur emissions are varied. In each simulation, we tag sulfur species from EA and other continental regions.
25
We find that the contribution of EA sulfate to the western US at the surface (via trans-Pacific transport) is highest in both MAM and JJA (the magnitude of seasonal mean
ACPD
8, 5537–5561, 2008Source-receptor relationships for East
Asian sulfate J. Liu et al. Title Page Abstract Introduction Conclusions References Tables Figures ◭ ◮ ◭ ◮ Back Close
Full Screen / Esc
Printer-friendly Version Interactive Discussion
EA sulfate concentrations over the western US is larger than 0.1 µg m−3), but is lowest in DJF (<0.05 µg m−3). This summertime high EA sulfate concentration is caused by the efficient production of sulfate aerosols over the EA source in conjunction with the convective elevation over the source region and relatively rapid trans-Pacific transport in the free troposphere. Since sulfate aerosol is an important component of PM2.5
5
which is harmful to human health, our findings indicate that, from the health perspec-tive, the summertime trans-Pacific transport of East Asian sulfate to the western US is as important as that in spring.
In terms of relative contribution, we find that present-day EA SO2emissions account for at least 50% (20%) of total sulfate concentrations over the whole North Pacific at
10
500 hPa (at the surface). Over the North American continent, if the NA sulfate is sub-tracted from the total sulfate (giving the NA background sulfate), the EA SO2emissions account for approximately 30–50% and 10–20% of NA background sulfate at the sur-face over the western and eastern US, respectively. At 500 hPa, the EA SO2emissions
account for at least 50% of NA background sulfate over even the eastern US.
15
We compare the areas over which EA sulfate concentrations are at least 0.1 µg m−3 (AEA0.1) in different sensitivity simulations. We find that reducing EA SO2 emissions
will significantly decrease the spatial extent of AEA0.1 over the North Pacific at both the surface and 500 mPa, but the extent is insensitive to emission increases except for spring and fall at 500 hPa. In addition, the spatial extent of AEA0.1 at 500 hPa is
20
approximately twice as broad at the surface in JJA, indicating the efficient trans-Pacific transport of EA sulfate in the free troposphere in summer. These findings suggest that future change in EA sulfur emission may cause little change in the EA sulfate induced health impact over the downwind continents but might significantly influence the sulfate related climate change over the North Pacific and the western US.
25
We quantify the degree of linearity in the S-R relationship between EA SO2
emis-sions and EA sulfate concentrations in the Northern Hemisphere by defining a linearity index. We find that EA sulfate concentrations respond nearly linearly (within 5%) to changes in EA SO2 emissions everywhere except over the EA source region (where
ACPD
8, 5537–5561, 2008Source-receptor relationships for East
Asian sulfate J. Liu et al. Title Page Abstract Introduction Conclusions References Tables Figures ◭ ◮ ◭ ◮ Back Close
Full Screen / Esc
Printer-friendly Version Interactive Discussion
non-linearities exceed 10%, particularly at the surface during winter). Sulfate concen-trations over EA increase proportionately less than the EA sulfur emissions because the conversion of SO2to sulfate reduces the availability of atmospheric oxidants
(par-ticularly H2O2), which in turn slows down the production rate for sulfate aerosol. How-ever, even under low-oxidant conditions, conversion to sulfate occurs more quickly than
5
transport to other continental regions.
We compare the direct effect (i.e., the change in sulfate produced from EA SO2
emissions) and indirect effect (i.e., response of non-EA sulfate) of changing EA SO2
emissions. We find that raising EA SO2 emissions leads to a positive direct effect
and a negative indirect effect on sulfate concentrations, particularly over the source
10
region. However, the magnitude of the direct effect is more than 10 times larger than the indirect effect over the mid-latitude Pacific. We therefore conclude that the tagging and sensitivity techniques will produce nearly identical estimates of the source-receptor relationship of trans-Pacific transport of sulfate aerosols.
Acknowledgements. We thank the Geophysical Fluid Dynamics Laboratory for computational
15
resources. We are pleased to acknowledge funding from Princeton University and a NASA New Investigator Program grant to D. L. Mauzerall.
References
Berglen, T. F., Berntsen, T. K., Isaksen, I. S. A., and Sundet, J. K.: A global model of the coupled sulfur/oxidant chemistry in the troposphere: The sulfur cycle, J. Geophys. Res.-Atmos., 109,
20
D19310, doi:10.1029/2003JD003948, 2004.
Brasseur, G. P., Orlando, J. J., Tyndall, G. S., and National Center for Atmospheric Research (US): Atmospheric chemistry and global change, Topics in environmental chemistry, Oxford University Press, New York, xviii, 654 pp., 1999.
Carlson, C., Burtraw, D., Cropper, M., and Palmer, K. L.: Sulfur dioxide control by electric
25
utilities: What are the gains from trade?, J. Polit. Econ., 108, 1292–1326, 2000.
ACPD
8, 5537–5561, 2008Source-receptor relationships for East
Asian sulfate J. Liu et al. Title Page Abstract Introduction Conclusions References Tables Figures ◭ ◮ ◭ ◮ Back Close
Full Screen / Esc
Printer-friendly Version Interactive Discussion aerosols: Implications for regional air quality, Atmos. Chem. Phys., 7, 5501–5517, 2007,
http://www.atmos-chem-phys.net/7/5501/2007/.
Conrad, K. and Kohn, R. E.: The US market for SO2 permits – policy implications of the low price and trading volume, Energ. Policy, 24, 1051–1059, 1996.
Dutkiewicz, V. A., Das, M., and Husain, L.: The relationship between regional SO2 emissions
5
and downwind aerosol sulfate concentrations in the northeastern US, Atmos. Environ., 34, 1821–1832, 2000.
Feichter, J., Kjellstrom, E., Rodhe, H., Dentener, F., Lelieveld, J., and Roelofs, G. J.: Simulation of the tropospheric sulfur cycle in a global climate model, Atmos. Environ., 30, 1693–1707, 1996.
10
Ginoux, P., Horowitz, L. W., Ramaswamy, V., Geogdzhayev, I. V., Holben, B. N., Stenchikov, G., and Tie, X.: Evaluation of aerosol distribution and optical depth in the geophysical fluid dynamics laboratory coupled model CM2.1 for present climate, J. Geophys. Res.-Atmos., 111, D22210, doi:10.1029/2005JD006707, 2006.
Giorgi, F., Bi, X. Q., and Qian, Y.: Indirect vs. Direct effects of anthropogenic sulfate on the
15
climate of east Asia as simulated with a regional coupled climate-chemistry/aerosol model, Climatic Change, 58, 345–376, 2003.
Gunther, A. J.: A chemical survey of remote lakes of the Alagnak and Aaknek river systems, southwest Alaska, USA, Arctic Alpine Res., 24, 64–68, 1992.
Hao, J. M., Wang, S. X., Liu, B. J., and He, K. B.: Plotting of acid rain and sulfur dioxide pollution
20
control zones and integrated control planning in china, Water Air Soil Poll., 130, 259–264, 2001.
Heald, C. L., Jacob, D. J., Park, R. J., Alexander, B., Fairlie, T. D., Yantosca, R. M., and Chu, D. A.: Transpacific transport of Asian anthropogenic aerosols and its impact on surface air qual-ity in the United States, J. Geophys. Res.-Atmos., 111, D14310, doi:10.1029/2005JD006847,
25
2006.
Hilst, G. R.: Proportionality between SO2emissions and wet SO2−4 concentrations – the effect of area of averaging, Atmos. Environ. A-Gen., 26, 1413–1420, 1992.
Horowitz, L. W., Walters, S., Mauzerall, D. L., Emmons, L. K., Rasch, P. J., Granier, C., Tie, X. X., Lamarque, J. F., Schultz, M. G., Tyndall, G. S., Orlando, J. J., and Brasseur, G. P.:
30
A global simulation of tropospheric ozone and related tracers: Description and evaluation of MOZART, version 2, J. Geophys. Res.-Atmos., 108(D24), 4784, doi:10.1029/2002JD002853, 2003.
ACPD
8, 5537–5561, 2008Source-receptor relationships for East
Asian sulfate J. Liu et al. Title Page Abstract Introduction Conclusions References Tables Figures ◭ ◮ ◭ ◮ Back Close
Full Screen / Esc
Printer-friendly Version Interactive Discussion Horowitz, L. W.: Past, present, and future concentrations of tropospheric ozone and aerosols:
Methodology, ozone evaluation, and sensitivity to aerosol wet removal, J. Geophys. Res.-Atmos., 111, D22211, doi:10.1029/2005JD006937, 2006.
Jaffe, D., Tamura, S., and Harris, J.: Seasonal cycle and composition of background fine parti-cles along the west coast of the US, Atmos. Environ., 39, 297–306, 2005.
5
Klimont, Z., Cofala, J., Schopp, W., Amann, M., Streets, D. G., Ichikawa, Y., and Fujita, S.: Projections of SO2, NOx, NH3 and VOC emissions in east Asia up to 2030, Water Air Soil Poll., 130, 193–198, 2001.
Koch, D., Bond, T. C., Streets, D., and Unger, N.: Linking future aerosol radiative forcing to shifts in source activities, Geophys. Res. Lett., 34, L05821, doi:10.1029/2006GL028360, 2007a.
10
Koch, D., Bond, T. C., Streets, D., Unger, N., and van der Werf, G. R.: Global impacts of aerosols from particular source regions and sectors, J. Geophys. Res.-Atmos., 112, D02205, doi:10.1029/2005JD007024, 2007b.
Liu, J. F. and Mauzerall, D. L.: Estimating the average time for inter-continental transport of air pollutants, Geophys. Res. Lett., 32, L11814, doi:10.1029/2005GL022619, 2005.
15
Liu, J. F., Mauzerall, D. L., and Horowitz, L. W.: Analysis of seasonal and
inter-annual variability in transpacific transport, J. Geophys. Res.-Atmos., 110, D04302, doi:10.1029/2004JD005207, 2005.
Liu, J. F., and Mauzerall, D. L.: Potential influence of inter-continental transport of
sulfate aerosols on air quality, Environ. Res. Lett., 2, 045029,
doi:10.1088/1748-20
9326/1082/1084/045029, 2007.
Marmer, E., Langmann, B., Fagerli, H., and Vestreng, V.: Direct shortwave radiative forcing of sulfate aerosol over Europe from 1900 to 2000, J. Geophys. Res.-Atmos., 112, D23S17, doi:10.1029/2006JD008037, 2007.
Martin, L. R. and Damschen, D. E.: Aqueous oxidation of sulfur-dioxide by hydrogen-peroxide
25
at low ph, Atmos. Environ., 15, 1615–1621, 1981.
Moldan, F., Wright, R. F., Lofgren, S., Forsius, M., Ruoho-Airola, T., and Skjelkvale, B. L.: Long-term changes in acidification and recovery at nine calibrated catchments in Norway, Sweden and Finland, Hydrol. Earth Syst. Sc., 5, 339–349, 2001.
NAPAP: National acid precipitation assessment program report to congress: An integrated
30
assessment, Washington, DC, 2005.
Olivier, J. G. J., Bouwman, A. F., Van der Maas, C. W. M., Berdowski, J. J. M., Veldt, C., Bloos, J. P. J., Visschedijk, A. J. H., Zandveld, P. Y. J., and Haverlag, J. L.: Description of edgar
ACPD
8, 5537–5561, 2008Source-receptor relationships for East
Asian sulfate J. Liu et al. Title Page Abstract Introduction Conclusions References Tables Figures ◭ ◮ ◭ ◮ Back Close
Full Screen / Esc
Printer-friendly Version Interactive Discussion version 2.0: A set of global emission inventories of greenhouse gases and ozone-depleting
substances for all anthropogenic and most natural sources on a per country basis and on 1◦×1◦grid. National institute of public health and the environment, (RIVM) report no. 771060 771002 / TNO-MEP report no. R771096/771119, 1996.
Oppenheimer, M., Epstein, C. B., and Yuhnke, R. E.: Acid deposition, smelter emissions, and
5
the linearity issue in the western united-states, Science, 229, 859–862, 1985.
Park, R. J., Jacob, D. J., Field, B. D., Yantosca, R. M., and Chin, M.: Natural and trans-boundary pollution influences on sulfate-nitrate-ammonium aerosols in the United States: Implications for policy, J. Geophys. Res.-Atmos., 109, D15204, doi:10.1029/2003JD004473, 2004. Pope, C., Burnett, R., Thun, M., Calle, E., Krewski, D., Ito, K., and Thurston, G.: Lung cancer,
10
cardiopulmonary mortality, and long-term exposure to fine particulate air pollution, Jama – J. Am. Med. Assoc., 287, 1132–1141, 2002.
Pope, C., Burnett, R., Thurston, G., Thun, M., Calle, E., Krewski, D., and Godleski, J.: Car-diovascular mortality and long-term exposure to particulate air pollution – epidemiological evidence of general pathophysiological pathways of disease, Circulation, 109, 71–77, 2004.
15
Prospero, J. M.: The atmospheric transport of particles to the ocean, in particle flux in the ocean, edited by Ittekkot, V., Sch ¨afer, P., Honjo, S., and Depetris, P. J., Scope, 57, 19–52, 1996.
Prospero, J. M., Savoie, D. L., and Arimoto, R.: Long-term record of nss-sulfate and
nitrate in aerosols on midway island, 1981–2000: Evidence of increased (now
de-20
creasing?) anthropogenic emissions from Asia, J. Geophys. Res.-Atmos., 108, 4019,
doi:10.1029/2001JD001524, 2003.
Seinfeld, J. H. and Pandis, S. N.: Atmospheric chemistry and physics: From air pollution to climate change, Wiley, New York, xxvii, 1326 pp., 1998.
Streets, D. G.: Dissecting future aerosol emissions: Warming tendencies and mitigation
oppor-25
tunities, Climatic Change, 81, 313–330, 2007.
Tie, X. X., Madronich, S., Walters, S., Edwards, D. P., Ginoux, P., Mahowald, N., Zhang, R. Y., Lou, C., and Brasseur, G.: Assessment of the global impact of aerosols on tropospheric oxidants, J. Geophys. Res.-Atmos., 110, D03204, doi:10.1029/2004JD005359, 2005.
ACPD
8, 5537–5561, 2008Source-receptor relationships for East
Asian sulfate J. Liu et al. Title Page Abstract Introduction Conclusions References Tables Figures ◭ ◮ ◭ ◮ Back Close
Full Screen / Esc
Printer-friendly Version Interactive Discussion North America South America Europe FSU Africa India East Asia Southeast Asia Australia Middle East
ACPD
8, 5537–5561, 2008Source-receptor relationships for East
Asian sulfate J. Liu et al. Title Page Abstract Introduction Conclusions References Tables Figures ◭ ◮ ◭ ◮ Back Close
Full Screen / Esc
Printer-friendly Version Interactive Discussion -150 -120 -90 -60 -30 0 30 60 90 120 150 -150 -120 -90 -60 -30 0 30 60 90 120 150 -60 -30 0 30 60 -60 -30 0 30 60 -1.0 -0.75 -0.50 -0.25 0.50 1.0 2.0 10. 0.1 1.0 10.0 Measurements 0.1 1.0 10.0 Model 0.1 1.0 10.0 0.1 1.0 10.0 0.1 1.0 10.0 0.1 1.0 10.0 0.1 1.0 10.0 0.1 1.0 10.0 R=0.90
Fig. 2. Scatter plot (left panel) and the relative difference (i.e., (model-obs)/obs, right panel)
between the simulated (MOZART2, early 1990s) and observed annual mean sulfate concentra-tions (SO2−4 ; unit: ug·m−3). Observations are from RSMAS (1980s–1990s average, University of Miami, triangles), IMPROVE (1990–1992 average, circles), EMEP (1990–2002 average, di-amonds), and EANET (2000–2004 average, squares).
ACPD
8, 5537–5561, 2008Source-receptor relationships for East
Asian sulfate J. Liu et al. Title Page Abstract Introduction Conclusions References Tables Figures ◭ ◮ ◭ ◮ Back Close
Full Screen / Esc
Printer-friendly Version Interactive Discussion
(a)
(b)
Fig. 3. Horizontal distribution of EA sulfate concentrations (SO4; unit: µg m−3) at (a) 500 hPa and (b) the surface in DJF, MAM, JJA, and SON (letters correspond to the 12 months of the year).
ACPD
8, 5537–5561, 2008Source-receptor relationships for East
Asian sulfate J. Liu et al. Title Page Abstract Introduction Conclusions References Tables Figures ◭ ◮ ◭ ◮ Back Close
Full Screen / Esc
Printer-friendly Version Interactive Discussion
(a)
(b)
Fig. 4. Percent contribution of EA sulfate to total sulfate concentrations (with standard
ACPD
8, 5537–5561, 2008Source-receptor relationships for East
Asian sulfate J. Liu et al. Title Page Abstract Introduction Conclusions References Tables Figures ◭ ◮ ◭ ◮ Back Close
Full Screen / Esc
Printer-friendly Version Interactive Discussion
(a)
(b)
Fig. 5. Same as Fig. 4, but percent contribution of EA sulfate to North American (NA)
back-ground sulfate (Note: NA backback-ground sulfate is the difference between total sulfate concentra-tions and the NA sulfate concentraconcentra-tions).
ACPD
8, 5537–5561, 2008Source-receptor relationships for East
Asian sulfate J. Liu et al. Title Page Abstract Introduction Conclusions References Tables Figures ◭ ◮ ◭ ◮ Back Close
Full Screen / Esc
Printer-friendly Version Interactive Discussion
(a)
(b)
Fig. 6. Areas where at least 0.1 µg m−3of sulfate is contributed from EA (AEA0.1) at (a) 500 hPa,
(b) the surface over the same seasons as in Fig. 3 when EA sulfur emissions are 0.2, 0.5, 0.8,
ACPD
8, 5537–5561, 2008Source-receptor relationships for East
Asian sulfate J. Liu et al. Title Page Abstract Introduction Conclusions References Tables Figures ◭ ◮ ◭ ◮ Back Close
Full Screen / Esc
Printer-friendly Version Interactive Discussion
Fig. 7. Sketch of linearity of S-R relationships between SO2 emissions (ESO
2) and sulfate concentrations (CSO
4). The straight line OA here shows the perfect linear dependence of CSO4 on ESO
2, when ESO2 is varied between O and B. While the convex curve OECF shows the
actual dependence of CSO4 on ESO2 (see Eq. (1) in Sect. 4 for the definition of linearity index. Note: “1” here indicates standard emissions, and “O” indicates the origin point).
ACPD
8, 5537–5561, 2008Source-receptor relationships for East
Asian sulfate J. Liu et al. Title Page Abstract Introduction Conclusions References Tables Figures ◭ ◮ ◭ ◮ Back Close
Full Screen / Esc
Printer-friendly Version Interactive Discussion
(a)
(b)
Fig. 8. Distribution of the Linearity Index for the S-R relationship between EA SO2 emissions and EA sulfate concentrations over the Northern Hemisphere (based on Eq. (1) where low numbers indicate approximate linearity; EA sulfur emissions range from 0 to 1.5 times the standard emissions) at (a) 500 hPa and (b) the surface. Seasons are the same as in Fig. 3.
ACPD
8, 5537–5561, 2008Source-receptor relationships for East
Asian sulfate J. Liu et al. Title Page Abstract Introduction Conclusions References Tables Figures ◭ ◮ ◭ ◮ Back Close
Full Screen / Esc
Printer-friendly Version Interactive Discussion
(a)
(b)
Fig. 9. Direct (a) and indirect (b) effects on surface sulfate concentrations (unit: µg m−3) from 50% increase of EA SO2emissions (note: different color scales). Direct effects refer to changes in sulfate produced from EA emissions, while indirect effects refer to changes in sulfate resulting from emissions in other regions.