HAL Id: hal-00298052
https://hal.archives-ouvertes.fr/hal-00298052
Submitted on 9 Oct 2006
HAL is a multi-disciplinary open access
archive for the deposit and dissemination of
sci-entific research documents, whether they are
pub-lished or not. The documents may come from
teaching and research institutions in France or
abroad, or from public or private research centers.
L’archive ouverte pluridisciplinaire HAL, est
destinée au dépôt et à la diffusion de documents
scientifiques de niveau recherche, publiés ou non,
émanant des établissements d’enseignement et de
recherche français ou étrangers, des laboratoires
publics ou privés.
an example from Central Europe in the early 1770s
C. Pfister, R. Brázdil
To cite this version:
C. Pfister, R. Brázdil. Social vulnerability to climate in the ”Little Ice Age”: an example from Central
Europe in the early 1770s. Climate of the Past, European Geosciences Union (EGU), 2006, 2 (2),
pp.115-129. �hal-00298052�
www.clim-past.net/2/115/2006/
© Author(s) 2006. This work is licensed under a Creative Commons License.
Climate
of the Past
Social vulnerability to climate in the “Little Ice Age”: an example
from Central Europe in the early 1770s
C. Pfister1and R. Br´azdil2
1Institute of History/NCCR Climate, University of Bern, Unitobler, CH-3000 Bern 9, Switzerland 2Institute of Geography, Masaryk University, Kotl´aˇrsk´a 2, CZ-611 37 Brno, The Czech Republic
Received: 1 February 2006 – Published in Clim. Past Discuss.: 7 April 2006 Revised: 18 July 2006 – Accepted: 27 September 2006 – Published: 9 October 2006
Abstract. The paper is oriented on social vulnerability to cli-mate in Switzerland and in the Czech Lands during the early 1770s. Documentary sources of climate related to man-made archives are discussed. Methods of temperature and precip-itation reconstruction based on this evidence as well as cli-mate impact analyses are presented. Modelling of Little Ice Age-type Impacts (LIATIMP) is applied to highlight climate impacts during the period 1750–1800 in the Swiss Plateau and in the Czech Lands. LIATIMP are defined as adverse climate situations affecting agricultural production, mainly in terms of rainy autumns, cold springs and rainy harvest-periods. The most adverse weather patterns according to this model occurred from 1769 to 1771 causing two, in the case of the Czech Lands even three successive harvest failures. The paper addresses the social and economic consequences of this accumulation of climatic stress and explores how the authorities and the victims dealt with this situation.
1 Introduction
In order to investigate interactions between the history of human societies and the dynamics of their quasi-natural en-vironment, we have to consider that changes in these two spheres usually occur independent of each other and follow their own internal drive. Furthermore, we must investigate processes in both spheres that take place on different tem-poral and spatial scales. Among the long-term processes in the human realm, population growth, economic develop-ment, the construction of networks of communication and traffic and the interrelated move toward globalization need to be mentioned together with changes in fundamental in-stitutional structure as well as the rise or decline of states and empires. In the sphere of nature, we should distinguish
Correspondence to: C. Pfister
man-made effects from other exogenous factors. Examples of climate forcing include fluctuations in solar and volcanic activity, orbital changes of the earth, changes in thermohaline circulation, etc. Changes to which humans contribute include issues such as greenhouse gases and aerosols in addition to soil salinity, deforestation and drops in ground-water levels. Climate extremes may be intensified through longer term nat-ural processes, but they may also be connected to the natnat-ural variability of climate. If certain kinds of extremes occur, hu-man and environmental factors interact and the outcome may contribute to shaping local, regional and even global history. A group’s ability to anticipate, cope with, resist and re-cover from crises and disaster depends on a variety of social, economic, political and environmental processes on a much larger scale. The magnitude of vulnerability is measured on one hand in terms of human losses through forces of nature, epidemics and malnutrition, and on the other in terms of im-poverishment and material losses (Brooks, 2003). The con-cept of vulnerability is well suited to investigate such pro-cesses at the interface of “nature” and “culture”. It was intro-duced by sociologists in the 1990s and quickly picked up by geographers, sociologists, anthropologists and lately histori-ans (Oliver-Smith, 2004). The concept includes the level of socio-economic development (taking into account the degree of social stratification), demographic growth and the kinds of technical equipment and institutional performances available in situations of need and emergency. The issue of the vulner-ability of both past and present societies is increasingly dealt with in the wake of recent disasters (Watts and Bohle, 1993; Bankoff, 2003; Pelling, 2003; Oliver-Smith, 2004; Br´azdil et al., 2005).
This paper deals with the vulnerability of past agriculture and people to extreme climatic events. Rightly, economic historians have strong reservations against argumentations that attribute the causes of famines and mortality crises solely or primarily to the impact of extreme weather. Rather, they prefer explanations related to socioeconomic structures and
political agency. However, many of them throw out the baby with the bathwater arguing that there is no need at all inves-tigating the frequency and severity of climatic shocks as po-tentially relevant variables within their models. Exceptions from this rule are very few (e.g. Bauernfeind, 1993; Bauern-feind and Woitek, 1999; Landsteiner, 2005). Wilhelm Abel (1972) thought that climatic impacts on the economy should be understood as a series of random shocks. Likewise, K.-G. Persson (1999) does not envisage possible changes in cli-mate over time: “That the price fluctuations [. . . ] were trig-gered by output shocks is too obvious to dispute.” Using questionable statistics, Nobel laureate Robert Fogel (1992) even tried to disprove the existence of any relationship be-tween climatic extremes and famines, i.e. bebe-tween agricul-ture and climate. He simply claimed: “Famines were caused not by natural disasters but by dramatic redistributions of en-titlements to grain” (see Landsteiner, 2005).
M. Jarraud (2005), Secretary-General of the World Meteo-rological Organization (WMO), comes to a somewhat differ-ent assessmdiffer-ent. With a view to the presdiffer-ent and the future, he writes that “Climate variability affects all economic sectors, but agriculture and forestry sectors are perhaps the most vul-nerable and sensitive activities to such fluctuations.” But for historians who care about people’s perceptions and the es-tablished facts found in the sources – rather than just playing around with equilibrium models and numerical data – cli-mate variability mattered in pre-industrial economies. How-ever, sweeping generalizations in the line of Fogel (1992) are not likely to be drawn from the evidence. Rather, the signifi-cance of climate for subsistence crises and famines needs to be established from case to case.
The paper is structured as follows: The subsequent section is devoted to sources from natural and man-made archives, which provide the backbone for analyses of climate impacts. The third section discusses methods for reconstructing cli-mate from proxy-evidence. In the fourth section, basic prop-erties of Little Ice Age climate in central Europe are outlined and a model for assessing climate impacts is presented. The fifth section presents two case-studies that illustrate how dif-ferently regimes in western Switzerland and the Czech Lands faced the challenge of the adverse weather patterns in the years 1769–1772. Some conclusions are drawn in the last section.
2 Sources on climate from man-made archives
Past climates have left their marks on every part of the globe in multifarious ways. In principle, palaeoclimatic evidence was created either by natural processes or by human activity and it is contained in corresponding, natural and man-made archives. Historical climate analyses have improved the es-timates of anthropogenic effects on climate by providing a more accurate understanding of the natural background cli-mate variability. On a local or regional scale, many
instru-mental series from individual stations or regions exist, some of them reaching back as far as the seventeenth century (see, e.g. Pfister and Bareiss, 1994; Slonosky et al., 2001). Prior to these periods and prior to the establishment of national mete-orological networks, information on past climates must nec-essarily be drawn from non-instrumental man-made sources and from proxy evidence obtained from natural archives. A historical source on climate is a document, i.e. a unit of infor-mation such as a manuscript, a piece of printed matter (book, newspaper etc.), a picture or an artefact (e.g. a flood mark or an inscription on a house), which refers to weather patterns or impacts of climate. Documentary evidence may include all kinds of man-made sources (Br´azdil et al., 2005).
Historical climatology deals primarily with documentary evidence. This branch of knowledge is situated at the inter-face of climatology and environmental history. As such, its goal is to reconstruct weather and climate, as well as nat-ural disasters, for the last millennium prior to the creation of national meteorological networks. Historical climatology is also concerned with investigating the vulnerability of past economies and societies to climate variations, climatic ex-tremes, and natural disasters, and with exploring past dis-courses and social representations related to climate (Pfister et al., 2001; Br´azdil et al., 2005).
The database for historical–climatological research can be broadly categorised as being either direct or indirect data. The direct data is descriptive documentary data, e.g. narrative descriptions of weather patterns or early instrumental mea-surements. Indirect or documentary proxy data reflects the impact of weather on elements in the hydrosphere (e.g. floods and low water tables), the cryosphere (e.g. duration of snow-cover) or the biosphere (e.g. phenological data) (Br´azdil et al., 2005).
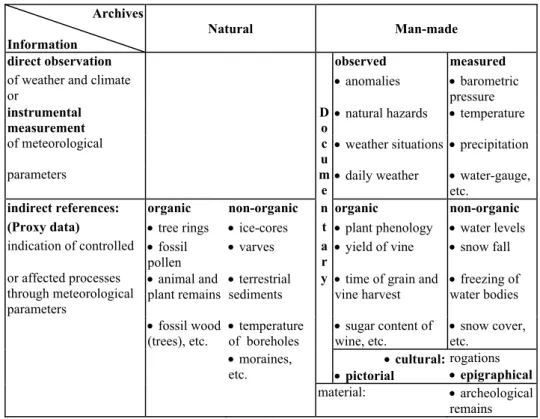
According to their origin, indirect data can be either man-made or based on natural proxy evidence (Fig. 1). Docu-mentary data are the only kind of palaeoclimatic data that are based on direct observations of different meteorologi-cal parameters (e.g. temperature, precipitation, snow-cover etc.) in terms of narrative descriptions and/or early instru-mental measurements. Most importantly, they are the only evidence that is directly related to the socio-economic im-pacts of rare but significant disasters, such as intense storms, severe floods, and long-lasting droughts in the period prior to the organisation of instrumental network observations. For this reason, reconstructions based on documentary data play an important role in the enhanced greenhouse effect debate (Pauling et al., 2003; Br´azdil et al., 2005; Casty et al., 2005). In particular, adverse weather patterns and their impact on crops, cattle, transportation, the working of mills and many other human activities are directly and extensively described. Extreme events of this kind gave reason to lay down such observations for posterity, particularly in rural milieus. Pro-cesses in the natural world are usually not a topic of public discussion and tend to be disregarded. Sociologist N. Luh-mann (1986) pointed to the fact that such events are only
Archives Information
Natural Man-made direct observation observed measured
of weather and climate
or • anomalies • barometric pressure
instrumental
measurement D o • natural hazards • temperature
of meteorological c
u • weather situations • precipitation
parameters m
e • daily weather • water-gauge, etc.
indirect references: organic non-organic n organic non-organic (Proxy data) • tree rings • ice-cores t • plant phenology • water levels indication of controlled • fossil
pollen • varves
a
r • yield of vine • snow fall
or affected processes through meteorological parameters
• animal and
plant remains • terrestrial sediments
y • time of grain and
vine harvest • freezing of water bodies • fossil wood (trees), etc. • temperature of boreholes • sugar content of wine, etc. • snow cover, etc. • moraines,
etc. • pictorial • cultural:
rogations • epigraphical
material: • archeological
remains Fig. 1. A survey of evidence for reconstructing past weather and climate (Pfister, 1999).
noticed and communicated if they interfere with daily rou-tines and threaten fundamental values of a society.
Weather is also reflected in the records of administrative activities, most of which were related to accounting and tax-ation. The group of documentary proxy data is made of a broad variety of indicators that are as different among them-selves as natural proxy data (Fig. 1). For example, the open-ing day of the vintage is listed year by year in some source in-ventories back to the fourteenth century (Chuine et al., 2004). The beginning of the harvest had to be communicated in ad-vance to the owner of the tithe in order to allow him to mon-itor the collection of the grapes. In Spain and elsewhere, the Catholic Church organised rogation services (rogativas) di-rected to end climatic stress-situations connected with long dry (“pro pluvia” rogations) or wet spells (“pro serenitate” rogations), both of which jeopardised the crops. The mu-nicipalities had to bear the cost for these rituals, which bene-fited the church. Consequently, rogations are found in the ac-counts of both institutions in terms of expenses and receipts (Piervitali and Colacino, 2001; Barriendos, 2005).
The oldest series of documentary proxy data is found in the rolls of some 50 manorial accounts belonging to the wealthy Bishopric of Winchester (Southeast England) (Titow, 1960, 1970). Both the seed and the yield for wheat are listed there along with other receipts and expenditures in kind. Refer-ences to weather appear from about 1230 to 1450 to explain
why certain items of expenditure are unusually large or cer-tain items of income are unusually small. For example, ref-erences to hard winters (which included most of spring) are usually meant as an explanation of unusually large quanti-ties of grain fed to the manorial animals (Titow, 1960, 1970). Such sources yield data on both climate and grain production and are thus invaluable for impact studies.
Similarly, the account books of the town Louny in north-western Bohemia (the Czech Republic) kept track of wages paid by the municipality on Saturday for work carried out in the preceding week. This detailed list also includes activ-ities related to weather and climate, e.g. cutting ice at the water mills and on the Ohˇre River, cleaning snow from the roads, repairing bridges after floods etc. Whereas dates of cutting ice can be used as a proxy for duration of severe frost, the beginning of payments to mowers mirrored the onset of the harvest and thus the ripening of grains, which varied ac-cording to the temperature in the preceding months. Br´azdil and Kotyza (2000) have drawn on such proxy evidence to reconstruct an almost complete series of winter and spring-summer temperatures for the Czech Lands over the period 1450–1632.
In contrast to the observations of individuals, documentary proxy data – as they are called – have a number of advan-tages. The output is often available in quantitative form, it is more or less standardized and the evidence is not bound on
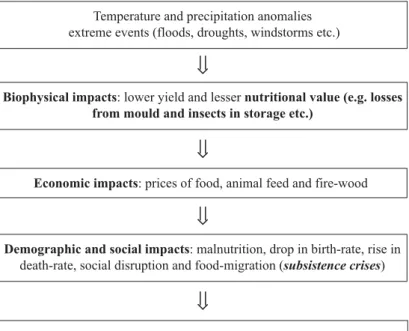
Temperature and precipitation anomalies extreme events (floods, droughts, windstorms etc.)
Biophysical impacts: lower yield and lesser nutritional value (e.g. losses from mould and insects in storage etc.)
Economic impacts: prices of food, animal feed and fire-wood
Demographic and social impacts: malnutrition, drop in birth-rate, rise in
death-rate, social disruption and food-migration (subsistence crises)
* * *
Severity of climate impact compared to buffering and adaptation
Fig. 2. A basic model of climate impacts on society (modified after Kates, 1985).
the life-time of an observer. Rather, their availability reflects the life-time of the institution which produced the data. Of course, in view of assessing the homogeneity of the infor-mation, the historian has to investigate whether bureaucratic routines were changed.
3 Methods of climate reconstruction and impact analysis
Information on past climates is obtained from data on two different time-scales: palaeo-climatological data cover a time-scale of 103years and longer (see, e.g. Bradley, 1999), whereas historical climatology focuses on high-resolution documentary evidence in the last millennium of the pre-instrumental period (Br´azdil et al., 2005). Most proxy data from “natural archives” are of little value to assess the human significance of climate. The historian would need evidence that offers a high resolution in terms of time, space and cli-mate elements. Most natural proxy data, however, have a low temporal resolution and effects of temperature and pre-cipitation often cannot be disentangled. Moreover, scientists preferably provide smoothed curves on a high level of spa-tial aggregation. Outliers in which historians would have the most interest are suppressed. Given this situation, historians had to develop their own approach of climate reconstruction.
According to Le Roy Ladurie (1972), a conclusive investi-gation of the impact of climatic variations on societies should involve two steps. Firstly, climate in the pre-instrumental period should be studied for its own sake, separately from its possible impacts on societies. In a second step, the ev-idence obtained should be used to set up models enabling the exploration of the impacts of climatic variations upon economies and societies. He suggested that such a picture of climate without mankind in the historical period might be reconstructed from data describing the meteorological nature of certain years, seasons, months and days, i.e., from long series of documentary proxy data. The ultimate goal of such a reconstruction should be setting up series of continuous, quantitative and homogeneous climatic indicators.
Monthly temperature and precipitation data are usually the most important parameters for the study of climate impacts on human societies. A possible procedure of their recon-struction in the pre-instrumental period starts with the search of suitable documentary data that are able to define a high amount of temperature and precipitation variability (Fig. 2). Useful values from documentary evidence are obtained by transforming the basic data into ordinal data in the form of a time series of simple or weighted temperature and precip-itation indices (see, e.g. Pfister, 1984). Simple monthly in-dices use a three-term classification (temperature: 1 warm, 0 normal, –1 cold; precipitation: 1 wet, 0 normal, –1 dry).
Weighted monthly temperature indices are based on a seven-term classification (3 extremely warm, 2 very warm, 1 warm, 0 normal, –1 cold, –2 very cold, –3 extremely cold) for tem-perature, and a similar graduation for precipitation (3 ex-tremely wet, 2 very wet, 1 wet, 0 normal, –1 dry, –2 very dry, –3 extremely dry). Seasonal or annual indices are obtained by summation of monthly values (i.e. the seasonal values can fluctuate from –9 to 9) (Pfister, 1999). Other scaling into or-dinal numbers can be used (see, e.g. Wang et al., 1991; van Engelen et al., 2001). It depends on the density and quality of the basic information, and is to some extent affected by the subjectivity of the researcher. The statistical transforma-tion into ordinal data in the form of a time series of temper-ature indices is a great challenge requiring a broad statistical and dynamical understanding. The first step in the procedure includes evaluation of available documentary data with con-sideration of critical analysis of sources, author and/or insti-tutional framework, calibration of documentary proxy data, etc. The comparison and cross-checking of data from differ-ent documdiffer-entary sources, both direct and indirect, allow as-sessment of an unequivocal climatic tendency, within a given temporal and spatial domain (Br´azdil et al., 2005).
Series of intensity indices obtained from documentary ev-idence can be further interpreted in temperature or precipita-tion units (◦C and/or mm, %, respectively). In this case they should overlap the period of instrumental measurements, which is usually possible in a few cases and for specific pe-riods. The procedure for such reconstructions includes the following three steps: calibration, verification and recon-struction. The aim of calibration is to determine the relation (transfer function) between the temperature/precipitation in-dices and air temperature/precipitation for the calibration pe-riod in which both values of the given indices and the both meteorological elements are available. According to scien-tific standards the validity of any kind of data needs to be verified by applying suitable statistical methods and using independent data. As was shown for selected central Euro-pean instrumental temperature and precipitation series, cor-responding indices series can express the main features of temperature/precipitation variability based on measured data (Pfister and Br´azdil, 1999). The reduction of explained vari-ance is only a few percent when transforming the instru-mental readings into ordinal data. Thus, depending on the number of degrees of freedom in the chosen ordinal scale, real temperature/precipitation variations are very well esti-mated by the indices. Prior to the reconstruction, the trans-fer functions have to be verified in a diftrans-ferent time period, i.e. the relationship obtained in a calibration period is ap-plied to a so-called verification period, for which the temper-ature/precipitation values are estimated from the documen-tary data. These estimations are then compared with the measured values using different statistical measures. If the transfer function obtained expresses the variability of tem-perature/precipitation under consideration with satisfactory precision, the chronology of intensity indices can be used
for temperature/precipitation reconstruction (for more details see, e.g. Pfister and Br´azdil, 1999; Br´azdil et al., 2003, 2005). When series of continuous, quantitative and quasi-homogeneous climatic indicators are set up for the pre-instrumental period, such series may be used to set up mod-els, which enable the exploration of the impacts of climatic variations upon economies and societies. Effects of climatic fluctuations “on the course of history” are difficult to demon-strate. It is frequently overlooked that both “climate” and “history” are blanket terms, situated on a high level of ab-straction. For this reason, relationships between them cannot be easily investigated in a meaningful way. They need to be broken down to lower scales of analysis. For “history” this may entail a specific focus for example, on the food system, the health system or the energy system, or on specific ac-tivities such as transportation, communications, military or naval operations. The term “climate” needs to be disentan-gled into seasonal or monthly temperature and precipitation, climatic anomalies and weather extremes and types of im-pacts, and related to specific spatial units. The closer details are investigated, the higher is the probability of finding sig-nificant coherences. Moreover, concepts need to be worked out in order to disentangle the severity of climate impacts and the efficiency of measures for coping with them. On a very general level, it could be said that beneficial climatic effects tend to enlarge the scope of human action, whereas climatic shocks tend to restrict it. Which sequences of climatic situa-tions matter depends upon the impacted unit and the environ-mental, cultural and historical context (Pfister, 2001). How-ever, this statement needs to be restricted in the sense that the term “climatic shock” itself is ambiguous, as it is well known that some of the people and groups involved always take ad-vantage of situations of general distress, both economically and politically.
As is generally known, there is a substantial amount of analyses dealing with the causes of famines (e.g. Newman, 1990). Murton (2000) gives an excellent overview of the rel-evant literature. In all famines, natural, social and political factors are involved. However, because they are inextricably intertwined, it is almost impossible to assess their relative significance. Kates (1985) was well aware of this fact, and for this reason he submitted a broad variety of models in his analysis. In a first run, he suggested, impact studies might be arranged in the order of propagation to events, although this arrangement may be arbitrary in the sense that the real time process takes place simultaneously or that the sequence is unknown to climatic processes. A simplified version of his approach yields the cascade of effects for pre-industrial soci-eties (Fig. 2), excluding all feedback-loops which should be considered. This figure should just allow a first approxima-tion to the issue.
Biophysical impacts focus upon the production of food (yields per hectare, relation of seeded to harvested grains) and its availability for human production (also considering losses in storage). Economic impacts deal with consequences
on prices of food, animal feed and fire-wood. Grain prices were by far the most important parameters for business activity. At the same time they are the only economic data for which continuous series are widely available in Europe. Demographic and social impacts highlight consequences of subsistence crises such as malnutrition, social disruption and food-migration. A subsistence crisis is an integrated pro-cess in which nature and society interact. Its severity, how-ever measured, depends on one hand on the magnitude of the biophysical impact. On the other hand, it also hinges on the preparedness of the people involved and on the effi-ciency of the measures and strategies that are taken to deal with the crisis. The significance of human intervention in the process increased from top to bottom at the expense of cli-mate impacts. There were few options available to dampen biophysical impacts, whereas economic measures and social assistance could considerably reduce social disruption. Of course, interactive models, including the societal responses to biophysical and economic impacts in terms of positive or negative feedback, would be more realistic than linear mod-els (Pfister, 2006). But Kates (1985) correctly notes that it is easier to draw schematics than to describe what actually occurs.
4 Modelling Little Ice Age-type impacts
The Little Ice Age (LIA) was the most recent period dur-ing which glaciers maintained an expanded position on most parts of the globe, whereas their fronts oscillated about in advanced positions (Grove, 2001). The LIA was a simulta-neous, world-wide phenomenon which nonetheless allowed for considerable regional and local variation.
In the Alps, three phases of maximum glacier extension are distinguished: the first one around 1385, the second one in the mid-seventeenth century, and the third one around 1860 (Holzhauser, 2002). Wanner (2000) coined the term of “Little Ice Age-type events” (LIATE) to designate the three far-reaching glacier advances known from the last millen-nium. Each of the three LIATE was the outcome of a spe-cific combination of seasonal patterns of temperature and precipitation (Luterbacher et al., 2000, 2004; Casty et al., 2005; Xoplaki et al., 2005; Pauling et al., 2006). There is no single, long-term climatic trend which agrees with the advanced position of glaciers during the LIA. A multitude of interacting seasonal patterns of temperature and precipita-tion either positively or negatively affected the mass-balance of glaciers. Extended cold spells during the winter half-year (October through March or April) were the ear-marking feature of climate throughout the LIA: Severe winters were more frequent and more severe, both in terms of duration and coldness, during the period of the LIA compared to the Me-dieval Warm Period and the twentieth century global warm-ing (Luterbacher et al., 2004; Xoplaki et al., 2005). However, the cold and dryness of winters did not significantly affect the
mass balance of glaciers (Holzhauser and Zumb¨uhl, 1988; Holzhauser et al., 2005).
Far-reaching advances occurred when very cold springs and autumns coincided with chilly and wet mid-summers. The last “year without a summer” occurred in 1816, but many more of them are documented during the previous part of the millennium. They were the crucial elements underly-ing the LIATE. Most, if not all of them, were triggered by volcanic eruptions in the tropics, which generated a globe-girdling veil of volcanic dust (Harington, 1992). The spatial dimension of years without a summer was usually limited to mainland Europe north of the Alps, stretching from the Parisian Basin in the West to the Russian border in the East. Conditions in the west of France, Ireland, Iceland and Russia were usually better, whereas those in the Mediterranean were fundamentally different (Luterbacher et al., 2002, 2004; Xo-plaki et al., 2005). The effect of years without a summer were counterbalanced from time to time by clusters of warm and dry summers (e.g., in the 1720s) which caused melting-back on the glaciers.
Under the conditions of the Little Ice Age climate, two kinds of impacts were detrimental for agriculture in western and central Europe. Long wet spells during the harvest pe-riod had the most devastating impact. Continuous rains low-ered the flour content of the grains and made them vulnera-ble to mold infections and attacks of grain weevil (Sitophilus granarius) (Kaplan, 1976). Huge losses caused by insects and fungi during winter storage lead to surges of grain prices in the subsequent spring. These effects can be hardly as-sessed today, let alone under the conditions of an Early Mod-ern economy. Besides long spells of rain in midsummer, cold springs did most harm to grain crops. From present-day agro-meteorological analyses it is known that grain yields depend on sufficient warmth and moisture in April (Hanus and Aimiller, 1978). Inversely, this implies that crops suf-fered from dry and cold springs, which were frequent during the Little Ice Age. An extended snow-cover was particularly harmful. When the snow-cover lasted for several months un-til March or April, winter grains were attacked by the fungus
Fusarium Nivale. Peasants often ploughed the choked plants
down and seeded spring grains in order to have some com-pensation for the lost crop (Pfister, 2005).
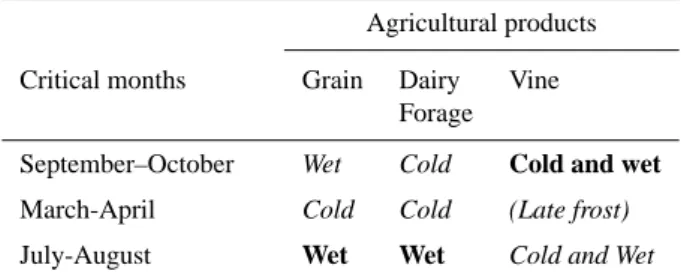
Considering the vulnerability of the main sources of food – using both present and historical knowledge – it turned out that a given set of specific sequences of weather spells over the agricultural year was likely to affect all sources of food at the same time leaving little margin for substitution. This model of a worst-case crop failure and, inversely, of a year of plenty has the properties mentioned in Table 1.
Table 1 summarizes the impact of adverse temperature and precipitation patterns on grain, dairy forage and vine pro-duction during the critical periods of the grain harvest year. Prolonged wet spells at sowing time in autumn reduced the amount of area sown and lowered the nitrogen content of the soil. Cold spells in September and October lessened the
sugar content of vine-must. Cold periods in March and April of the subsequent year decreased the volumes of the grain harvest and dairy forage production. Wet mid-summers af-fected all sources of food production. Most importantly, the simultaneous occurrence of rainy autumns with cold springs and wet mid-summers in subsequent years had a cumula-tive impact on agricultural production. The same combi-nation of seasonal patterns largely contributed to triggering far-reaching advances of glaciers. The economically adverse combination of climatic patterns is labelled Little Ice Age-type Impacts (LIATIMP) (Pfister, 2005). This parameter yields a yardstick to directly assess the severity of climate impacts whereas other parameters such as grain prices and demographic data are also the result of economic, social, mi-crobiological, physiological and political factors.
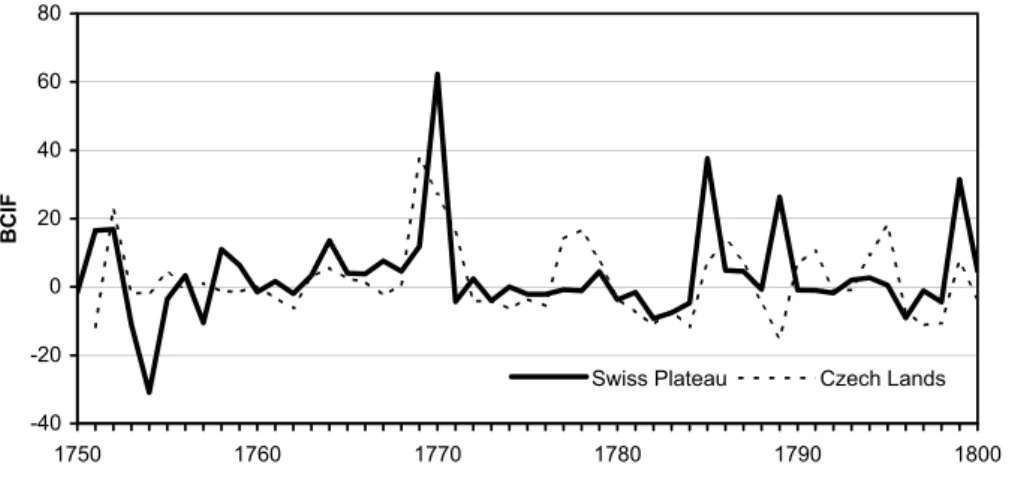
LIATIMP were simulated using a model, the properties of which are explained elsewhere (Pfister, 2006). They are solely based on monthly temperature and precipitation in-dices. Biophysical Climate Impact Factor (BCIF) was de-fined from the effect of weather on crops known from both contemporary reports and from present-day scientific knowl-edge (Table 1). Its computation is explained in the appendix. It was demonstrated for the period 1500 to 1860 that impact factors agree well with peaks in grain prices and that the difference of multi-decadal means of impacts (1767–1817, 1817–1843, 1844–1860) are statistically significant (Pfister, 2006). In the subsequent section, BCIF are provided for the Swiss Plateau and Czech Lands during the period 1750– 1800.
5 Differences in social vulnerability to climate in Switzerland and Czech Lands in the early 1770s Whatever the choice of events concerning which impacts are to be studied, an impacted group, activity or area exposed to these events must be selected. In general, the focus is on in-dividuals, populations or activities in the form of livelihoods or regional ecotypes. Two regions, the Czech Lands and the Swiss canton of Bern are compared in the subsequent sec-tion with regard to their vulnerability to climate in the early 1770s, when many regions in central Europe suffered from a major subsistence crisis.
The Czech Lands were at that time a part of the Austrian Hapsburg monarchy. They historically consisted of three parts – Bohemia, Moravia and southern Silesia – compris-ing an area that was not significantly different from the ac-tual Czech Republic (78 863 km2). According to a military census taken in 1770, the population was 4.172 million (Fi-alov´a et al., 1996). In the main breadbaskets concentrated in the Bohemian lowland along the Elbe and in the southern and central Moravian lowlands, rye was the main bread-grain besides wheat. People in the hilly zones lived on oats and dairy products. The estimated population density in 1770
Table 1. Weather-related impacts affecting the agricultural
produc-tion of tradiproduc-tional temperate-climate agriculture in central Europe (Pfister, 2005). Italics: weather conditions affecting the volume of harvests or animal production. Bold: weather conditions affecting the quality (i.e., the content in nutrients or sugar) of crops.
Agricultural products Critical months Grain Dairy Vine
Forage
September–October Wet Cold Cold and wet
March-April Cold Cold (Late frost)
July-August Wet Wet Cold and Wet
was 109 persons/km2 of “arable” (i.e. related to areas of arable land known from 1845 – see Jeleˇcek, 1995).
The ancient Swiss canton of Bern (prior to 1798) com-prised 8591 km2 and in 1770 its population totalled about 350 000 inhabitants. Its statistical coverage in the late eigh-teenth century is excellent (Pfister, 1975; Pfister and Egli, 1998; Brandenberger, 2004). The canton may be roughly divided into three eco-zones. In the “lowlands” (by Swiss standards), grain (spelt and wheat) grown within the three-field system was the dominant crop. In the hilly zone, grain cultivation and dairy production had about an equal share and potato cultivation on small plots was widespread. In the Alpine zone, dairy production was dominant, along with grain and potato cultivation on a micro-scale. The esti-mated population density in 1770 was 102 persons/km2of “arable” (i.e. related to areas of intensive cultivation known from 1865) (http://www.bernhist.ch, 10 July 2006). There-fore, the ecologically relevant population density was about on the same level in Bern Canton as in the Czech Lands.
In Switzerland, the sequence of adverse weather situations began in 1768 (Fig. 3). September of that year was extremely rainy, which delayed the period of ploughing and the sow-ing of winter grains. Expert farmers in western Switzerland, where wheat was the basic crop, justifiably worried about the coming harvest. March of 1769 was very cold and wet. Af-ter a warm spell in the second half of April and early May, snow fell again down to the plateau. The remaining part of the growing season was cool and wet. In the Alps, it repeat-edly snowed down to lower altitudes and the country was ravaged several times by far reaching hailstorms. Agricul-tural work was delayed. On 4 October, a fresh snow-cover took the peasants by surprise. Huge amounts of snow, up to 3 meters, accumulated during winter 1769/70 in Alpine val-leys. March and April were extremely cold. At altitudes of 700 m, the snow-cover remained for about seven months. A short warming spell in early May lead to rapid snow-melt and prompted the flowering of most fruit trees. Afterwards tem-peratures plunged below average again for several months
-40 -20 0 20 40 60 80 1750 1760 1770 1780 1790 1800 BCI F
Swiss Plateau Czech Lands
Fig. 3. Biophysical Climate Impact Factors (BCIF) on the Swiss Plateau and for the Czech Lands in the period 1750–1800.
and it often rained, particularly in July, when 22 rainy days were recorded at Basel. In September, parts of the country were ravaged by a far-reaching hailstorm. Subsequently, some patterns experienced in the previous year recurred, such as the advanced snowfall in October and the cold relapse in late April, but they were less severe. As of 1772, conditions were somewhat better than average (Pfister, 1975). Consid-ering the vulnerability of the main sources of food, three ele-ments – the excess rainfall in September 1768, the extremely cold spring 1770 and the nearly continuous rainfall in July of that year – turned out to be significant.
The course of weather in the Czech Lands was similar in many respects, though differences should not be overlooked (Fig. 3): sources report that spring 1769 was cool-wet, as was the period from May to July. The long-lasting wet spell in mid-summer let the ears sprout and lowered their flour content. In parts of the country, September was extremely rainy, which interfered with timely ploughing and sowing. Rain and snow fell in the first days of October. During most of winter 1769/70, fields and meadows were under wa-ter. Frost and snow dominated between 19 March and late April. In upper regions, the snow did not melt before the end of April. From early May to mid-June, warm and dry anticyclonic weather prevailed. July, however, was exceed-ingly rainy, as in the previous year. This anomaly brought about the famine. Conditions improved somewhat in win-ter 1770/71. Adverse weather patwin-terns during the critical two periods for agriculture – March–April and July–August – caused an extension and worsening of famine conditions in 1771: From late March to the end of April, a harsh cold relapse followed by rainy weather lead to widespread flood-ing. May was warm and dry, which postponed the sowing of spring grains. In most parts of the country, the beginning of harvest coincided with the onset of another long spell of rainy weather in July, which persisted until the last week of August (Br´azdil et al., 2001).
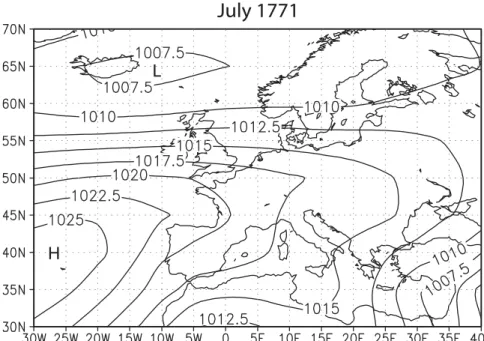
Comparing the multi-annual cluster of adverse weather patterns in Switzerland and in the Czech Lands in the early 1770s, the evidence leads to the following conclusion: In both countries, harvests were deficient in 1769 and in 1770 for more or less the same meteorological causes. However, whereas weather conditions considerably improved in 1771 in Switzerland, people in the Czech Lands were confronted with another harvest failure for the third year in succession. Seemingly, Switzerland was spared from such a calamity be-cause it was closer to the Azores anticyclone during the crit-ical months of July and August, 1771, as concluded from reconstructed monthly sea-level air pressure fields (Br´azdil et al., 2001) (Fig. 4).
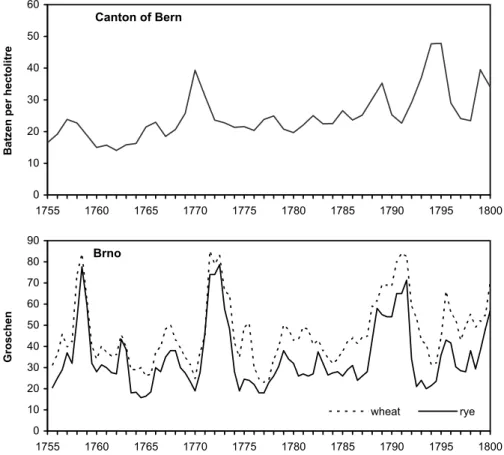
The amplitude of grain prices mirrors this difference in the magnitude of climate impacts (Fig. 5). Rye prices in Bern did not even double from 10.5 “Batzen” in the harvest year 1768/69 to the maximum of 20 “Batzen” in 1770/71. How-ever, average prices for rye tripled in Brno (Moravia) from 25.5 “Groschen” in 1769 to 78.7 “Groschen” in July 1772, and were even 4.1 times higher – from 18.3 “Groschen” in 1769 to 75 “Groschen” in July 1771 – for barley. The soar-ing of grain prices was even more dramatic in Bohemia. For example, in Kol´ın (central Bohemia), the prices – compared to 1769 – increased 3.3 times for rye (in 1771), 4.4 times for oats and 4.7 times for barley (both with maximum in 1772) (Br´azdil et al., 2001).
On a local scale, some price peaks were even more pro-nounced: According to the report of a local parson from the Erzgebirge, which is the hilly borderland between the Czech Lands and Saxony, the price for a bushel of rye rose tenfold between spring 1770 and early summer 1772, which led to outright starvation (Abel, 1972).
It now becomes crucial to address the issue of social vul-nerability. First of all, a closer examination of the two case-studies requires getting some insight into the political, social and administrative framework of the two territories. Moreover, attention needs to be given to the kind and the
Fig. 4. Reconstructed monthly sea-level air pressure fields for July and August, 1771 (from Br´azdil et al., 2001).
efficiency of “state” interventions on various levels. In case of a subsistence crisis, the ownership or the disposal of agri-cultural land was the key to the availability of food resources. Wealthy peasants and great land owners made disproportion-ately large profits, whereas the landless, the cottagers and the medium-sized peasants had to spend a much larger share of their budget on food.
The management of subsistence crises needs to be men-tioned along with wars, riots and epidemics as being among the most serious challenges that authorities had to face prior
to the age of railways. The grain-harvest shortfalls led to higher food prices, mounting unemployment rates and an in-crease in the scale of begging, vagrancy, crime and social disorder. As an inevitable consequence, these conditions re-sulted in welfare crises of varying magnitude. The combina-tion of environmental stress, economic hardship and social disarray tended to foster overcrowding and other changes in normal community spacing arrangements. Such condi-tions often appeared in the form of mortality peaks (Post, 1990). Authorities took an interest in combating the effect
Brno 0 10 20 30 40 50 60 70 80 90 1755 1760 1765 1770 1775 1780 1785 1790 1795 1800 Groschen wheat rye Canton of Bern 0 10 20 30 40 50 60 1755 1760 1765 1770 1775 1780 1785 1790 1795 1800 Batz en per hectol itre
Fig. 5. Annual grain prices in Bern (Switzerland) and in Brno (Moravia, Czech Lands) in the period 1755–1800. Prices in Bern are given for
spelt according to harvest years (August to July) (Pfister, 1975). Prices in Brno are given for wheat and rye in January and July (before and after harvest, respectively) (Br´azdil and Durd’´akov´a, 2000).
of crises, particularly considering the enormous population losses during the Thirty Years War. They aimed at increas-ing the number of soldiers and their income from taxes, which depended on the number of productive hands. Short-term measures usually involved the symbolic persecution of hoarders and speculators that were made responsible for the crisis, the hunt for foreign vagrant beggars and the distribu-tion of grain to the needy people in the capital and elsewhere. In the canton of Bern, social vulnerability was low by con-temporary standards. The burden of taxation was light be-cause the administration was relatively small and efficient. Moreover, there was no need to maintain a court and a stand-ing army. Young men had to get some military training within a rather inefficient militia system. In order to lessen the impact of crises, an area-covering network of grain stores was built up from the late seventeenth century. From that time onward, the potato provided an attractive alternative to grain cultivation for small-holders. The new crop got a first footing in the hills and mountain valleys of the canton, from where it spread to the lower areas. In the eighteenth century the variability of grain prices was somewhat smaller than in the cantons of Basel and Z¨urich. On one hand this needs to be credited to the potato, which served as a buffer because
its vulnerability to LIATIMP was somewhat different. On the other hand, the lower vulnerability was related to a better market integration (Persson, 1999). In the event of bumper crops, Bern used to sell grain to the adjacent territories. In the event of deficient harvests, grain was usually imported by or-der of the administration from the surrounding belt of grain-exporting territories such as the Alsace, Burgundy, Savoy and Swabia. In 1770/71 grain was acquired at a loss from as far as Sicily and Northern Africa (Brandenberger, 2004). From the mid-eighteenth century, the authorities shifted the focus of the crisis management towards complementing traditional short-term measures with sustained efforts to promote agri-cultural productivity, e.g. by facilitating the legal conditions for subdividing and privatizing communal pastures (Pfister, 1995). To sum up, in the late eighteenth century, the Bern Canton had already acquired a substantial degree of immu-nity to LIATIMPs.
Poor relief was another strategy of reducing vulnerability: The administration in the canton of Bern seesawed between spending on welfare and taking economic measures. During the eighteenth century, it established an area-covering sys-tem of poor relief in which the communities had to partici-pate. Fl¨uckiger-Strebel (2000) demonstrated that in the wake
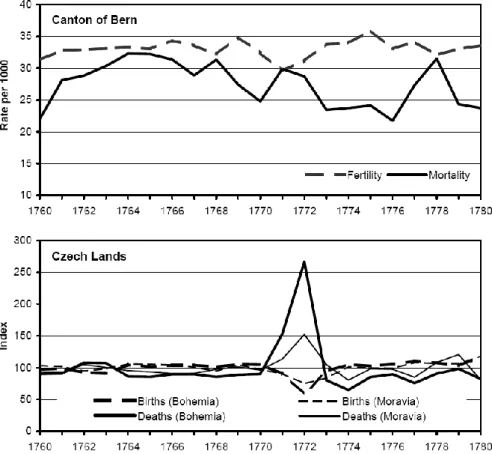
Fig. 6. Mortality and fertility in the canton of Bern and in the Czech Lands over the period 1760–1780 (for Bohemia and Moravia annual
index values were calculated with respect to the average of the whole period 1760–1780 equal 100).
of the crisis of 1770/71, a great number of people became permanently dependent on welfare. Obviously, many work-ing poor at the margin of pauperization were not able to buffer the shock of the fall in real income during the crisis. They had to sell most of their belongings for food and hence-forth they had to have continual assistance. The cost of social security rose much faster than any other entry of the budget and for this reason the communities had to bear a rising share of the burden.
How successful was this paternalist social policy? The severity of the crisis in demographic terms was assessed from the aggregate number of baptisms and burials available for every parish since 1730 (Pfister, 1995). From this evidence, it is concluded that both a rise in mortality and a drop in fer-tility – which would point to some nutritional problem – were nearly absent (Fig. 6). This result suggests that in the canton of Bern vulnerability was substantially reduced. However, in some cantons located further to the east, the demographic ef-fects of the crisis were more pronounced, as concluded from regional studies (Bielmann, 1972; Bucher, 1974; Sch¨urmann, 1974; Ruesch, 1979).
Social vulnerability to climatic impacts was much greater in the Czech Lands. There, broad strata of the population suffered from a heavy taxation and from a number of
oppres-sive feudal dues, among which compulsory work on large estates of the nobility, the so-called Robot and the obligation to provide draught animals for the transportation needs of the army and the state were the most onerous. In Northeastern Bohemia, a large number of people were ready to flee across the border to Prussia (Br´azdil et al., 2001).
This unfortunate situation was critically aggravated by the cluster of three harvest failures between 1770 and 1772. When alarming reports of the famine reached Vienna, Em-press Maria-Theresa and her court counsellors first of all took traditional administrative measures of crisis manage-ment. The authorities decreed a ban on exports and on distill-ing grain, and also demanded the persecution of hoarders and as well as implementing an inventory of grain stocks within the entire country. These measures, however, turned out to be largely inefficient. From June 1771, when the famine had already taken shocking dimensions, grain and flour were fi-nally hauled from stocks in Vienna and Hungary to the Czech Lands. Nonetheless, the imported amounts of grain were in-adequate for having an effect on prices. Thus, most of the needy people did not have the money to buy grain (Br´azdil et al., 2001). Emperor Joseph II, co-regent at the time, under-took a six-week journey (October–November 1771) through the Czech Lands to investigate the causes of the famine. He
left an extensive travel diary, full of information about the situation in different parts of Bohemia ( ˇRehoˇrovsk´y, 1904; Roub´ık, 1926; Weinzierl-Fischer, 1954).
The demographic toll of the famine was appalling. Ac-cording to contemporary assessment, Bohemia lost some 250 000 people (10% of its population) during the third year of famine between June 1771 and June 1772 (Fig. 6). It seems that many people died from typhoid fever. In Moravia and Silesia, the excess mortality was somewhat lower. The crises primarily affected the people who were engaged in ru-ral industries and the poor strata in the towns who had to rely on the market. It took 13 years before the pre-crisis level of population in the Czech Lands at the beginning of the cri-sis in 1770 was reached again (Fialov´a et al., 1996). The severe crisis in the early 1770s led to a pauperization of a broad strata of society, which formed the background to a violent serf uprising in 1775. On the other hand, the experi-ence of famine in the Czech Lands reduced prejudice against the potato, which previously was only grown as animal fod-der. Cultivating a small plot with potatoes significantly con-tributed to better surviving subsequent harvest failures. As a result, such a severe disaster did not occur any more (Br´azdil et al., 2001).
6 Conclusions
This article attempts to view socio-environmental interac-tions situated at different temporal and spatial scales in or-der to demonstrate their complexity and explore a new mod-elling approach: Macro-scale reconstructions of monthly air pressure, temperatures and precipitation for the entire Euro-pean continent provide the starting point. They are obtained from a variety of high-resolution documentary and natural data. It is concluded that the spatial dimension of climate impacts during the Little Ice Age never did affect Europe as a whole. The impacts always remained limited to cer-tain climatic zones of the continent. Considering the tempo-ral dimension, the modelling of biophysical impacts suggests that the frequency and severity of such impacts changed over time, thereby leading to multi-decadal periods of favourable and adverse climate.
The story of human vulnerability to climate, told along a chain of causation running from natural forcing to economics and to the level of political and social decision-making, re-quires a change from the macro-scale of generalization to the micro-scale of case-studies. Comparisons of case-studies would, in a sense, entail that some common properties are found between the cases. In the present studies, however, differences largely prevail. Firstly, the surface of the Czech Lands and its population were much larger than those of the canton of Bern. Secondly, the duration of climatic stress was considerably shorter in Switzerland, considering the lower impact factor and the lower variability of grain prices. Ap-parently, both countries experienced a more or less similar
series of impacts in 1769 and 1770. However, Switzerland was closer to the sphere of influence of the Azores anticy-clone in 1771 than the Czech Lands and its location more to the south-west, and for this reason the critical month of July was less rainy than more to the north-east. This result is particularly noteworthy because it points to the fact that rela-tively small differences in longitude and latitude between two regions could be associated with substantial differences in climate impacts. With regard to social vulnerability, it goes without saying that social vulnerability of this canton was less pronounced than that in the Czech Lands. This is largely due to the inherent properties of the two political systems. The Bernese authorities could not rely on a standing army to suppress local uprisings. They legitimized their governance with a paternalist ideology, which implied that they had to care for their subjects in case of distress. On the other hand, it seems that the Hapsburg monarchy and its administration were ill-prepared to face the formidable challenge of three successive harvest failures in one of its core lands. Moreover, the oppressive feudal structures could not be changed easily because they were indispensable for the maintenance of the political system. Finally, the mercantile policies blocking the export of raw materials led to serious economic stress in the northern proto-industrial parts of the country. Baron Kressel, who was sent in February 1771 to investigate the situation in Bohemia, reported that many people were simply too poor to buy the grain available on the market (Weinzierl-Fischer, 1954). More comparative studies of socio-environmental in-teractions should be encouraged, albeit not in view of arriv-ing at a universalized picture of social vulnerability to cli-mate impacts, as was repeatedly attempted for global clicli-mate change studies for the last millennium. Quite the contrary: It would be worthwhile to illustrate the plurality of human responses and solutions in mitigating social vulnerability to climate variability.
Appendix A
Computing Biophysical Climate Impact Factors (Box and Jenkins, 1970; Box and Tiao, 1975; Pfister, 2006)
The basic climate data are monthly temperature (T) and precipitation (P) indices arranged in a 7-degree classification (Pfister, 1998):
3 = extremely warm/wet, 2 = very warm/wet, 1 = warm/wet, 0 = normal, –1 = cold/dry, –2 = very cold/dry, –3 = extremely cold/dry.
BCIFs are known to be nonlinear. Thus, temperature (T) and precipitation (P) indices were recoded as follows:
5 = extremely warm/wet, 3 = very warm/wet, 1 = warm/wet, 0 = normal, –1 = cold/dry, –3 = very cold/dry, –5 = extremely cold/dry.
The annual BCIFs were then computed and can be summarized as follows:
If (T–Mar + T–Apr) < (T–Mar[N + 1] + T–Apr[N + 1]); then (2 × T–Mar + 3 × T–Apr) / –2;
else (T–Mar[N + 1] + 2 × T–Apr[N + 1] / –2) × if (P–Jul + P–Aug) < –6;
then (3 × P–Jul + P–Aug) / –4; else (3 × P–Jul + P–Aug) / 3 + (2 × P–Sep + 3 × P–Okt) / 5 + (3 × T–Sep + T–Okt) / –2
+ (2 × P–Mar + 2 × P–Apr + P–Mai) / 5 + (T–Mai + T–Jun + T–Jul + T–Aug) / –4
The first two terms require the most explication. The first term reflects spring temperatures. For grain prices, both the spring temperatures within a current meteorological year and those in the subsequent year need to be considered. The higher value goes into the equation. As spring temperatures are known to be significant for grain production, March and April temperatures are weighted.
The second term concerns precipitation patterns during the harvest period, which was from early July to early August. Extremely rainy conditions during this midsummer period had the most devastating impact and they had to be accord-ingly weighted.
The first and the second terms are then multiplied to sim-ulate the summation effect, which resulted from the coinci-dence of a very cold spring and a very rainy midsummer in the same or in the subsequent year. Four terms represent fac-tors of minor importance: precipitation and temperatures in September and October, precipitation in spring and tempera-tures from May to September.
Acknowledgements. C. Pfister was supported by the Swiss NCCR
“Climate” Program and Rudolf Br´azdil by the research project M ˇSM0021622412 (INCHEMBIOL). P.-A. Nielson is acknowl-edged for carefully reading the manuscript for style corrections, J. Steinmann has drawn the figures, J. Mackov´a has prepared figures for press and lic.-phil. S. Summermatter has checked and complemented the bibliography. The reviewers, E. Landsteiner, Vienna, and F. Mauelshagen, Z¨urich, took the time to deal with the manuscript meticulously. Their comments and suggestions substantially contributed to improving the paper.
Edited by: H. Wanner
References
Abel, W.: Massenarmut und Hungerkrisen im vorindustriellen Deutschland, Vanderhoeck und Ruprecht, G¨ottingen, 1972. Bankoff, G.: Cultures of Disaster: Society and Natural Hazard in
the Philippines, Routledge, Curzon, London, 2003.
Barriendos, M.: Climate and culture in Spain. Religious responses to extreme climatic events in the Hispanic Kingdoms (16th–19th centuries), in: Kulturelle Konsequenzen der “Kleinen Eiszeit”,
edited by: Behringer, W., Lehmann, H., and Pfister, C., Vanden-hoeck & Ruprecht, G¨ottingen, 379–414, 2005.
Bauernfeind, W.: Materielle Grundstrukturen im Sp¨atmittelalter und der Fr¨uhen Neuzeit – Preisentwicklung und Agrarkonjunk-tur am N¨urnberger Getreidemarkt von 1339 bis 1670, Univer-sit¨atsbuchhandlung Korn und Berg, N¨urnberg, 1993.
Bauernfeind, W. and Woitek, U.: The influence of climatic change on price fluctuations in Germany during the 16th century price revolution, in: Climatic Variability in Sixteenth-Century Europe and Its Social Dimension, edited by: Pfister, C., Br´azdil, R., and Glaser, R., Kluwer Academic Publishers, Dordrecht, 303–321, 1999.
Bielmann, J.: Die Lebensverh¨altnisse im Urnerland w¨ahrend des 18. und zu Beginn des 19. Jahrhunderts, Helbing und Lichten-hahn, Basel, 1972.
Box, G. E. P. and Jenkins, G. M.: Time Series Analysis: Forecasting and Control, Cambridge University Press, Cambridge, 1970. Box, G. E. P. and Tiao, G. C.: Intervention analysis with
applica-tions to economic and environmental problems, J. Am. Statist. Assn., 70, 70–79, 1975.
Bradley, R. S.: Paleoclimatology. Reconstructing Climates of the Quaternary, Academic Press, San Diego, London, Boston, New York, Sydney, Tokyo, Toronto, 1999.
Brandenberger, A.: Ausbruch aus der “Malthusianischen Falle”: Versorgungslage und Wirtschaftsentwicklung im Staate Bern 1755–1797, Peter Lang, Bern, 2004.
Br´azdil, R. and Durd’´akov´a, M.: The effect of weather factors on fluctuations of grain prices in the Czech Lands in the 16th–18th centuries, Instytut Geografii UJ – Prace Geograficzne, 108, 19– 25, 2000.
Br´azdil, R. and Kotyza, O.: History of Weather and Climate in the Czech Lands, IV. Utilisation of economic sources for the study of climate fluctuation at Louny and surroundings in the fifteenth-seventeenth centuries, Masaryk University, Brno, 2000. Br´azdil, R., Val´aˇsek, H., Luterbacher, J., and Mackov´a, J.:
Hungerjahre 1770–1772 in den B¨ohmischen L¨andern: Verlauf, Meteorologische Ursachen und Auswirkungen, ¨Osterreichische Zeitschrift f¨ur Geschichtswissenschaften, 2, 44–78, 2001. Br´azdil, R., Val´aˇsek, H., and Mackov´a, J.: Climate in the Czech
Lands during the 1780s in light of the daily weather records of parson Karel Bernard Hein of Hodonice (southwestern Moravia): Comparison of documentary and instrumental data, Climatic Change, 60, 297–327, 2003.
Br´azdil, R., Pfister, C., Wanner, H., von Storch, H., and Luterbacher, J.: Historical climatology in Europe – the state of the art, Cli-matic Change, 70, 363–430, 2005.
Brooks, K. N.: Hydrology and the Management of Watersheds, Iowa State University Press, Ames, Iowa, 2003.
Bucher, S.: Bev¨olkerung und Wirtschaft des Amtes Entlebuch im 18. Jahrhundert – Eine Regionalstudie als Beitrag zur Sozial- und Wirtschaftsgeschichte der Schweiz im Ancien R´egime, Rex Ver-lag, Luzern, 1974.
Casty, C., Wanner, H., Luterbacher, J., Esper, J., and B¨ohm, R.: Temperature and precipitation variability in the European Alps since 1500, Int. J. Climatol., 25, 1855–1880, 2005.
Chuine, I., Yiou, P., Viovy, N., Seguin, B., Daux, V., and Le Roy Ladurie, E.: Grape ripening as a past climate indicator, Nature, 432, 289–290, 2004.
Fialov´a, L., Horsk´a, P., Kuˇcera, M., Maur, E., Musil, J., Stloukal, M.: Dˇejiny obyvatelstva ˇcesk´ych zem´ı, Mlad´a fronta, Praha, 1996.
Fl¨uckiger-Strebel, E.: Zwischen Wohlfahrt und Staats¨okono-mie: Armenf¨ursorge auf der bernischen Landschaft im 18. Jahrhundert, Diss. Phil.-hist. Bern, 2000.
Fogel, R. W.: Second thoughts on the European escape from hunger, famines, chronic malnutrition, and mortality rates, in: Nutrition and Poverty, edited by: Osmani, S. R., Clarendon, Oxford and New York, 243–286, 1992.
Grove, J.: The onset of the Little Ice Age, in: History and Climate: Memories of the Future?, edited by: Jones, P. D., Ogilvie, A. E. J., Davies, T. D., and Briffa, K. R., Kluwer Academic/Plenum Publishers, New York, Boston, Dordrecht, London, Moscow, 153–185, 2001.
Hanus, H. and Aimiller, O.: Ertragsvorhersage aus Witterungs-daten: unter besonderer Ber¨ucksichtigung methodischer Prob-leme, Parey, Berlin, 1978.
Harington, C. R. (Ed.): The Year Without a Summer? World Cli-mate in 1816, Canadian Museum of Nature, Ottawa, 1992. Holzhauser, H.: Dendrochronologische Auswertung fossiler H¨olzer
zur Rekonstruktion der nacheiszeitlichen Gletschergeschichte, Schweizerische Zeitschrift f¨ur Forstwesen, 15, 17–28, 2002. Holzhauser, H. and Zumb¨uhl, H. J.: Alpengletscher in der Kleinen
Eiszeit, Die Alpen, 64, 129–322, 1988.
Holzhauser, H. P., Magny, M., and Zumbuehl, H. J.: Glacier and lake-level variations in west-central Europe over the last 3500 years, The Holocene, 15, 789–801, 2005.
Jarraud, M.: Foreword, (Special Issue Increasing Climatic Variabil-ity and Change, Reducing the VulnerabilVariabil-ity of Agriculture and Forestry), Climatic Change, 70, 5–7, 2005.
Jeleˇcek, L.: Vyuˇzit´ı p˚udn´ıho fondu ˇCesk´e republiky 1845–1995: hlavn´ı trendy a ˇsirˇs´ı souvislosti, Sborn´ık ˇCesk´e geografick´e spoleˇcnosti, 100, 276–291, 1995.
Kaplan, S. L.: Bread, Politics and Political Economy in the Reign of Louis XV, Nijhoff, Den Haag, 1976.
Kates, R.W.: The interaction of climate and society, in: Climate Im-pact Assessment. Studies of the Interaction of Climate and Soci-ety, edited by: Kates, R. W., Ausubel, J. H., and Berberian, M., John Wiley, Chichester, New York, Brisbane, Toronto, Singa-pore, 3–36, 1985.
Landsteiner, E.: Wenig Brot und saurer Wein, Kontinuit¨at und Wandel in der zentraleurop¨aischen Ern¨ahrungskultur im letzten Drittel des 16. Jahrhunderts, in: Kulturelle Konsequenzen der “Kleinen Eiszeit”, edited by: Behringer, W., Lehmann, H., and Pfister, C., Vandenhoeck & Ruprecht, G¨ottingen, 87–147, 2005. Le Roy Ladurie, E.: Zero population growth, in: Population and
Subsistence in Sixteenth Century Rural France, Peasant Studies, 1/2, 60–65, 1972.
Luhmann, N.: Okologische Kommunikation, Kann die mod-¨ erne Gesellschaft sich auf ¨okologische Gef¨ahrdungen einstellen? Westdeutscher Verlag, Opladen, 1986.
Luterbacher, J., Dietrich, D., Xoplaki, E., Grosjean, M., and Wan-ner, H.: European seasonal and annual temperature variability, trends and extremes since 1500, Science, 303, 1499–1503, 2004. Luterbacher, J., Rickli, R., Tinguely, C., Xoplaki, E., Sch¨upbach, E., Dietrich, D., H¨usler, J., Amb¨uhl, M., Pfister, C., Beeli, P., Diet-rich, U., Dannecker, A., Davies, T. D., Jones, P. D., Slonosky, V., Ogilvie, A. E. J., Maheras, P., Kolyva-Machera, F., Mart´ın-Vide,
J., Barriendos, M., Alcoforado, M. J., Nunes, M. F., J´onsson, T., Glaser, R., Jacobeit, J., Beck, C., Philipp, A., Beyer, U., Kaas, E., Schmith, T., B¨arring, L., J¨onsson, P., R´acz, L., and Wanner, H.: Monthly mean pressure reconstruction for the Late Maunder Minimum Period (AD 1675–1715), Int. J. Climatol., 20, 1049– 1066, 2000.
Luterbacher, J., Xoplaki, E., Dietrich, D., Rickli, R., Jacobeit, J., Beck, C., Gyalistras, D., Schmutz, C., and Wanner, H.: Recon-struction of sea level pressure fields over the Eastern North At-lantic and Europe back to 1500, Clim. Dyn., 18, 545–561, 2002. Murton, B.: Famine, in: The Cambridge World History of Food, Vol. 2, edited by: Kiple, K. F. and Ornelas, K. C., Cambridge University Press, Cambridge, 1411–1427, 2000.
Newman, L. F.: Hunger in History, Food Shortage, Poverty and Deprivation, Oxford University Press, Oxford, 1990.
Oliver-Smith, A.: Theorizing vulnerability in a globalized world, A political ecological perspective, in: Mapping Vulnerability: Dis-asters, Development and People, edited by: Bankoff, G., Frerks, G., and Hilhorst, D., Sterling VA, London, 10–24, 2004. Pauling, A., Luterbacher, J., Casty, C., and Wanner, H.: 500 years
of gridded high-resolution precipitation reconstructions over Eu-rope and the connection to large-scale circulation, Clim. Dyn., 26, 387–405, 2006.
Pauling, A., Luterbacher, J., and Wanner, H.: Evaluation of prox-ies for European and North Atlantic temperature field recon-structions, Geophys. Res. Lett., 30, doi:10.1029/2003GL017589, 2003.
Pelling, M.: Natural Disasters and Development in a Globalizing World, Routledge, London, 2003.
Persson, K. G.: Grain Markets in Europe, 1500–1900: Integra-tion and DeregulaIntegra-tion, Cambridge University Press, Cambridge, 1999.
Pfister, C.: Agrarkonjunktur und Witterungsverlauf im westlichen Schweizer Mittelland 1755–1797, Ein Beitrag zur Umwelt- und Wirtschaftsgeschichte des 18. Jahrhunderts, Diss. phil.-hist. Bern 1974, Lang, Bern, 1975.
Pfister, C.: Klimageschichte der Schweiz 1525–1860, Das Klima der Schweiz und seine Bedeutung in der Geschichte von Bev¨olkerung und Landwirtschaft, Paul Haupt, Bern, 1984. Pfister, C.: Im Strom der Modernisierung: Bev¨olkerung, Wirtschaft
und Umwelt 1700–1914, Paul Haupt, Bern, 1995.
Pfister C.: Raum-zeitliche Rekonstruktion von Witterungsanoma-lien und Naturkatastrophen 1496–1995, Verlag der Fachvereine VdF, Z¨urich, 1998.
Pfister, C.: Wetternachhersage, 500 Jahre Klimavariationen und Naturkatastrophen 1496–1995, Verlag Paul Haupt, Bern, Stuttgart, Wien, 1999.
Pfister, C.: Klimawandel in der Geschichte Europas, Zur En-twicklung und zum Potenzial der historischen Klimatologie,
¨
Osterreichische Zeitschrift f¨ur Geschichtswissenschaften, 12, 7– 43, 2001.
Pfister, C.: Weeping in the Snow, The second period of Little Ice Age-type Impacts, 1570–1630, in: Kulturelle Konsequenzen der “Kleinen Eiszeit”, edited by: Behringer, W., Lehmann, H., and Pfister, C., Vandenhoeck & Ruprecht, G¨ottingen, 31–86, 2005. Pfister, C.: Little Ice Age-type Impacts and the mitigation of
so-cial vulnerability to climate in the Swiss canton of Bern prior to 1800, in: Integrated History and Future of People on Earth (IHOPE), edited by: Costanza, R., Graumlich, L. J., and Steffen,
W., Dahlem Workshop Report 96, MIT Press, Cambridge MA, in press, 2006.
Pfister, C. and Bareiss, W.: The climate in Paris between 1675 and 1715 according to the Meteorological Journal of Louis Morin, in: Climatic Trends and Anomalies in Europe 1675–1715, edited by: Frenzel, B., Pfister, C., and Gl¨aser, B., Gustav Fischer Verlag, Stuttgart, Jena, New York, 151–171, 1994.
Pfister, C. and Br´azdil, R.: Climatic variability in sixteenth-century Europe and its social dimension: A synthesis, Climatic Change, 43, 5–53, 1999.
Pfister, C., Br´azdil, R., Obrebska-Starkel, B., Starkel, L., and von Storch, H.: Strides made in reconstructing past weather and cli-mate, Eos, Transactions, American Geophysical Union, 82, 248, 2001.
Pfister, C. and Egli, H.-R.: Historisch-statistischer Atlas des Kan-tons Bern, 1750–1995, Umwelt, Bev¨olkerung, Wirtschaft, Poli-tik, Historischer Verein des Kantons Bern, Bern, 1998.
Piervitali, E. and Colacino, M.: Evidence of drought in Western Sicily during the period 1565–1915 from liturgical offices, Cli-matic Change, 49, 225–238, 2001.
Post, J. D.: Nutritional status and mortality in eighteenth-century Europe, in: Hunger in History, Food Shortage, Poverty and De-privation, edited by: Newman, L. F., Basil Blackwell, Oxford, 241–280, 1990.
ˇ
Rehoˇrovsk´y, J. M.: Cestopis c´ısaˇre Josefa II. z r. 1771, Naˇse doba, 11, 9–16, 103–111, 171–177, 265–271, 1904.
Roub´ık, F.: Relace c´ısaˇre Josefa II. o jeho cestˇe do ˇCech, Moravy a Slezska r. 1771, ˇCasopis pro dˇejiny venkova, 13, 102–119, 1926. Ruesch, H.: Lebensverh¨altnisse in einem fr¨uhen schweizerischen
Industriegebiet, Helbing & Lichtenhahn, Basel, 1979.
Sch¨urmann, M.: Bev¨olkerung, Wirtschaft und Gesellschaft in Appenzell-Innerrhoden im 18. und fr¨uhen 19. Jahrhundert, Diss. phil.-hist. Basel, Basel, 1974.
Slonosky, V. C., Jones, P. D., and Davies, T. D.: Instrumental pres-sure observation from the 17th and 18th centuries: London and Paris, Int. J. Climatol., 21, 285–298, 2001.
Titow, J. Z.: Evidence of weather in the Account Rolls of the Bishopric of Winchester 1209–1350, Economic History Review, 1960, 360–407, 1960.
Titow, J. Z.: Le Climat `a travers les rˆoles de comptabilit`e de Winch-ester (1350–1450), Annales E.S.C., 1970, 312–350, 1970. Van Engelen, A. F. V., Buisman, J., and IJnsen, F.: A millennium
of weather, winds and water in the Low Countries, in: History and Climate: Memories of the Future?, edited by: Jones, P. D., Ogilvie, A. E. J., Davies, T. D., and Briffa, K. R., Kluwer Aca-demic/Plenum Publishers, New York, Boston, Dordrecht, Lon-don, Moscow, 101–124, 2001.
Wang, R., Wang, S., and Fraedrich, K.: An approach to reconstruc-tion of temperature on a seasonal basis using historical docu-ments from China, Int. J. Climatol., 11, 381–392, 1991. Wanner, H.: Vom Ende der letzten Eiszeit zum mittelalterlichen
Kli-maoptimum, in: Klimawandel im Schweizer Alpenraum, edited by: Wanner, H., Gyalistras, D., Luterbacher, J., Rickli, R., Salvisberg, E., Schmutz, C., and Br¨onnimann, S., VdF, Z¨urich, 73–78, 2000.
Watts, M. J. and Bohle, H. G.: The space of vulnerability, The causal structure of hunger and famine, Progress in Human Ge-ography, 71, 43–67, 1993.
Weinzierl-Fischer, E.: Die Bek¨ampfung der Hungersnot in B¨ohmen 1770–1772 durch Maria Theresia und Joseph II, Mitteilungen des ¨Osterreichischen Staatsarchivs, 7, 478–514, 1954.
Xoplaki, E., Luterbacher, J., Paeth, H., Dietrich, D., Steiner N., Grosjean, M., and Wanner, H.: European spring and autumn tem-perature variability and change of extremes over the last half mil-lennium, Geophys. Res. Lett., 32, L15713, 2005.