HAL Id: hal-03052753
https://hal-cnrs.archives-ouvertes.fr/hal-03052753
Submitted on 10 Dec 2020HAL is a multi-disciplinary open access archive for the deposit and dissemination of sci-entific research documents, whether they are pub-lished or not. The documents may come from teaching and research institutions in France or abroad, or from public or private research centers.
L’archive ouverte pluridisciplinaire HAL, est destinée au dépôt et à la diffusion de documents scientifiques de niveau recherche, publiés ou non, émanant des établissements d’enseignement et de recherche français ou étrangers, des laboratoires publics ou privés.
Distributed under a Creative Commons Attribution| 4.0 International License
Physical modeling of a sliding clamp mechanism for the
spreading of ParB at short genomic distance from
bacterial centromere sites
Jean-Charles Walter, Jerome Rech, Nils-Ole Walliser, Jerome Dorignac,
Frederic Geniet, John Palmeri, Andrea Parmeggiani, Jean-Yves Bouet
To cite this version:
Jean-Charles Walter, Jerome Rech, Nils-Ole Walliser, Jerome Dorignac, Frederic Geniet, et al.. Phys-ical modeling of a sliding clamp mechanism for the spreading of ParB at short genomic distance from bacterial centromere sites. Iscience, 2020, 23 (12), pp.101861. �10.1016/j.isci.2020.101861�. �hal-03052753�
Physical modeling of a sliding clamp mechanism for the spreading of ParB at short genomic distance from bacterial centromere sites
Jean-Charles Walter1, Jérôme Rech2, Nils-Ole Walliser1, Jérôme Dorignac1, Frédéric Geniet1, John Palmeri1, Andrea Parmeggiani1,3, Jean-Yves Bouet2,4
1Laboratoire Charles Coulomb (L2C), Univ. Montpellier, CNRS, 34095 Montpellier, France. 2Laboratoire de Microbiologie et de Génétique Moléculaires (LMGM), CBI, CNRS, Univ.
Toulouse, UPS, 31062 Toulouse, France.
3Laboratory of Parasite Host Interactions (LPHI), Univ. Montpellier, CNRS, 34095 Montpellier,
France.
4Lead contact: Jean-Yves Bouet, jean-yves.bouet@univ-tlse3.fr
Corresponding authors: Jean-Charles Walter, jean-charles.walter@umontpellier.fr; Jean-Yves Bouet, jean-yves.bouet@univ-tlse3.fr
Summary
Bacterial ParB partitioning proteins involved in chromosomes and low-copy-number plasmid segregation are CTP-dependent molecular switches. CTP-binding converts ParB dimers to DNA clamps, allowing unidimensional diffusion along the DNA. This sliding property has been proposed to explain the ParB spreading over large distances from parS centromere sites where ParB is specifically loaded. We modeled such a ‘Clamping & sliding’ mechanism as a typical reaction-diffusion system, compared it to the F-plasmid ParB DNA binding pattern, and found that it can account neither for the long range of ParB binding to DNA, nor for the rapid assembly kinetics observed in vivo after parS duplication. Also, it predicts a strong effect on the F-plasmid ParB binding pattern from the presence of a roadblock that is not observed in ChIP-seq. We conclude that although ‘Clamping & sliding’ can occur at short distances from parS, another mechanism must apply for ParB recruitment at larger genomic distances.
Introduction
Faithful segregation of the full set of genetic information is essential for all living cells. In bacteria, segregation follows DNA replication and involves the separation and transportation of the new copies in opposite directions along the longitudinal cell axis (Bouet et al., 2014). Partition of chromosomes and low copy number plasmids mainly relies on ParABS systems (for reviews; Bouet and Funnell, 2019; Jalal and Le, 2020). They encode a Walker-type ATPase (ParA) and a site-specific DNA binding protein (ParB), which binds to parS centromere sites. ParA action separates the ParB assemblies nucleated on parS sites, which are always located near the origin of replication, and actively relocates them toward opposite cell poles. This process ensures that every daughter cell receives at least one copy of the replicated DNA molecules.
Recent studies on the bacterial partition protein ParBs have revealed a new activity, namely CTP binding (Jalal et al., 2020; Osorio-Valeriano et al., 2019; Soh et al., 2019). ParB proteins thus now emerge as a new class of CTP-dependent molecular switches. ParB dimers bind specifically to a few short parS DNA sites, usually 16-bp, which subsequently nucleate the assembly of hundreds of ParB in their spatial vicinity. This leads to the formation of highly concentrated but dynamic nucleoprotein complexes of small size (~40 nm; Guilhas et al., 2020), with ParB binding to non-specific DNA over large genomic distances (> 10-Kb; e.g. Breier and Grossman, 2007; Debaugny et al., 2018; Lagage et al., 2016; Rodionov et al., 1999; Sanchez et al., 2015), and visible as bright foci in fluorescent microscopy (Breier and Grossman, 2007; Diaz et al., 2015, 4694; Erdmann et al., 1999; Lagage et al., 2016; Lim et al., 2014). Biochemical studies in the presence of CTP and the resolution of a ParB-CDP co-crystal structure suggested that a sliding clamp mechanism controlled by CTP binding could be the basis for this clustering of numerous ParBs around the parS sequence (Jalal et al., 2020; Soh et al., 2019).
The ParB-DNA nucleoprotein complex is involved in the intracellular positioning of the
parS centromere sequences and their segregation toward opposite poles of the cell through its
interaction with the cognate ParA ATPase (for reviews; Bouet and Funnell, 2019; Jalal and Le, 2020). CTP binding and hydrolysis control ParB activities (Jalal et al., 2020; Osorio-Valeriano et al., 2019; Soh et al., 2019). Apo-ParB dimers adopt an open conformation and bind to DNA (Fig. 1A). Specific binding to parS activates CTP binding which induces a conformational change that converts ParB dimers into a closed conformation (gate closure) entrapping double strand DNA. The clamped-ParB favor parS unbinding as suggested by (i) the steric clash for parS binding modeled in the CDP-bound ParB crystal structure (Soh et al., 2019) and (ii) the ParB release from
parS in the presence of CTP (Jalal et al., 2020). Upon release from parS sites, clamped-ParB
dimers would thus remain trapped along the DNA on either side of parS until the gate opens to release ParB from the DNA (Fig. 1B). Soh et al. (2019) thus proposed that a ParB sliding clamp mechanism, restricting ParB around parS sites, might give rise to the characteristic ParB DNA binding distribution observed by ChIP assays (e.g. Breier and Grossman, 2007; Rodionov et al.,
1999; Sanchez et al., 2015). Importantly, CTP binding and hydrolysis by ParB proteins was demonstrated for plasmid- and chromosomally-encoded ParABS systems (Soh et al., 2019).
ParB was found to cluster around parS based (i) on gene silencing in the vicinity of parS (Lynch and Wang, 1995; Rodionov et al., 1999), (ii) on ParB binding over more than 10-Kb on both sides of parS (Murray et al., 2006; Rodionov et al., 1999; Sanchez et al., 2015), and (iii) on the lower accessibility of proteins around parS DNA (Bouet and Lane, 2009; Lynch and Wang, 1995). However, the quantity of ParB dimers present in the cell is insufficient to continuously cover the observed spreading zone. Several groups have carried out physical modeling studies (Broedersz et al., 2014; Debaugny et al., 2018; Sanchez et al., 2015; Walter et al., 2020; Walter et al., 2018) to investigate the mechanisms that could account for the assembly of ParB (reviewed in Funnell, 2016; Jalal and Le, 2020). By testing the ‘1D-spreading’, ‘Spreading & bridging’ in the strong coupling limit, ‘Looping & clustering’ and ‘Nucleation & caging’ models on high-resolution ChIP-sequencing data, only the latter model based on low affinity but synergistic interactions actually fits best observations (Debaugny et al., 2018). However, all these models were proposed before the finding that ParB can clamp and diffuse unidimensionally along the DNA.
Here, we developed a physical modeling approach based on the newly proposed sliding mechanism, namely ‘Clamping & sliding’, involving the loading of ParB at parS sites with subsequent free diffusion as a protein clamp along the DNA track, followed by its unbinding upon clamp opening (Fig. 1B). We then compared this novel physical model with the ParB DNA binding pattern from high-resolution ChIP-sequencing data reported for the ParABS system of the F plasmid. Using recent estimations of the release and unbinding parameters (Jalal et al., 2020) and of the diffusion coefficient (Guilhas et al., 2020), we showed on the basis of a physical analysis with biological parameters of incoming and outgoing flux of ParB on DNA that ‘Clamping & sliding’ is not able to account for the number of particles found in vivo on the F plasmid, especially at large distances from parS. Importantly, one-dimensional translocation is expected to be interrupted by obstacles on DNA. The modeling of the effect of a roadblock failed to describe the ChIP-seq pattern obtained in the presence of a natural roadblock. Moreover, imaging ParB clusters using epifluorescence microscopy at high temporal resolution indicated a rapid recovery of ParB fluorescence intensity at the onset of DNA replication in contrast to the model prediction. These results suggest that the ‘Clamping & sliding’ model can only partly account for the assembly mechanism. We thus propose that a ‘Clamping & sliding’ mechanism might explain the ParB spreading pattern only at short distances from parS but that another mechanism must apply for ParB binding at long distance.
Results
The DNA is modeled as a circular filament of length L displaying N discrete sites of 16-bp (footprint of a ParB dimer; Bouet and Lane, 2009). ParB dimers (i) bind specifically to parS, (ii) switch conformation and bind CTP, (iii) convert to protein clamps, (iv) release parS, (v) freely diffuse on DNA, and (vi) unbind DNA by opening the clamp (Fig. 1B). Therefore, ParB can only enter the filament by a unique loading gate, parS, at the binding rate B (Fig. 1B). It is released from parS at the rate R, and it can diffuse unidimensionally on the DNA, with a diffusion coefficient D, but cannot cross parS, which is always assumed to be occupied by ParB. Lastly, ParB clamps exit anywhere from the circular DNA filament by opening the clamp at the unbinding rate U. We thus modeled the ‘Clamping & sliding’ mechanism by a typical reaction-diffusion model. Notably, in contrast to all other models at thermodynamic equilibrium previously proposed (see above), this steady-state sliding mechanism is out-of-equilibrium. Indeed, the binding and subsequent release of ParB at parS only creates an oriented gradient of proteins leading to a stationary, oriented flux of ParBs. Thus, the system is brought out-of-equilibrium due to these particular boundary conditions. Note that in the framework of the ‘Clamping & sliding’ model, ParB non-specific DNA binding activity is not relevant due to the high concentration of competitor DNA represented by the nucleoid.
In the cells, ParB dimers can be found in two states: (i) assembled in clusters around parS, which represents over 90% of ParB present in the cell and (ii) freely diffusing over the nucleoid corresponding to the remaining ParB population, which acts as a reservoir for the clusters (Guilhas et al., 2020; Sanchez et al., 2015). These two populations may represent the sliding clamps and the free ParBs, respectively. Therefore, in the stationary regime, the flux balance of ParB in the partition complex is Jin = Jout , with the current of incoming particles Jin = R, and outgoing particles
Jout = NaU, where Na is the number of particles clamped to DNA. This leads to the conservation
of the average number Na of clamped-ParB, imposed by the two rates, R and U:
Na= R/U. (1)
The time-dependent density 𝜌(𝑥, 𝑡) of ParB can be described by the following equation:
𝜕𝜌(𝑥,𝑡)
𝜕𝑡 = 𝐷𝛥𝜌(𝑥, 𝑡) + 𝑅𝛿(𝑥) − 𝜌(𝑥, 𝑡)𝑈. (2)
The stationary solution for a coarse grained number density, n(x)=𝜌(𝑥)𝛿𝑥, is readily obtained from the steady-state solution of Eq.(2) as:
𝑛(𝑥) = 𝜁𝑒−𝑥/µ 𝛿𝑥 (3)
where δx = 16-bp corresponds to one footprint of ParB, 𝜇=√𝐷/𝑈 is the characteristic length scale (in bp) of the decay corresponding to the typical distance performed by ParB by diffusion before detachment, and 𝜁𝛿𝑥 = 𝑅/(2√𝐷𝑈) 𝛿𝑥 is the overall amplitude of the density decay, which linearly
increases with the release rate R. In the next section, we applied this formalism using biologically determined parameter values.
Simulation of the “Clamping & sliding’ model using biological parameters for ParB.
Our physical modeling for the ‘Clamping & sliding’ mechanism contains four kinetic parameters (see Fig. 1B). We estimated these parameters as follows: (i) We considered that parS is always occupied by a ParB dimer. Indeed, the ParB binding to parS depends on the population of ParB that is free to diffuse over the nucleoid. The freely diffusing ParB concentration was estimated at ~0.14 µM and ~0.48 µM for ParB from plasmid F (ParBF) and from the chromosome of C. crescentus (ParBCcre) (see Table S1; Bouet et al., 2005; Lim et al., 2014), well above the KD for
ParBF-parSF interaction (~2 nM; Ah-Seng et al., 2009) and chromosomal ParB-parS (~20-50 nM;
Fisher et al., 2017). In addition, the ParBF binding rate, BF, with an apparent association constant Kon ~2 ×10⁵ mol-1 s-1 (Ah-Seng et al., 2009) is several orders of magnitude higher than the other
rates used in the model (see below). The ParB-parS binding step is therefore not limiting; (ii) the apparent diffusion coefficient of ParBF clustered around parSF, DF ~ 0.05 µm2 s-1 (or ~ 4.3×10⁵
bp2 s-1)as measured by super-resolution microscopy (Guilhas et al., 2020); (iii) the release of ParB from parS, RCcre ~ 0.1 s-1 (Fig. S1A-B); and (iv) the unbinding of the ParB clamp from non-specific
DNA UCcre ~ 0.017 s-1 (Fig. S1A,C). These two latter parameters were obtained from the in vitro
biochemical experiments, performed with ParBCcre in the presence of CTP (Fig. 2A in Jalal et al.,
2020), by calculating the kinetic rates using nonlinear regression fits (see Fig. S1 and Methods). Eq.(2) contains only the three kinetic parameters D, R and U. We accounted for the assumption that the parS site is always occupied by a ParB with a constant source term, i.e. a delta-function
δ(x).
We introduced these parameter values in our physical model to estimate the number of attached particles, and we obtained, from Eq.(1), an average number of clamped ParB dimers per DNA molecule Na = R/U ~6. This value is much lower than the Na ~250 or ~200 (see Table S1)
observed experimentally for ParBF and ParBCcre, respectively (Adachi et al., 2006; Bouet et al.,
2005; Lim et al., 2014) indicating that the biological values for R and/or U cannot for the number of ParB per cluster. Despite this discrepancy, we further plotted, in Fig. 2A, the theoretical prediction for the profile given by Eq. (3) and, as a benchmark, the corresponding Monte Carlo simulations. These simulations consist of a discrete version of the ‘Clamping & sliding’ model applied on a DNA molecule of length L = 60-Kb, which corresponds to the actual size of the F plasmid used for the ChIP-sequencing data (see Methods), giving N = 3750 non-overlapping ParB sites. From Eq. (3), the exponential decay has a characteristic length µ ~5.1-Kb and an amplitude
𝜁 ~6×10⁻⁴ bp-1, leading to the coarse-grained amplitude 𝜁𝛿𝑥 ~10-2. As shown in Fig. 2A, analytic and numerical predictions are both in excellent agreement with each other but result in a very low density profile around parS, unable by far to describe the ChIP-seq profile (red symbols). Na, the
total number of ParB on DNA, corresponds to the integral of n(x). Thus, a low value of Na ~6
implies directly a low value of the overall amplitude of n(x) with the biological parameters from Fig. S1 compared to the ChIP-seq data. Also, the slopes of the decay are different: the ChIP-seq profile displays a slower decay, suggesting a larger characteristic length 𝜇 (discussed in the next paragraph). Since the parameters arise from in vitro assays performed on a small and constrained DNA molecule (Jalal et al., 2020), the value of UCcre may be overestimated compared to in vivo
conditions (see discussion).
Another approach is to fit directly the U and R parameters, the DNA unbinding and parS release rates, respectively, from the in vivo ParB DNA binding profile. We estimated these two values (D remains the same) leading to the best fit to the seq profile. In Fig. 2B, the ChIP-seq data (red symbols) display an enrichment at parSF since these sites are saturated due to the
high value of the binding rate BF. The drop on both ends of parSF and the subsequent slower decay
can be interpreted in the framework of the ‘Clamping & sliding’ model described by Eq.(3). We fitted the right side of the ChIP-seq profile (in the range 0 < x < 11-Kb) because the decay is longer with no roadblock hindering ParB binding, compared to the left side. We used the functional form
n(x)= Ae-Bx and first fitted the parameter B = 1.04 (+/- 0.1)×10-4 bp-1, which is related to 𝜇 in Eq.(3) as 𝐵 = 1/𝜇 = √𝑈/𝐷. Assuming D = 4.3×10⁵ bp2 s-1, we obtained U = 4.7 (+/- 0.5) ×10-3s-1. This fitted value is ~4-times lower than the in vitro estimate from Fig. S1C. Also, note that the optimized value of µ ~9.6-Kb is ~2-times higher than the value estimated in the previous paragraph with the
in vitro parameters (Fig.2A). Second, we fitted A = 0.34 (+/- 0.1), which is related to 𝜁 in Eq.(3) as 𝐴 = 𝜁𝛿𝑥 = 𝑅/(2√𝐷𝑈) 𝛿𝑥. Assuming the previous values of D and U, this leads to R = 1.91 (+/- 0.05) s-1, a value ~20-times higher than the in vitro one. This theoretical prediction provides a symmetrical ParB DNA binding pattern with respect to parS (black diamonds, Fig. 2B), which also fits with the decrease observed experimentally on the left side of parSF up to ~3-Kb, beyond
which the RepE/IncC protein-DNA complexes interfere with ParBF binding (see below).
Using these optimized values, the number of particles Na clamped to DNA at the
steady-state is Na = R/U ~400, which is roughly compatible with the estimation of ~250 or ~200 in average
per cluster at parSfor ParBF or ParBCcre, respectively (Table S1). Also, these values are, to a first
approximation, within the biological range of ParB release time from parS 𝜏R ~1/R ~0.5 sec and
ParB unbinding time from the DNA 𝜏U ~1/U ~213 sec.
Modeling the ParB binding pattern in the presence of roadblock
The ParB binding pattern is strongly impaired by protein-DNA complexes acting as roadblocks which strongly reduce the ParB density on DNA beyond these sites as observed both in vivo and
in vitro (Breier and Grossman, 2007; Jalal et al., 2020; Rodionov et al., 1999; Sanchez et al., 2015).
effect of a protein-DNA complex present at ~3-Kb on the left side of parS which mimics the position of the RepE-IncC roadblock present on the plasmid F (Sanchez et al., 2015). This roadblock is modeled by a no-flux boundary condition, i.e. particles cannot cross the barrier. By using the fitted parameters adapted for the case without roadblock (see previous section), we obtained the curve presented in Fig. 2B (blue circles). The symmetry between the left and right sides is clearly broken with ParB particles accumulating between parS and the roadblock as shown by the formation of a plateau starting immediately after the parS site. The ParB that are released on the left side of parS diffuse on an isolated domain of DNA of ~3-Kb comprised between the two diffusion barriers constituted by parS and the roadblock. ParB dimers only detach from the DNA segment at the unbinding rate U. Given that ParB diffuses with a diffusion coefficient D = 4.3×10⁵ bp2 s-1, the size of the isolated domain is covered in a few seconds. In a first approximation, if we consider that ParB is uniformly released from DNA between parS and the roadblock, we conclude that R/(2U) ~200 ParB are homogeneously distributed over 3-Kb, giving a nearly saturated average density ~1. The modeling is thus in clear contrast with the observed data from ChIP-sequencing showing that (i) the ParB binding pattern is nearly symmetrical over 3-Kb on both sides of parSF and (ii) no plateau is observed between parS and the roadblock. This finding
may also argue for an unbinding rate higher than the model prediction.
We reasoned that the unbinding rate could be higher when encountering a roadblock. Indeed, we found that the ParB unbinding kinetics is best fit with a two phase exponential decay giving two unbinding rates (Fig. S1C-D). We used the lowest rate (Koff_slow = 0.017 s-1) in our initial
modeling since it may best correspond to the physiological condition on large parS DNA molecules. However, ParBs may reach saturation in front of a roadblock, as it occurs in vitro on the small DNA probe with fixed ends (see legend Fig. S1C), leading to an initial fast unbinding rate (Koff_fast = 0.086 s-1). We therefore tested the higher rate UCcre = 0.086 s-1 on the left side of
parS in front of the roadblock. With this value, 20-times higher than on the right side of parSF, the
pattern is not saturated but still displayed a plateau (Fig. S2). This contrasts with the ChIP-seq data, which clearly indicates that the ‘Clamping & Sliding’ mechanism is not able to account for a barrier to ParB clamp diffusion. Moreover, this data points out that sliding by free, unidimensional diffusion as a clamp would be highly dependent on any obstacle present along the DNA. These obstacles, mainly proteins stably bound to DNA, would strongly impair ParB sliding by reducing its diffusion away from parS. Notably, ChIP-seq data present ParB DNA binding patterns with dips and peaks, i.e. indicating numerous obstacles along the DNA (Fig. 2B, and e.g. Baek et al., 2014; Bohm et al., 2020; Breier and Grossman, 2007; Debaugny et al., 2018; Lagage et al., 2016). Such a pattern indicating a recovery of the ParB binding signal after strong dips could not be easily explained by the sliding clamp mechanism (see discussion).
Based on these observations, we thus conclude that the ‘Clamping & sliding’ model does not apply over a large range of genomic coordinates, and thus could not account fully for the assembly of the partition complex. In the following sections, we will only consider the value of the parameters R and U obtained in vitro from ParBCcre.
ParB clusters reassemble faster than predicted by 'Clamping & sliding'
A ‘Clamping & sliding’ based-mechanism is expected to have an important effect on the de novo assembly kinetics of ParB. In this model, the ParB dimers load sequentially from a unique source,
parS (Fig. 1B), thus their accumulation in clusters should increase progressively at the rate R up
to a stationary population average. ParB are considered in steady state within the clusters, as suggested by fluorescence microscopy and fluorescence recovery after photobleaching (FRAP) experiments (Debaugny et al., 2018; Guilhas et al., 2020), except when the centromere site is replicated. DNA replication is highly processive, with a rate of DNA unwinding and duplication of ~1-Kb per second (Kelman and O'Donnell, 1995). ParB clamped at and around parS should therefore be unloaded or dispersed very rapidly when DNA polymerase III holoenzyme crosses over the ParB binding zone. ParB binding to newly duplicated parS sites is fast but its release as a sliding clamp on either side is limited by the ParB release rate R ~ 0.1 s-1 (see note in Figure S1B). In the framework of the ‘Clamping & sliding’ model, it would take ~20-40 min to load an average stationary population of ~125-250 ParB after the passage of the replication fork. We argue that, at the onset of replication, such disassembly/reassembly of ParB should be visible in time-lapse epi-fluorescence microscopy.
To test this expectation, we recorded ParB clusters in an E. coli strain carrying a 11.1-Kb mini-F plasmid expressing the fully functional ParBF-mTq2 fusion protein (Diaz et al., 2015).
Images were taken every 5 sec for a period of 10 min and displayed as kymographs (Fig. 3A). Since the generation time in our growth condition is ~100 min, only a few cells would undergo mini-F replication during the recorded period. Note that mini-F replication occurs within 10 sec, and about once per cell cycle and per plasmid (present at ~two copies per chromosome; Frame and Bishop, 1971). In addition, subsequent DNA segregation, visible as ParBF foci splitting, occurs
within less than five min after replication (Onogi et al., 2002). In spite of these difficulties, we were able to observe three trajectories (labelled #1, 2 & 5; Fig. 3A) displaying ParB foci more than 5 min before their splitting (indicated by arrows). We observed that (i) the ParB fluorescence intensity is maximal just before the splitting event and lasts at this level between one to three minutes, (ii) the ParB signals do not decrease importantly over the time course recorded. Only a few frames display transiently low signals (indicated by black circles) that last less than two frames (10 sec). However, we could not exclude that these transient faint signals were due to out of focus variation of the ParB foci since such decreases were also observed independently of a splitting event as observed for trajectories #3 and #4 (indicated by white circles).
To gain quantitative insights, we measured and plotted the relative fluorescence intensity signal within ParB foci over time (Fig. 3B and Fig. S3). We found that it displayed two clear transitions between three stable states: (i) the fluorescence intensity from the ParB focus is maximal before the splitting event (S) and is then nearly equally divided between the two newly
formed foci; (ii) less than 5 min before the splitting event, the fluorescence intensity decreased abruptly (D) over 10-15 sec, followed by an increase (A) over a short period of time (20-50 sec). We propose that this decrease might correspond to the passage of the replication fork over parS removing ParB from the DNA, and that the immediate increase might correspond to the loading of ParB at parS for de novo assembly of the partition complexes. Note that, at this stage, a doubling of the ParB fluorescence intensity is not expected since most of ParBs were already present in foci before duplication (Lim et al., 2014; Sanchez et al., 2015). We found that the observed experimental loading time (<60 sec) is much shorter than the time predicted by the ‘Clamping & sliding’ model (~20-40 min; see above). Rather, it is of the same order of magnitude as the time needed for two foci to exchange their ParB (~90 sec; see Debaugny et al., 2018; Guilhas et al., 2020), confirming the fast dynamics of ParB within clusters. This result suggests that the disassembly of the partition complexes is carried out too rapidly to be explained by the ‘Clamping & sliding’ model.
Discussion
The understanding of the molecular mechanism responsible for the assembly of the bacterial partition complex has resisted three decades of biochemical and molecular studies performed on several ParABS systems from chromosomes and low-copy-number plasmids. How a few ParB molecules bound to parS sites cluster hundreds of other ParB in the vicinity of parS in a self-assembled high molecular weight structure that serves to position and actively segregate DNA molecules remains puzzling. The recent finding that ParB proteins belong to a new class of CTP-dependent molecular switches has opened new avenues of research to decipher this mechanism. In particular, ParB dimers switch from an opened conformation prone to DNA binding to a close conformation (clamp) upon parS and CTP binding that enable the release and sliding away from
parS as a protein clamp (Jalal et al., 2020; Soh et al., 2019). In this work, we propose a physical
model, namely ‘Clamping & sliding’, for this newly proposed CTP-based ParB clamping mechanism.
First, we considered that the parS binding site is always occupied by ParB as suggested by the high affinity constants in the ~1 to 50 nM range for all ParBs investigated (e.g. Ah-Seng et al., 2009; Funnell and Gagnier, 1993; Taylor et al., 2015). Therefore, clamped-ParBs must slide away from parS by free diffusion since (i) they could not cross back over this strong binding site and (ii) they are pushed away by the successive loading at parS.
Second, the ‘Clamping & sliding’ model contains three kinetic parameters (see Eq.(2)), which were inferred from biochemical, microscopy and ChIP-seq analyses. The apparent diffusion coefficient, D, was estimated from single molecule live imaging assays (Guilhas et al., 2020). ParBF displays two distinct diffusion modes depending on whether it belongs to a mobile or a
typically corresponds to the diffusion of non-specific DNA binding proteins (Garza de Leon et al., 2017; Stracy et al., 2016; Stracy and Kapanidis, 2017). In the fraction clustered around the parSF
site, D was estimated at ~ 0.05 µm2 s-1 (Guilhas et al., 2020). We used this latter estimate for DF
as it corresponds to the ParBF (~ 95%) present in the vicinity of ParSF while the former corresponds
to the ParBF that are freely diffusing over the nucleoid. Here, we only considered that ParB clamps
move unidimensionally and passively by free diffusion along DNA. Indeed, although the role of CTP hydrolysis is not known, it is unlikely that it could provide energy for translocation since (i) the hydrolysis rate is as low as ~40 CTP hydrolyzed per hour, and (ii) ParB still accumulates on DNA in the presence of a non-hydrolysable CTP analog (Jalal et al., 2020; Osorio-Valeriano et al., 2019; Soh et al., 2019).
The release rate of ParB from parS, R, is the limiting step for creating the flux of ParB clamps on parS-proximal DNA. It occurs at the same rate on both sides of parS as indicated by all the ChIP assays performed with numerous ParB belonging to plasmids and chromosomes (Baek et al., 2014; Breier and Grossman, 2007; Debaugny et al., 2018; Donczew et al., 2016; Lagage et al., 2016; Rodionov et al., 1999; Sanchez et al., 2015). The value estimated from the in vitro data (Fig. S1B and Jalal et al., 2020) is 20-times lower than the best fit from the in vivo ChIP-seq data using the ‘Clamping & sliding’ model (Fig. 2B). This difference may arise from the small linear and closed DNA fragment used in the in vitro assay (Jalal et al., 2020) compared to the ~60-kb circular DNA for the ChIP-seq. However, the release rate from the former is nicely fitted by a one phase association curve (Fig. S1B) indicating that it is not perturbed by steric hindrance when the DNA probe becomes saturated. This suggests that R remains constant from the initial loading stage after replication to the equilibrium state with one ParB clamp released every 20 sec on each side of parS. We cannot exclude that the release rate R is intrinsic to each ParB from different systems, and that there could be a slight difference between ParBF and ParBCcre.
The unloading rate of the clamped-ParB from DNA, UCcre, was estimated from the in vitro
unbinding curve (Jalal et al., 2020) which displays a two phase exponential decay (Fig. S1C). These two unbinding rates may be explained by the small size of the closed DNA probe since, at the beginning of the decay measurement, the DNA probe is saturated with one ParB every 16-bp (see note in Fig. S3) which might lead to an initial fast unbinding and to a slow one when the probe becomes unsaturated. We used the lower rate (~0.017 s-1) in the modeling (Fig. 2A) since in vivo
and in the absence of roadblocks, ParB diffuses rapidly on large DNA molecules, plasmids or chromosomes. However, to better fit the ChIP-seq data, the unbinding rate has to be set four-times lower (Fig. 2B). This optimized value corresponds to ParB clamps opening after ~3.6 min on average. It was previously shown that ParBs are highly dynamic with a residence time inside the clusters of ~100 sec, i.e. an exchange rate of 0.01 s-1 (Debaugny et al., 2018; Guilhas et al., 2020), a value in favor of the in vitro estimate (Fig. S1C and Jalal et al., 2020).
Although the values for these three parameters sound biologically relevant, it is important to note that our modeling is performed on ideal DNA, i.e. on a naked DNA without any protein
bound to it. The ParB clamp harbors a central hole enabling the DNA molecule to pass through but not protein-DNA complexes (Soh et al., 2019). The unidimensional diffusion on a filament is a physical process that is completely interrupted by roadblocks such as any protein bound stably to the DNA. The ‘Clamping & sliding’ model predicts that ParB clamps would accumulate rapidly between a roadblock and parS leading to a plateau, saturated or not, depending on the value, high or low, of the unbinding rate used (Fig. S2). Strikingly, this result is in stark contrast with the nearly symmetrical decreasing pattern observed on both sides of parS up to the roadblock (Fig. 2B). On bacterial genomes, with an average density of one gene every Kb and with numerous transcriptional regulators bound to promoter regions (Browning and Busby, 2004), the probability of having obstacles with finite residency times over the > 15-Kb of ParB binding pattern around
parS is very high. However, we expect these obstacles to modify only weakly and locally the
average expected binding profile, so we neglected them in the simulations to focus on the main physical aspects. Therefore, it is very unlikely that numerous ParB could cover a large genomic distance by free diffusion without being halted many times before unloading from DNA. With a ‘Clamping & sliding’ scenario, a higher density of ParB close to parS with an important decrease at each locus bound by a protein is rather expected, but never observed in ChIP-seq data (e.g. Baek et al., 2014; Breier and Grossman, 2007; Debaugny et al., 2018; Donczew et al., 2016; Lagage et al., 2016; Sanchez et al., 2015). Also, dips in the ParB DNA binding pattern corresponding to promoter regions with transcriptional regulator binding sites have been previously described both on plasmids and chromosome DNA (Debaugny et al., 2018). Notably, a strong dip in the ParB binding pattern was observed ~1-Kb on the right side of parSF inserted on the E. coli chromosome,
corresponding to the presence of a promoter in reverse orientation relative to ParB diffusion. This suggests that transcription prevents the diffusion of ParB clamps. However, after this important decrease in intensity, the ParB DNA binding signal fully recovered. Such a behavior with dips and peaks is incompatible with a sole sliding mechanism over large genomic distances.
Partition complexes are in a stationary state most of the time involving > 90% of ParB, but not at the onset of parS replication. By fast time-lapse microscopy of fluorescently-tagged ParB, we were able to observe some splitting events corresponding to the plasmid segregation step, and to detect variations of fluorescent intensity that might correspond to the replication of parSF: a
rapid drop in the foci intensity followed by its progressive increase to a higher level than the initial one. This temporal pattern might account for the fast disassembly of partition complexes followed by their progressive reassembly, respectively (Fig. 3B). From our measurements, it takes between 20 and 50 sec to reassemble partition complexes (Fig. 3B and S3). The rate obtained from the in
vitro data with only one ParB release every 10 sec (RCcre ~ 0.1 s-1; Fig. S1B and Jalal et al., 2020)
would be much too slow to account for the reassembly with only 2 to 5 ParB loaded in this period of time (requiring 40 min to load 250 ParB).
A fundamental difference between the ‘Clamping & sliding’ model and previous ParB assembly models is the oriented flux of ParB, making the system out-of-equilibrium. Indeed, these previous models explain the formation of ParBS assembly in the framework of thermodynamic
equilibrium: ‘1D-spreading’, ‘Spreading & bridging’ in the strong coupling limit, ‘Looping & clustering’ and ‘Nucleation & caging’ (Broedersz et al., 2014; Debaugny et al., 2018; Sanchez et al., 2015; Walter et al., 2018). This notable difference comes from the fact that, in the 'Clamping & sliding' model, ParB can only be loaded at parS, giving rise to a flux of ParB from parS to genomic regions away from parS. This leads to a severe limitation for this model: ParB would have to cover long genomic distances by unidimensional diffusion to account for the coverage observed in ChIP-seq experiments. On the contrary, models at thermodynamic equilibrium are based on the exchange of ParB with the cytoplasm (playing the role of a reservoir of ParB) at each genomic coordinate based on ParB-DNA and ParB-ParB interactions. Thus, in the case of equilibrium systems, the enrichment around parS is due to favorable energetic interactions (thus increasing the probability of the corresponding microstates) and not to the oriented gradient of ParB from to the unique source as in the ‘Clamping & sliding’ model. These DNA and ParB-ParB stochastic interactions (Fisher et al., 2017; Sanchez et al., 2015) could give rise to droplet formation (via phase transition), which is a mechanism known to quickly create a high concentration region at a targeted cellular location without requiring a membrane (Hyman et al., 2014), and which has been recently proposed to occur for partition complex assembly (Guilhas et al., 2020).
In summary, the ‘Clamping & sliding’ model is unable to describe the overall ParB DNA binding pattern with previously experimentally determined parameters and only inadequately with best fitted parameters. Moreover, it does not to account for several main aspects of this assembly: (i) the rapid turnover of ParB between clusters, (ii) the absence of accumulation of ParB in front of a roadblock, and (iii) the recovery of the ParB binding after strong dips in the profile. Also, the presence of numerous proteins bound along the DNA would prevent ParB clamps from diffusing rapidly to large genomic distances from parS centromere sites. For these reasons, the ‘Clamping & sliding’ model alone is not a plausible physical mechanism for fully explaining the partition complex assembly mechanism. We rather propose the possibility that a combination of two mechanisms is at play for the assembly of higher-order nucleoprotein ParBS complexes: one occurring at short distance), namely ‘Clamping & sliding’, and one at long distance. We speculate that the distance covered by diffusing clamped-ParB is of the order of the distance between two genes, i.e. ~1-Kb. Indeed, this distance corresponds to average transcription units that would induce barriers arising from both transcription factors and RNA polymerases for diffusing clamped-ParB. We therefore envision that ParB clamps only accumulate in the close vicinity of
parS sites. These ParBs have undergone a conformational change, occurring possibly (i) with the
transition between the parS-bound and the sliding clamp states (Soh et al., 2019) and/or (ii) with the stimulation of CTP hydrolysis switching ParB from the closed (CTP-bound) to the open conformation (apo/CDP-bound) (Osorio-Valeriano et al., 2019), that modify the N-terminal domain involved in ParB-ParB dimer interactions (Osorio-Valeriano et al., 2019; Surtees and Funnell, 1999) rendering these ParB prone to interact with other ParBs. The accumulation of these numerous proned-ParB would increase the number of nucleation points that can further recruit most of the intracellular ParBs into a highly concentrated cluster with a phase transition-like
mechanism (Guilhas et al., 2020). The ‘Nucleation & caging’ model remains attractive to explain the ParB-ParB interactions occurring at long-distance (> ~1-Kb) as it currently best describes the ParB DNA binding pattern (Debaugny et al., 2018; Sanchez et al., 2015). Such a combination of two modes of actions, ‘Clamping & sliding’ and ‘Nucleation & caging’ is also compatible with the recent study that reveals the droplet-like behavior of the ParB assemblies (Guilhas et al., 2020). Further experimental and modeling work is needed to provide new insights into this crucial higher-order nucleoprotein complex that drives the segregation of the bacterial DNA.
Limitations of the study
Our modeling approach is based on general principles, and although it was applied only to the F-plasmid ParB, we believe that the conclusion of our study could be generalized to other ParB proteins.
Resource Availability
Lead Contact
Further information and requests for resources and reagents should be directed to and will be fulfilled by the Lead Contact, Jean-Yves Bouet (jean-yves.bouet@univ-tlse3.fr).
Materials Availability
This study did not generate new unique reagents.
Data and code Availability
Unpublished custom code is available upon request from the Corresponding Authors. The accession number for the raw ChIP-seq data reported in this paper is GEO: GSE67869.
Methods
All Methods can be found in the accompanying Transparent Methods supplemental file.
Supplemental information
Acknowledgements
We thank all members of the GeDy team for fruitful discussions, and P. Rousseau, B. Ton-Hoang M. Campos and F. Cornet for critical reading of the manuscript. This work was supported by Agence Nationale pour la Recherche (ANR-14-CE09-0025-01), CNRS 80Prime
(Numacoiled) grant, CNRS “Modélisation pour le Vivant" Grant (CoilChrom), and by the LabEx NUMEV (ANR 2011-LABX-076) within the I-SITE MUSE.
Author Contributions
Conceptualization, J.-C.W. and J.-Y.B.; Methodology, J.-C.W. and J.-Y.B.; Software, J.-C.W.; Validation, J.R., C.W. and Y.B.; Formal analysis, N.-O.W., J.P., J.D., F.G., Y.B. and C.W.; Investigation, J.R., C.W. and Y.B.; Resources, Y.B.; Writing – original draft, J.-C.W. and J.-Y.B.; Writing – Review & Editing, J.P., A.P., N.-O.W., J.-J.-C.W. and J.-Y.B.; Visualization, C.W. and Y.B.; Supervision, C.W. and Y.B.; Project administration, J.-C.W. and J.-Y.B.; Funding Acquisition, J.-J.-C.W. and J.-Y.B.
Declaration of interest
The authors declare no competing interests.
References
Adachi, S., Hori, K., and Hiraga, S. (2006). Subcellular positioning of F plasmid mediated by dynamic localization of SopA and SopB. J Mol Biol 356, 850-863.
Ah-Seng, Y., Lopez, F., Pasta, F., Lane, D., and Bouet, J.Y. (2009). Dual role of DNA in regulating ATP hydrolysis by the SopA partition protein. J Biol Chem 284, 30067-30075. Baek, J.H., Rajagopala, S.V., and Chattoraj, D.K. (2014). Chromosome segregation proteins of Vibrio cholerae as transcription regulators. MBio 5, e01061-01014.
Bohm, K., Giacomelli, G., Schmidt, A., Imhof, A., Koszul, R., Marbouty, M., and Bramkamp, M. (2020). Chromosome organization by a conserved condensin-ParB system in the
actinobacterium Corynebacterium glutamicum. Nature communications 11, 1485.
Bouet, J.Y., and Funnell, B.E. (2019). Plasmid Localization and Partition in Enterobacteriaceae. EcoSal Plus 8.
Bouet, J.Y., and Lane, D. (2009). Molecular basis of the supercoil deficit induced by the mini-F plasmid partition complex. J Biol Chem 284, 165-173.
Bouet, J.Y., Rech, J., Egloff, S., Biek, D.P., and Lane, D. (2005). Probing plasmid partition with centromere-based incompatibility. Mol Microbiol 55, 511-525.
Bouet, J.Y., Stouf, M., Lebailly, E., and Cornet, F. (2014). Mechanisms for chromosome segregation. Curr Opin Microbiol 22C, 60-65.
Breier, A.M., and Grossman, A.D. (2007). Whole-genome analysis of the chromosome
partitioning and sporulation protein Spo0J (ParB) reveals spreading and origin-distal sites on the Bacillus subtilis chromosome. Mol Microbiol 64, 703-718.
Broedersz, C.P., Wang, X., Meir, Y., Loparo, J.J., Rudner, D.Z., and Wingreen, N.S. (2014). Condensation and localization of the partitioning protein ParB on the bacterial chromosome. Proc Natl Acad Sci U S A 111, 8809-8814.
Browning, D.F., and Busby, S.J. (2004). The regulation of bacterial transcription initiation. Nat Rev Microbiol 2, 57-65.
Debaugny, R.E., Sanchez, A., Rech, J., Labourdette, D., Dorignac, J., Geniet, F., Palmeri, J., Parmeggiani, A., Boudsocq, F., Anton Leberre, V., et al. (2018). A conserved mechanism drives partition complex assembly on bacterial chromosomes and plasmids. Mol Syst Biol 14, e8516. Diaz, R., Rech, J., and Bouet, J.Y. (2015). Imaging centromere-based incompatibilities: Insights into the mechanism of incompatibility mediated by low-copy number plasmids. Plasmid 80, 54-62.
Donczew, M., Mackiewicz, P., Wrobel, A., Flardh, K., Zakrzewska-Czerwinska, J., and
Jakimowicz, D. (2016). ParA and ParB coordinate chromosome segregation with cell elongation and division during Streptomyces sporulation. Open biology 6.
Erdmann, N., Petroff, T., and Funnell, B.E. (1999). Intracellular localization of P1 ParB protein depends on ParA and parS. Proc Natl Acad Sci USA 96, 14905-14910.
Fisher, G.L., Pastrana, C.L., Higman, V.A., Koh, A., Taylor, J.A., Butterer, A., Craggs, T., Sobott, F., Murray, H., Crump, M.P., et al. (2017). The structural basis for dynamic DNA binding and bridging interactions which condense the bacterial centromere. eLife 6.
Frame, R., and Bishop, J.O. (1971). The number of sex factors per chromosome in Escherichia
coli. J Biochem 121, 93-103.
Funnell, B.E. (2016). ParB Partition Proteins: Complex Formation and Spreading at Bacterial and Plasmid Centromeres. Frontiers in molecular biosciences 3, 44.
Funnell, B.E., and Gagnier, L. (1993). The P1 plasmid partition complex at parS: II. Analysis of ParB protein binding activity and specificity. J Biol Chem 268, 3616-3624.
Garza de Leon, F., Sellars, L., Stracy, M., Busby, S.J.W., and Kapanidis, A.N. (2017). Tracking Low-Copy Transcription Factors in Living Bacteria: The Case of the lac Repressor. Biophys J
112, 1316-1327.
Guilhas, B., Walter, J.C., Rech, J., David, G., Walliser, N.O., Palmeri, J., Mathieu-Demaziere, C., Parmeggiani, A., Bouet, J.Y., Le Gall, A., et al. (2020). ATP-Driven Separation of Liquid Phase Condensates in Bacteria. Mol Cell 79, 293-303 e294.
Hyman, A.A., Weber, C.A., and Julicher, F. (2014). Liquid-liquid phase separation in biology. Annual review of cell and developmental biology 30, 39-58.
Jalal, A.S., Tran, N.T., and Le, T.B. (2020). ParB spreading on DNA requires cytidine triphosphate in vitro. eLife 9, e53515.
Jalal, A.S.B., and Le, T.B.K. (2020). Bacterial chromosome segregation by the ParABS system. Open biology 10, 200097.
Kelman, Z., and O'Donnell, M. (1995). DNA polymerase III holoenzyme: structure and function of a chromosomal replicating machine. Annu Rev Biochem 64, 171-200.
Lagage, V., Boccard, F., and Vallet-Gely, I. (2016). Regional Control of Chromosome Segregation in Pseudomonas aeruginosa. PLoS genetics 12, e1006428.
Lim, H.C., Surovtsev, I.V., Beltran, B.G., Huang, F., Bewersdorf, J., and Jacobs-Wagner, C. (2014). Evidence for a DNA-relay mechanism in ParABS-mediated chromosome segregation. eLife 3, e02758.
Lynch, A.S., and Wang, J.C. (1995). SopB protein-meditated silencing of genes linked to the
sopC locus of Escherichia coli F plasmid. Proc Natl Acad Sci USA 92, 1896-1900.
Murray, H., Ferreira, H., and Errington, J. (2006). The bacterial chromosome segregation protein Spo0J spreads along DNA from parS nucleation sites. Mol Microbiol 61, 1352-1361.
Onogi, T., Miki, T., and Hiraga, S. (2002). Behavior of sister copies of mini-F plasmid after synchronized plasmid replication in Escherichia coli cells. J Bacteriol 184, 3142-3145. Osorio-Valeriano, M., Altegoer, F., Steinchen, W., Urban, S., Liu, Y., Bange, G., and
Thanbichler, M. (2019). ParB-type DNA Segregation Proteins Are CTP-Dependent Molecular Switches. Cell 179, 1512-1524 e1515.
Rodionov, O., Lobocka, M., and Yarmolinsky, M. (1999). Silencing of genes flanking the P1 plasmid centromere. Science 283, 546-549.
Sanchez, A., Cattoni, D.I., Walter, J.C., Rech, J., Parmeggiani, A., Nollmann, M., and Bouet, J.Y. (2015). Stochastic Self-Assembly of ParB Proteins Builds the Bacterial DNA Segregation Apparatus. Cell Syst 1, 163-173.
Sanchez, A., Rech, J., Gasc, C., and Bouet, J.Y. (2013). Insight into centromere-binding properties of ParB proteins: a secondary binding motif is essential for bacterial genome maintenance. Nucleic Acids Res 41, 3094-3103.
Soh, Y.M., Davidson, I.F., Zamuner, S., Basquin, J., Bock, F.P., Taschner, M., Veening, J.W., De Los Rios, P., Peters, J.M., and Gruber, S. (2019). Self-organization of parS centromeres by the ParB CTP hydrolase. Science 366, 1129-1133.
Stracy, M., Jaciuk, M., Uphoff, S., Kapanidis, A.N., Nowotny, M., Sherratt, D.J., and Zawadzki, P. (2016). Single-molecule imaging of UvrA and UvrB recruitment to DNA lesions in living Escherichia coli. Nature communications 7, 12568.
Stracy, M., and Kapanidis, A.N. (2017). Single-molecule and super-resolution imaging of transcription in living bacteria. Methods (San Diego, Calif 120, 103-114.
Surtees, J.A., and Funnell, B.E. (1999). P1 ParB domain structure includes two independent multimerization domains. J Bacteriol 181, 5898-5908.
Taylor, J.A., Pastrana, C.L., Butterer, A., Pernstich, C., Gwynn, E.J., Sobott, F., Moreno-Herrero, F., and Dillingham, M.S. (2015). Specific and non-specific interactions of ParB with DNA: implications for chromosome segregation. Nucleic Acids Res 43, 719-731.
Walter, J.-C., Lepage, T., Dorignac, G., Geniet, F., Parmeggiani, A., Palmeri, J., Bouet, J.-Y., and Junier, I. (2020). Models of supercoiled DNA interacting with an anchored cluster of
proteins: towards a quantitative estimation of chromosomal DNA supercoiling. arXiv:200200111. Walter, J.C., Walliser, N.O., David, G., Dorignac, J., Geniet, F., Palmeri, J., Parmeggiani, A., Wingreen, N.S., and Broedersz, C.P. (2018). Looping and clustering model for the organization of protein-DNA complexes on the bacterial genome. New J Phys 20, 035002.
Figures legends
Figure 1: Schematic cycle for ParB clamping and sliding by diffusion along DNA.
A- Open and closed conformations mediated by CTP and parS DNA. ParB is a homodimer
composed of a C-terminal dimerization domain (orange) link to the central (light blue) and N-terminal (dark blue) domains by a flexible linker (red). The central domain contains the two DNA binding motifs for parS binding (Sanchez et al., 2013). The N-terminal part contains the ParA interaction domain, the arginine-like motif, the CTP binding motif and the multimerization domain (Ah-Seng et al., 2009; Soh et al., 2019; Surtees and Funnell, 1999). In the presence of parS and CTP, ParB dimer forms a clamp around the DNA.
B- Schematic representation for the ‘Clamping & sliding’ model displaying the five key steps. The
open conformation of ParB dimer enables DNA binding. Upon specific binding to parS centromere (step B), ParB undergoes a conformational change promoting CTP binding which subsequently induces ParB to form a clamp around parS (step C). Clamping promotes its release from parS allowing the ParB clamp to slide away from parS by diffusion (step S), and to free the parS loading site for next round of loading. The parameters used in the physical modeling B, R, D and U correspond to the parS binding (B), ParB clamping (C) and release (R), free diffusion during sliding (S), and DNA unbinding (U) steps, respectively. Note that (i) R is the total release rate from
parS which is, to a first approximation, equal on both sides of parS (not represented on the
schematic representation for simplicity), therefore ParB clamps are loaded on each side at a rate
R/2, and (ii) the stage at which CTP hydrolysis occurs was not determined in the original clamping
models (Jalal et al., 2020; Soh et al., 2019).
Figure 2: Comparisons between the ‘Clamping & sliding’ model and the ParBF DNA binding
pattern. High-resolution ChIP-sequencing data from a previous study (Sanchez et al., 2015) display the average number of reads per 100-bp windows as a function of the genomic coordinates (red circles). Note that the signal at parSF (coordinate 0) is normalized to 1 by averaging the number of
reads over the 550-bp centromere locus.
A- The model from Eq.(2) contains the three kinetic parameters D = 4.3×10⁵ bp2 s-1 (Guilhas et al., 2020), R = 0.1 s-1 and U = 0.017 s-1 (Fig. S1B-D). The exact solution (black line) and the Monte Carlo (MC; blue dots) simulation data are plotted on the right side of parSF. The theoretical
prediction is compared to the ChIP-seq data (Sanchez et al., 2015). The large discrepancy between the model and the ChIP-seq data is essentially due to the amplitude (value of R).
B- Simulation in the absence (black diamonds) and in the presence (blue circles) of a roadblock
compared to the Chip-seq data with the optimized parameters (R = 1.91 s-1 and U = 0.0047 s-1). The two strong roadblocks (green bars), present at ~3-kb and 4.5-kb on the left of parSF, are due
to the binding of RepE to incC and ori2 iterons, respectively (Rodionov et al., 1999; Sanchez et al., 2015). Note that the two MC simulations overlap on the right side of parSF.
See also Figure S2.
Figure 3: ParB foci do not disassemble for a long time before splitting events.
A- The trajectories of the ParBF-mTq2 foci, labelled 1 to 5, positioned over the nucleoid length,
were obtained by kymographs analyses. E. coli cells (i-iii), carrying a mini-F plasmid (pJYB249) with its endogenous ParABSF system, expressing a ParBF-mTq2 functional fusion protein, were
observed by time-lapse epi-fluorescence microscopy. Images were collected every 5 sec over 10 min and converted to kymograph (see Methods). The black arrows indicate the splitting events of ParB foci. Note that the ParB foci intensity increases strongly (black star) 1.5 to 3 minutes before the splitting events. Closed and open circles indicate low ParB fluorescence intensities in traces with or without splitting, respectively. The panel width corresponds to the length of the nucleoid.
B- Intensity of ParBF fluorescent foci before and after the splitting event. The integrated ParBF
-mTq2 fluorescence (thin line) from trajectory number 2 in panel A is measured every frame and plotted over time with color data points. The signal was subtracted from the average background level, and normalized to 1 from the average intensity before the drop in intensity (blue dots). Dots and triangles represent the intensity of one and two ParB foci before and after the splitting event (S), respectively. R and L represent the putative centromere replication and the ParB loading steps, respectively. The blue, brown, red and blue horizontal bars represent the mean values of the normalized ParB foci intensity of the one focus before R, before S and the 2 foci after S, respectively. The orange and green bars represent the linear regression of the variation in ParB fluorescent intensities. Note that replication (R) is inferred from the increase in foci intensity that (i) occurs between the 2 plateau of ParB fluorescence mean intensity and (ii) takes place less than 5 min before splitting (S).
CTP CTP/CDP
U
S
B
R
A
B
N-terminal C-terminal linkeropen
closed
DNA parS (loading site) sliding direction
U: unbinding S: sliding B: binding R: parS-release parS CTP central parS
C
C: clamping Figure1Exact solution
MC simulations
ChIP-seq data
genomic coordinates x (Kb)
ParB density
n
(x
)
0
5
10
15
-5
-10
-15
0
0.2
0.4
0.6
0.8
1
ChIP-seq data
MC w/o roadblock
MC with roadblock
A
B
0
5
10
15
10
-310
-210
-110
0genomic coordinates x (Kb)
ParB density
n
(x
)
Figure20,20 0,40 0,60 0,80 1,00 1,20 1,40 0 100 200 300 400 500 600 D S 100 0 200 300 400 500 Time (sec) 600 A
Relative
focus intensity
0.2 1.0 0.6 1.4 trajectory 2B
Time (min)
0 1 2 3 4 5 6 7 8 9 101
2
3
4
i
ii
A
5
iii
Figure3Figure S1: Kinetics of ParB loading and unbinding to a closed DNA in the presence of CTP.
Related to Figure 1B.
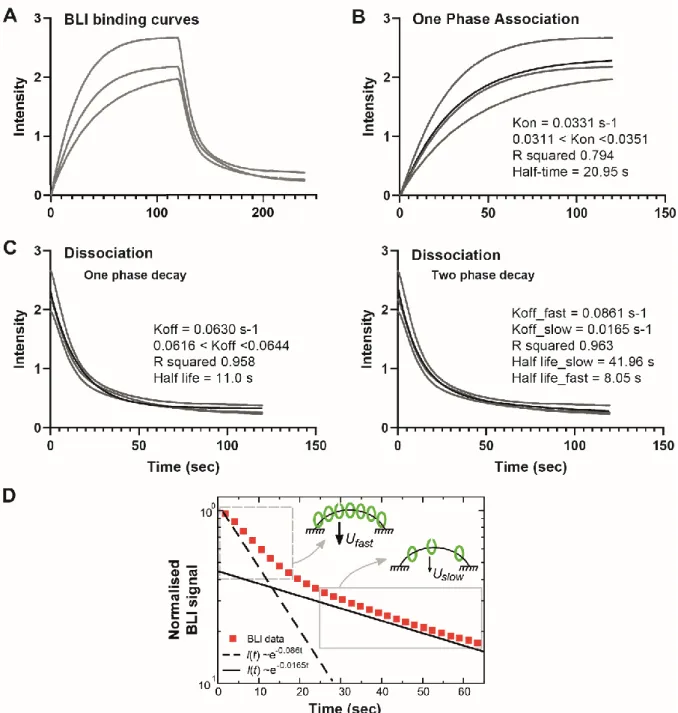
The BLI measurement of ParB-DNA interaction was monitored by the wavelength shifts during association or dissociation of ParB to a 169-bp double-stranded parS DNA (from Figure 2A in Jalal et al., 2020). The probe DNA is bound at both ends to the sensor surface (no free end). The reactions were measured with and without 1 µM of ParB (dimer) for 120 sec for association and dissociation phases, respectively. The three replicates of the published BLI data were plotted to display the variation in intensity versus time (second). Data points and fitted curves were represented by grey dots and thin black lines, respectively. The parameters computed using nonlinear regression tools (see Methods) were displayed on the right.
A- ParB association and dissociation with a closed DNA substrate. The closed DNA containing
one parS site was infused at time zero with ParBCcre for 120 sec and then washed out without
ParBCcre. Importantly, note that the classical analysis for protein-DNA binding kinetics could
not be applied since this model depends on the concentration of ligands. Here, ParBCcre clamps
are delivered from parS at a constant rate, i.e. independently of the ParB concentration (ParB concentration is above the KD for ParB-parS binding; Jalal et al., 2020). For this reason, we analyzed independently the association and dissociation phases (see panels B and C).
B- ParB release on non-specific DNA from parS analyzed by ‘One-phase association’ tool. The
plot is nicely fitted by an exponential giving a rate of A ~ 0.033 s-1. This rate A corresponds to the ParB release rate from parS (R) minus the unbinding rate of ParB from DNA (U). Therefore, from A = R - U, we calculated R = A + U ~ 0.12 s-1 with U ~ 0.086 s-1 (cf panels C-D). Note that this experiment, performed in a non-stationary phase starting from an empty DNA, is highly relevant to describe the partition complex recovery stage after DNA duplication upon replication forks passage through parS.
C- ParB unbinding from DNA. The unbinding curve was analyzed by ‘one phase’ (left) or ‘two
phase’ (right) ‘exponential decay’. The ‘one phase’ decay provides a Koff ~0.061 s-1. The ‘two
phase decay’ provides two dissociation constants: Koff_fast ~0.086 s-1 and Koff_slow ~0.017 s-1. We
used the Koff_fast for estimating the release rate R in panel B since it is performed on the very
short and closed DNA probe. However, we used the Koff_slow in our modeling since we propose
that it represents the physiological condition where the DNA does not harbor ends attached to a surface close to parS. The in vitro setup may favor a fast dissociation of ParB from DNA when saturation is reached, a situation that may also occur in vivo when ParB accumulates in front of a roadblock on DNA (see main text).
D- ParB unbinding from DNA is described by a ‘two phase’ exponential decay. The signal
intensity is normalized to 1 at time 0 and plotted as a function of time in a log-lin scale to discriminate between ‘one phase’ or ‘two phase’ decay. Only one replica of the BLI data (red squares) is displayed for clarity. Theoretical curves for exponential decays (~e-Koff) were plotted with Koff = 0.086 s-1 (dotted line) and 0.0165 s-1 (black line). This representation clearly
indicates that only a ‘two phase’ exponential decay could fit the ParB unbinding curve. The grey rectangles with dotted and full lines correspond to the data for the fast and slow exponential decays, respectively, and may describe the initial (Ufast) and steady state (Uslow) ParB unbinding
rates (black arrows), as represented by the corresponding schematic representations (indicated by the grey arrows). Schema represents the in vitro BLI setup with DNA attached at both ends to the surface (black lines). Closed and open green ovals represent ParB dimers in close (clamp) and open confirmations, respectively.
We used the Koff_fast for estimating the release rate R in panel B since it is performed on the very
short and closed DNA probe. However, we used the Koff_slow in our modeling since we propose
that it represents the physiological condition where the DNA does not harbor ends attached to a surface close to parS. The in vitro setup may favor a fast dissociation of ParB from DNA when saturation is reached, a situation that may also occur in vivo when ParB accumulates in front of a roadblock on DNA (see main text).
Note: We estimated that the 169-bp DNA could carry ~10 ParB at saturation since ParB dimers could bind every 16-bp without steric hindrance (Sanchez et al., 2015). This estimation is also compatible with the shift of the BLI signal at saturation, which is about 10-times higher than with a unique ParB bound to parS (measured in the absence of CTP; Jalal et al., 2020).
Figure S2: The ‘Sliding and clamping’ model does not describe the ParB binding pattern in the
presence of a roadblock. Related to Figure 2.
The ChIP-sequencing data (Sanchez et al., 2015) is represented as in Figure 2B by red circles. The two roadblocks at ~3-kb and 4.5-kb on the left of parSF are indicated by the green bars.
The MC simulations were performed with the indicated values of the unbinding rate U. For the higher unbinding rate, the MC simulation (green triangles) is only plotted on the left side of
Figure S3: Quantification of the fluorescence intensity of the ParB foci over time. Related to
Figure 3. The trajectories number 1 and 5 in Figure 3A were quantified and represented as in Figure 3B.
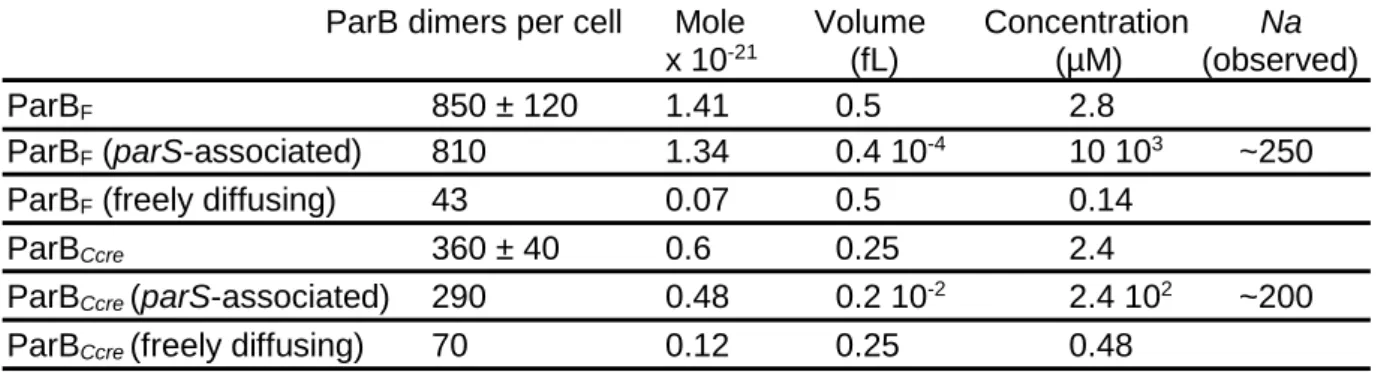
Table S1: ParB concentrations inside the cell for C. crescentus and the E. coli plasmid F. Related to Figures 1 and 2.
ParB dimers per cell Mole Volume Concentration Na
x 10-21 (fL) (µM) (observed)
ParBF 850 ± 120 1.41 0.5 2.8
ParBF (parS-associated) 810 1.34 0.4 10-4 10 103 ~250
ParBF (freely diffusing) 43 0.07 0.5 0.14
ParBCcre 360 ± 40 0.6 0.25 2.4
ParBCcre (parS-associated) 290 0.48 0.2 10-2 2.4 102 ~200
ParBCcre (freely diffusing) 70 0.12 0.25 0.48
ParB concentrations are estimated from previous studies that have determined the average intracellular number of ParBF (Adachi et al., 2006; Bouet et al., 2005 and ParBCcre (Lim et al.,
2014) per cell, the proportion of ParBF (Sanchez et al., 2015; Guilhas et al., 2020) and
ParBCcre (Lim et al., 2014) in ParB clusters, the number of ParB clusters for the plasmid F
(~3.2; Sanchez et al., 2015) and for C. crescentus (1 to 2; Lim et al., 2014), and the size (radius) of ParB clusters for the plasmid F (22 nm; Guilhas et al., 2020) and for C. crescentus (78 nm; Lim et al., 2014). The volume either corresponds to the volume of the nucleoid over which ParB molecules freely diffuse or to the volume of the ParB clusters for parS-associated ParBs. Na, the number of ParB clamped on the DNA in the framework of the 'Sliding & clamping model', corresponds to the parS-associated ParB divided by the number of cluster per cell.
Transparent Methods
Monte Carlo simulations
The simulations data presented in Fig. 2A-B are performed with a sequential Monte Carlo (MC) algorithm. The 60-Kb plasmid is modeled by a filament of N = 3750 sites, each of length δx = 16-bp corresponding to the footprint of a ParB protein. The MC time step is defined as a sweep of the N sites of the filament representing the plasmid. When a site is chosen during the MC sweep, different events can occur: if the site is occupied by ParB, this protein (i) can disappear from the lattice at a rate U or (ii) diffuses with a diffusion constant D; if the chosen site is neighbor to either side of parS, a ParB protein is injected at a rate R. We need to perform simulation on a sufficiently small time interval to prevent the appearance of numerical approximations (the analytic solution Eq.(3) are used as a benchmark for the simulations). We used an integration time δt corresponding to the time needed for ParB to diffuse over one site (i.e. a random step to the right or to the left), thus 𝛿𝑡 = 𝛿𝑥2/𝐷. The corresponding release rate R and unbinding rate U on the time interval δt become 𝑅𝛿𝑡 = 𝑅𝛿𝑥2/𝐷 and 𝑈𝛿𝑡 = 𝑈𝛿𝑥2/𝐷,
respectively. Thus, we need D Monte Carlo iterations to perform an evolution of the system during one second. It is important to remark that, in the absence of interactions between ParB proteins, several particles may be present on the same site. Thus, when a site is chosen, we update all particles on the site.
We define a no-flux boundary condition at parS, so that parS acts as a barrier for diffusion. Thus a particle is released with a probability one-half on either side of parS, i.e. the total release rate R becomes R/2 on each side (this is reflected in Eq.(3)).
In Fig. 2B, the roadblock is defined as an additional barrier located at 3-Kb from parSF
(left side); thus particles that are released on the left side of parSF have to evolve on an isolated
filament of ~3-Kb between the roadblock and parS. As the diffusion is fast (D = 4.3105 bp2 s-1) with respect to 3-Kb, a good approximation of the distribution is thus a plateau, whose height depends on 𝛿𝑥𝑅/(2𝑈 × 3𝐾𝑏). In order to prevent occupancy to become larger than one in the case of large density, we do not allow new particles to be released when the filament is completely covered (i.e. saturation).
The initial configuration of the system is empty. Before starting the sampling of the ParB density, we ensure that stationarity is reached. It is helpful to realize that the typical time needed to fill the system at the average stationary value of particles R/U corresponds to the release time 1/R times R/U, thus 1/U corresponds to the average time to fill the system (starting from an empty configuration). It corresponds also to the typical time to replace all the particles of the system in the stationary state, thus it corresponds to the correlation time. In Fig. 2A and 2B, we perform 10 x 1/U seconds of evolution before starting the sampling in order to ensure stationarity. Subsequently, the sampling was started and, to ensure decorrelation of the system between two samplings, samplings were spaced by a time 1/U. Averages were performed over 50.000 independent samplings in Fig. 2A and 2B.
We finally note that we can also solve the version of Eq.(2) with a discrete space formulation, i.e. the same framework as Monte Carlo simulations. The discrete solution is the same as Eq.(3) in the limit of 𝜇/𝛿𝑥 ≫ 1, i.e. when the characteristic length of the profile is much larger than the microscopic length δx of the system. This limit is satisfied for all the simulations of the paper (~few Kb and δx = 16-bp), namely in Fig. 2A where we observed the excellent agreement between both approaches.
The codes used for our simulations are available upon request. Release (R) and unbinding (U) parameters
The kinetic studies for ParB binding and unbinding in the presence of CTP, assayed by bio-layer interferometry (BLI), were performed elsewhere (Fig. 2A in Jalal et al., 2020). To