Completeness metrics and the quality of the sauropodomorph
fossil record through geological and historical time
Philip D. Mannion and Paul Upchurch
Abstract.—Despite increasing concerns about the effect of sampling biases on our reading of the fossil record, few studies have considered the completeness of the fossil remains themselves, and those that have tend to apply non-quantitative measures of preservation quality. Here we outline two new types of metric for quantifying the completeness of the fossil remains of taxa through time, using sauropodomorph dinosaurs as a case study. The ‘‘Skeletal Completeness Metric’’ divides the skeleton up into percentages based on the amount of bone for each region, whereas the ‘‘Character Completeness Metric’’ is based on the number of characters that can be scored for each skeletal element in phylogenetic analyses. For both metrics we calculated the completeness of the most complete individual and of the type specimen. We also calculated how well the taxon as a whole is known from its remains. We then plotted these results against both geological and historical time, and compared curves of the former with fluctuations in sauropodomorph diversity, sea level, and sedimentary rock outcrop area. Completeness through the Mesozoic shows a number of peaks and troughs; the Early Jurassic (Hettangian–Sinemurian) is the interval with highest completeness, whereas the mid-to-Late Cretaceous has completeness levels that are consistently lower than the rest of the Mesozoic. Completeness shows no relationship to rock outcrop area, but it is negatively correlated with sea level during the Jurassic–Early Cretaceous and correlated with diversity in the Cretaceous. Completeness of sauropodomorph type specimens has improved from 1830 to the present, supporting the conclusions of other recent studies. However, when this time interval is partitioned, we find no trend for an increase in completeness from the 1990s onward. Moreover, the 2000s represent one of the poorest decades in terms of average type specimen completeness. These results highlight the need for quantitative methods when assessing fossil record quality through geological time or when drawing conclusions about historical trends in the completeness of taxa. The new metrics may also prove useful as sampling proxies in diversity studies.
Philip D. Mannion and Paul Upchurch. Department of Earth Sciences, University College London, Gower Street, London WC1E 6BT, United Kingdom. E-mail: [email protected], [email protected]
Accepted: 9 September 2009
Introduction
Despite a substantial increase in the num-ber of studies investigating the quality of the fossil record with regard to putative sampling artifacts (e.g., Peters and Foote 2002; Up-church and Barrett 2005; Smith and McGowan 2007; Peters 2008; Barrett et al. 2009), very few have considered the quality of the specimens themselves, in terms of their completeness through either geological or historical time. A few previous studies have proposed rela-tively simple methods for quantifying speci-men completeness in order to address issues of fossil record quality (Fountaine et al. 2005; Smith 2007) and historical trends pertaining to taxonomy and nomenclature (Benton 2008a,b). These previous studies split preser-vation quality into four to six categories, with Benton (2008b), for example, using a complete-ness score ranging from 1 to 5, where 1 5
isolated teeth or bones, 2 5 one complete or near-complete skull, 3 5 several skulls, 4 5 one complete or near-complete skeleton, and 5 5 several skeletons. These studies demon-strate the interest in, and potential value of, measures of specimen completeness for taph-onomic, evolutionary, and historical stud-ies. However, each of these schemes is based on a relatively crude and arbitrary quality metric. The application of a different metric might substantially alter conclusions regard-ing fossil record quality or systematic prac-tice. Here we present two new completeness metrics that we believe provide increased resolution and objectivity when estimating the quality of specimen preservation. We apply these metrics to a comprehensive data set on sauropodomorph dinosaurs in order to explore how the quality of their fossil record has changed through geological time. We ’2010 The Paleontological Society. All rights reserved. 0094-8373/10/3602–0006/$1.00
then compare the completeness metrics with the sea-level curve of Haq et al. (1987) and with rock outcrop area (Smith and McGo-wan 2007) to test for correlations between these potential sources of sampling biases. Finally, we use our completeness metrics to test the recent claim that the quality of dinosaurian type material has improved from the nineteenth century to the present (Benton 2008a).
Materials and Methods Data
We collated a data set of all generically identifiable sauropodomorph material from the published literature, the Paleobiology Database (www.paleodb.org; Carrano 2008), and personal observations in museum collections. We consider 175 sauropodomorph taxa to be valid, represented by a total of 1345 individuals (see Supplementary Materials online at http:// dx.doi.org/10.1666/09008.s1). These 175 taxa were also used to produce a Mesozoic taxic diversity curve.
Completeness metrics must draw upon information about the association of skeletal elements at each locality, and some of our new metrics also require an estimate of the number of individuals represented. In this study we have adopted the conservative approach of calculating the minimum num-ber of individuals (Badgley 1986; Gilinsky and Bennington 1994) required by the ob-served elements (see Mannion and Upchurch 2010).
New Completeness Metrics
For this study, specimen completeness has been estimated by applying three variants of two different approaches, giving six complete-ness metrics in total. The first method (the ‘‘Skeletal Completeness Metric’’ [SCM]) is based upon dividing the skeleton up into different regions and then assigning percent-ages based on approximations as to how much of the skeleton is represented. Figure 1 and Table 1 show how we partitioned the skeleton and assigned percentages (see also Supplementary Materials). Within each body
region, individual elements are also
weighted: for example, a complete femur and a complete pes are each scored as 2% whereas a complete tibia is scored as 1%, reflecting the latter’s smaller size and fewer elements in comparison with the femur and pes respectively. Absence of an element would result in a score of zero, whereas a FIGURE1. Skeletal outline of Camarasaurus (modified from Wilson and Sereno 1998), showing the body regions used to
partition the skeleton (see Table 1 and Supplementary Materials for further details).
TABLE1. Percentages attributed to regions of the body based on the Skeletal Completeness (SCM) and Character Completeness (CCM) Methods. Percentages are rounded to the nearest whole percentage point. See text for details.
Skeletal region SCM CCM
Skull 10 33
Cervical vertebrae and ribs 15 7
Dorsal vertebrae and ribs 15 9
Sacral vertebrae and ribs 5 2
Caudal vertebrae and ribs 20 8
Pectoral girdle 5 3
Forelimbs 12 10
Pelvic girdle 6 8
Hindlimbs 12 18
tibia missing its distal half, for example, would be scored as 0.5%. Vertebral numbers vary across Sauropodomorpha (e.g., the number of cervical vertebrae varies from ten in the basal form Plateosaurus, to 12 in the macronarian Camarasaurus, 15–16 in diplodo-cids, and 17 in Euhelopus and mamenchisau-rids [Wilson 2002; Galton and Upchurch 2004; Upchurch et al. 2004a]), so to determine the completeness of the neck, for example, we first divided the 15% value (see Table 1) by the total number of vertebrae that should have been present in life and then multiplied it by the actual number preserved. Where a complete vertebral sequence is unknown for a taxon, this total number is inferred from comparisons with closely related taxa. Total percentages are always rounded to the nearest percentage point and the minimum level of completeness of an individual is 1% (i.e., an isolated phalanx still indicates the presence of an individual that should be registered by a completeness metric). Although these values are only approximations of the amount of skeleton represented, minor changes in the selected weightings should not have a marked effect on comparisons of overall completeness between specimens.
‘‘Skeletal Completeness Metric 1’’ (SCM1) is the completeness (expressed as a percent-age) of the most complete specimen known for that taxon. For example, Apatosaurus is known from dozens of skeletons (Upchurch et al. 2004b) but the most complete individual (CM [Carnegie Museum of Natural History] 3018) has an SCM1 score of 77%. SCM1 can be obtained for 88% of known sauropodomorph genera. The remaining 12% of taxa are more problematic because, despite a large amount of material, there are uncertainties regarding the associations of elements. For example, Barapasaurus, Bellusaurus, Thecodontosaurus, and Kotasaurus are known from bonebed accumulations where we can recognize the minimum number of individuals but cannot determine which elements belong to which individual (Upchurch et al. 2004a, and refer-ences therein). Similarly, Lapparentosaurus is described as consisting of five individuals from five locations, but information regarding particular associations is not available (Ogier
1975; Bonaparte 1986; Mannion 2010; Up-church personal observation 1992). Such taxa have been omitted from our SCM1 analyses (see Supplementary Materials for a list of taxa included in each analysis).
‘‘Skeletal Completeness Metric 2’’ (SCM2) quantifies how much of the skeleton is known for a given taxon as a whole; that is, it utilizes all known individuals of that taxon. For example, the Chinese taxon Euhelopus is known from two individuals that overlap, anatomically, in the middle trunk region (Wiman 1929; Wilson and Upchurch 2009). These two individuals (exemplars a and b) have SCM scores of 37% and 27% respec-tively. Under SCM1, Euhelopus therefore has a score of 37%, but under SCM2 the two specimens are considered together, giving a score of 57%. Similarly, there are no entirely complete skeletons of the well-known taxa Omeisaurus, Mamenchisaurus, and Diplodocus, but by using this second metric we can demonstrate that each of these is almost 100% complete in terms of osteological representation. SCM2 enables a more mean-ingful assessment of the completeness (of our anatomical knowledge) of taxa such as Lap-parentosaurus and Bellusaurus (see above). The only taxon for which an SCM2 score has not been calculated is Atlasaurus, because of a lack of information in the original description (Monbaron et al. 1999).
The second method, the ‘‘Character Com-pleteness Metric’’ (CCM), follows the same logic as SCM1 and 2, but the percentages assigned to different parts of the skeleton are calculated from their phylogenetic character richness. These weightings are based on calculating the average percentage of char-acters attributed to each region of the body in four sauropodomorph phylogenies (Wilson 2002; Upchurch et al. 2004a, 2007a; Yates 2007) (see Table 2 and Supplementary Mate-rials). Regions of the body have been sepa-rated in the same way as for the SCM (see Table 1), with an additional section to accom-modate characters that consider more than one region of the skeleton (for example, characters that relate to presacral vertebrae or to ratios between fore- and hindlimbs). Of particular note is the much higher percentage
attributed to the skull by the CCM than the SCM (33% versus 10%; see Table 1). As in the SCM, the CCM can be used to assign the percentage completeness contributed by an individual skeletal element, and it is imme-diately apparent that some elements have been considered more phylogenetically infor-mative than others in these four sauropodo-morph phylogenies. For example, a single, complete posterior dorsal vertebra can, on average, be scored for 7% of all characters, whereas a fibula can be scored for only 1%. The variants CCM1 and CCM2 are directly comparable to SCM1 and SCM2 respectively. Thus, CCM1 gives the phylogenetic complete-ness of the best-preserved individual belong-ing to a given taxon, whereas CCM2 gives the estimated phylogenetic completeness when anatomical knowledge is based on the sum of all individuals within that taxon.
To provide comparable analyses to those produced by Benton (2008a,b), we have calcu-lated the SCM and CCM scores of the type specimen of each sauropodomorph taxon (SCMtsand CCMts). In cases where an author has selected a particular element from an individual to stand as the holotypic specimen, we followed the practice of Benton (2008a,b); i.e., calculation of completeness metrics based on the entire individual, not just the holotypic specimen. Where an individual cannot be determined among the type material (e.g., within a disarticulated bonebed with more than one individual), this taxon has been omitted. In total, we have been able to include 89% of taxa in the SCMtsand CCMtsanalyses. All of these metrics are relative to the theoretical maximum for a complete skeleton;
i.e., the remains of all taxa could reach 100% completeness.
Averages versus Ratios.—Evaluating how the completeness of sauropodomorph specimens has fluctuated through geological or historical time requires an overall score for each time bin that summarizes the completeness scores gathered from individual taxa. One approach is to calculate the ratio of ‘‘good’’ to ‘‘poor’’ specimens per time bin (e.g., Benton 2008b). However, even if the criteria for assigning specimens to good and poor categories are clearly defined (e.g., a good specimen is one where the skull or skeleton is at least 50% complete [Benton 2008b]), the boundary between these two categories is still based on an arbitrary decision. The danger with ratios is that a decision to draw the boundary between ‘‘good’’ and ‘‘poor’’ in a different place (e.g., ‘‘good’’ equals at least 60% complete) may result in different conclusions. An alternative non-arbitrary approach is to calculate the average completeness score for each time bin, as in the following example for the Rhaetian Stage. Five sauropodomorph genera are known from the Rhaetian (Asylo-saurus, Camelotia, Isano(Asylo-saurus, Pantydraco, and Thecodontosaurus). Using SCM1, we know the completeness of the most complete specimen for all of these taxa except Thecodontosaurus. By summing the completeness of these four specimens (20%, 9%, 7%, and 45% respec-tively) and then dividing this value by the number of taxa (i.e., 4) we arrive at an average SCM1 score of 20.25% for the Rhaetian. By following the same procedure, but using SCM2 instead (which allows the inclusion of Thecodontosaurus), we arrive at an average TABLE2. Percentages attributed to regions of the body based on the Character Completeness Method for the four
sauropodomorph phylogenies used in this study. Average values are shown in Table 1 (CCM). See text for details. Skeletal region Wilson 2002 Upchurch et al. 2004a Upchurch et al. 2007a Yates 2007
Skull 32.47 30.75 33.57 33.71
Cervical vertebrae and ribs 5.98 7.77 5.14 7.37
Dorsal vertebrae and ribs 8.12 13.27 6.85 8.22
Sacral vertebrae and ribs 2.14 2.91 2.05 1.98
Caudal vertebrae and ribs 13.67 9.71 3.42 4.25
Pectoral girdle 3.85 4.53 2.40 1.98
Forelimbs 10.26 8.09 12.67 11.05
Pelvic girdle 5.13 6.15 10.96 9.63
Hindlimbs 16.24 15.53 19.86 20.96
SCM2 score for the Rhaetian of 28.8% (20% + 9% + 7% + 46% + 62%; divided by 5).
Both average and ratio completeness scores can create apparently anomalous results, and it is important to consider which aspects of fossil record quality these summary scores do and do not capture. For example, two time bins could have the same average or ratio score, and yet the total number of specimens and taxa found within each could be radically different. For example, time bin t1 could have a good-to-poor ratio of 1.0 because it has yielded one complete skeleton from genus A and one very fragmentary specimen of genus B. However, time bin t2 might have the same ratio of 1.0, but because it contains ten well-preserved genera and ten poorly well-preserved ones. Similarly, t1 and t2 could each have completeness scores of 40%. In the case of t1, this score reflects the presence of a single specimen of a single taxon that is 40% complete. In contrast, the same score occurs for t2 because we have multiple specimens for three taxa whose separate completeness scores are 100%, 15%, and 5%. In the case of average completeness scores, however, this problem can be addressed by providing information on the variation about the mean value. We therefore determine the standard error of the estimate of the mean for each averaged completeness score.
Average and ratio completeness scores do not capture information on the absolute num-bers of taxa or specimens known from each time bin; rather, they provide a proxy estima-tion of the probable level of completeness of a given specimen derived from that time bin. Thus, caution is required when interpreting the meaning of fluctuations in completeness scores through time. This issue is discussed further in the section dealing with completeness metrics as sampling proxies for diversity studies.
Statistical Tests.—We used three different statistical tests to assess the degree of correla-tion between each completeness curve for the various metrics (Hammer and Harper 2006). Spearman’s rank-correlation coefficient is a nonparametric method that compares the order of appearance of data points on two axes. Kendall’s tau rank-correlation coeffi-cient is another nonparametric method but
differs in that it assesses whether the curves from two data sets are in phase with each other. The third test, Pearson’s product-mo-ment correlation coefficient, is a parametric measure for quantifying the amount of linear correlation between two variables (Hammer and Harper 2006). It requires that the data be log-transformed prior to calculation. We have also used runs tests (which require a mini-mum of ten data points) to investigate the null hypothesis of total randomness and independence between data points for a time series (Davis 1986; Hammer and Harper 2006). Lastly, because we used multiple tests, we applied the Bonferroni correction to our pairwise comparisons, which lowers the sig-nificance value (Rice 1989; Waite 2000; Ham-mer and Harper 2006). This divides the usual p-value cutoff of 0.05 by the number of tests implemented. This correction was applied separately to the geological (Table 3) and historical (Table 5 and text) tests because they represent independent data sets. All statistical analyses were implemented using PAST (Hammer et al. 2001).
The Quality of the Sauropodomorph Fossil Record through Geological Time Analyses and Results
Average SCM1, SCM2, CCM1, and CCM2 scores have been calculated for each substage and then plotted against time (Fig. 2). Table 3 gives a full list of the statistical comparisons made between the curves of the different
completeness metrics through geological
time. One potential problem with our method of time binning is the variation in duration of stages. For example, the Aptian is 13 Myr TABLE3. Results of statistical analyses (Spearman’s
rank-correlation coefficient, Kendall’s tau rank-rank-correlation coefficient, and Pearson’s product-moment correlation coefficient) comparing geological completeness curves (SCM1-2 and CCM1-2) with one another. The p-values are ,1 3 1024for all tests.
Comparison Spearman’s Kendall’s Pearson’s SCM1 vs. SCM2 0.93970 0.79666 0.91247 SCM1 vs. CCM1 0.96391 0.85595 0.97366 SCM1 vs. CCM2 0.92016 0.75456 0.90778 SCM2 vs. CCM1 0.94299 0.80015 0.92115 SCM2 vs. CCM2 0.97559 0.88264 0.97743 CCM1 vs. CCM2 0.95988 0.83403 0.94859
whereas the Bathonian is only 3 Myr in duration. We might expect that longer stages have a better chance of including more-complete specimens and thus perhaps will have higher average scores of completeness. However, there is no correlation between substage duration and completeness (Spear-man’s rs,0.20; p . 0.14), suggesting that our choice of time bins is not creating artifactual peaks and troughs in longer and shorter substages respectively.
For the most part, all four metrics (SCM1-2 and CCM1-2) closely mirror one another through time (Table 3, p , 1 3 1024 for all
tests; Fig. 2) and runs tests demonstrate a statistically significant deviation from ran-domness (p , 2 3 1026).
Statistical comparison shows no correlation between diversity and completeness metrics for the Mesozoic (p . 0.48 for all tests). When we divide the Mesozoic into smaller time periods there are no statistically significant correlations for the Late Triassic, Jurassic, or Cretaceous, but there is a strong negative correlation between taxic diversity and com-pleteness in the Early Cretaceous (p , 0.01 for all tests) and a strong positive correlation in the Late Cretaceous (p , 0.006 for all tests except SCM1).
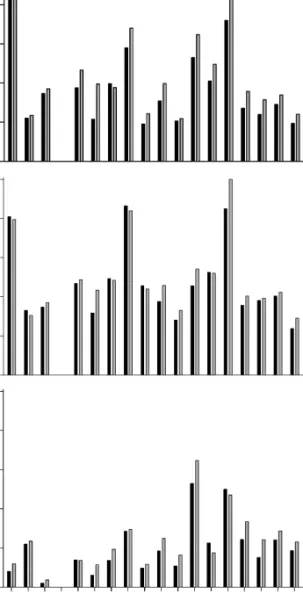
There is no correlation between any of the completeness metrics (SCM1-2 and CCM1-2) and the rock outcrop area data set of Smith and McGowan (2007); this is the case for both the terrestrial and marine element of their FIGURE2. Completeness of taxa through geological time, using both SCM (black lines) and CCM (gray lines). A, Most complete individual (SCM1 and CCM1). B, Percentage of taxon known (SCM2 and CCM2). The standard error of the estimate of the mean for each averaged completeness score is provided in the Supplementary Materials.
data set. There is a strong negative correlation (SC1: Spearman’s rs . 20.7001; Kendall’s tau . 20.5002; p , 0.001) between all four completeness metrics and the Mesozoic sea-level curve of Haq et al. (1987). However, when we divide the Mesozoic into smaller time intervals, we find exceptions to this overall pattern. For instance, when the Late Triassic, Cretaceous, or Late Cretaceous is analyzed individually, there is no correlation between completeness and sea level, whereas the Jurassic and Early Cretaceous retain the negative correlation.
Interpretation and Discussion
Fossil Record Quality.—Completeness levels are high in the early Carnian and remain relatively high during the late Carnian– Norian, but then decrease precipitously in the Rhaetian. This is followed by the highest peak in sauropodomorph completeness, in the Hettangian–Sinemurian. The presence of a Hettangian peak in completeness is surpris-ing given that the Early Jurassic is generally perceived as a time of poor fossil record quality, especially for sauropods (Bakker 1977; Upchurch and Barrett 2005), as a consequence of the relatively limited geo-graphic sampling of terrestrial sediments of this age (see Weishampel et al. 2004a). However, the high score can partly be attributed to the presence of many well-preserved prosauropod and basal sauropod skeletons from the upper Elliot and Clarens Formations of South Africa (e.g., Massospon-dylus) and lower Lufeng Formation of the People’s Republic of China (e.g., Lufengo-saurus and JingshanoLufengo-saurus) (Galton and Up-church 2004; UpUp-church et al. 2007a; Yates 2007). There is a steady decrease in complete-ness levels throughout the remainder of the Early-Middle Jurassic until a rise in the Bathonian (Fig. 2A,B) which culminates in an Oxfordian peak. The early Middle Jurassic low point matches a particularly poor part of the sauropod fossil record according to Upchurch and Barrett (2005), who noted that ghost ranges are high relative to observed lineages for this time interval. High levels of completeness in the Oxfordian (at least for SCM1-2 and CCM1-2) might seem anomalous
given the presence of only two sauropod taxa for this stage (Mamenchisaurus and Daano-saurus). However, Upchurch and Barrett (2005) noted that the ‘‘number of opportu-nities to observe’’ (based on using ‘‘dinosaur-bearing formations’’ [DBFs] as a proxy) was higher for this time period than for any other Jurassic stage, and suggested that the Oxfor-dian (despite a good rock record) may represent a genuine trough in sauropod diversity. Completeness remains high for the Late Jurassic before a large decrease at the Jurassic/Cretaceous (J/K) boundary; this is a particularly prominent drop for SCM1 and CCM1 (Fig. 2A) but is less marked for the other two metrics (Fig. 2B). Sauropods appar-ently underwent a dramatic decrease in observed taxic diversity (80%) and phyloge-netic lineage diversity (60%) at the J/K boundary (Upchurch and Barrett 2005; Barrett et al. 2009). Comparisons based on the number of Late Jurassic and Early Cretaceous DBFs suggest that this observed diversity decrease represents a genuine extinction (Upchurch and Barrett 2005). It could be argued that the apparent decrease in sauro-pod fossil record quality across the J/K boundary, based on our completeness metric scores, represents a contradictory signal that suggests that the diversity decrease is a sampling artifact. However, we contend that the use of completeness metrics as sampling proxies is a more complex issue than pre-viously recognized; this will be discussed in more detail later.
After the J/K boundary, completeness increases during the Valanginian–Hauteri-vian (with a prominent peak for SCM2 and CCM2, though this is much less notable for the other two metrics; Fig. 2), before declining in the Barremian; this decline is severe in the case of SCM2 and CCM2, with completeness halving in the former metric (Fig. 2B). SCM1 and CCM1 show a further decline in com-pleteness into the Aptian. This is interesting because Upchurch and Barrett (2005) noted that taxic diversity for sauropods peaks during the Aptian–Albian but phylogenetic diversity estimates decline gradually from the Hauterivian to the Cenomanian, paralleling our completeness scores. After a small
in-crease in the Cenomanian, completeness scores decrease again from the Turonian to Santonian. Indeed, early Late Cretaceous levels of completeness are consistently lower than at any other point during sauropodo-morph evolution. This is not surprising given that until fairly recently no diagnosable sauropod genera were known from the Turonian and Coniacian, because the few specimens that had been found were ex-tremely fragmentary (e.g., Huene 1929). This situation has changed through the discovery of new and better-preserved material, the re-dating of some formations in South America, and taxonomic revision (e.g., Leanza and Hugo 2001; Apesteguı´a 2007; Calvo et al. 2007), but it is interesting to note that these developments have not yet raised the quality of the early Late Cretaceous fossil record to levels comparable with the Jurassic or latest Cretaceous (probably because there have also been important discoveries from these other time periods). Although there are minor
differences between the various completeness metric scores, there is a moderate increase in fossil record quality for the Campanian and Maastrichtian. This matches a peak in sau-ropod diversity at this time, reflecting recent discoveries of many new titanosaurian genera from Madagascar, India, China, and South America (e.g., Curry Rogers and Forster 2001; Wilson and Upchurch 2003; Xu et al. 2006; Salgado and Carvalho 2008). Most of these taxa, however, are based on partial skeletons and often lack cranial material; thus the completeness scores remain lower than for the Early and Late Jurassic, from which many virtually complete taxa have been recovered. The generally lower levels of completeness in the Cretaceous are somewhat surprising, given that the number of DBFs is higher for this period than for the rest of the Mesozoic (Upchurch and Barrett 2005; but see below for further comments on the relative complete-ness scores for the Jurassic and Cretaceous). On the other hand, this trend of an Early TABLE4. Average completeness percentages for a selection of sauropodomorph clades and grades.
Group SCM1 SCM2 SCMts CCM1 CCM2 CCMts Non-Sauropoda 47.17 54.36 34.71 57.57 61.16 43.43 Non-Neosauropoda 35.25 43.00 27.11 42.25 47.30 33.13 Neosauropoda 20.40 28.90 15.14 25.49 32.32 19.47 Diplodocoidea 25.25 35.90 15.95 30.65 37.19 19.20 Macronaria 18.92 27.13 14.73 23.80 30.98 19.23 Non-Titanosauria 30.69 39.03 22.66 36.91 42.73 27.56 Titanosauria 17.52 24.42 14.12 22.62 29.09 19.31
TABLE 5. Results of statistical analyses (Spearman’s rank-correlation coefficient, Kendall’s tau rank-correlation coefficient, and Pearson’s product-moment correlation coefficient) comparing historical completeness curves with one another. The program PAST reports statistical comparisons only for values larger than 1 3 1024
; when the value is smaller than this it reports values only as ,1 3 1024.
Comparison Spearman’s Kendall’s Pearson’s
SCM1 vs. SCM2 0.82869 (p , 0.001) 0.69935 (p , 0.001) 0.96918 (p , 1 3 1024) SCM1 vs. SCMts 0.44892 (p 5 0.064) 0.33333 (p 5 0.061) 0.70192 (p 5 0.0095) SCM1 vs. CCM1 0.91538 (p , 0.001) 0.80392 (p , 0.001) 0.98902 (p , 1 3 1024) SCM1 vs. CCM2 0.85759 (p , 0.001) 0.72549 (p , 0.001) 0.96804 (p , 1 3 1024 ) SCM1 vs. CCMts 0.42002 (p 5 0.079) 0.32026 (p 5 0.066) 0.74117 (p 5 0.0129) SCM2 vs. SCMts 0.41796 (p 5 0.105) 0.26797 (p 5 0.155) 0.73224 (p 5 0.0046) SCM2 vs. CCM1 0.80186 (p , 0.001) 0.60784 (p , 0.001) 0.97229 (p , 1 3 1024) SCM2 vs. CCM2 0.91744 (p , 0.001) 0.79085 (p , 0.001) 0.99418 (p , 1 3 1024) SCM2 vs. CCMts 0.34985 (p 5 0.131) 0.25490 (p 5 0.144) 0.77117 (p 5 0.0126) SCMtsvs. CCM1 0.37049 (p 5 0.135) 0.29412 (p 5 0.094) 0.71992 (p 5 0.0070) SCMtsvs. CCM2 0.43034 (p 5 0.080) 0.32026 (p 5 0.068) 0.74173 (p 5 0.0035) SCMtsvs. CCMts 0.94014 (p , 0.001) 0.83007 (p , 0.001) 0.97567 (p , 1 3 1024) CCM1 vs. CCM2 0.93189 (p , 0.001) 0.79085 (p , 0.001) 0.98160 (p , 1 3 1024 ) CCM1 vs. CCMts 0.32508 (p 5 0.205) 0.25490 (p 5 0.157) 0.76518 (p 5 0.0087) CCM2 vs. CCMts 0.37688 (p 5 0.128) 0.28105 (p 5 0.109) 0.79082 (p 5 0.0076)
Jurassic peak in completeness, followed by a decline into the Early Cretaceous shows similarities to the pattern of increasing ‘‘gap-piness’’ found by Wills (2007) for a large range of taxa, which suggests that the Cretaceous sauropod fossil record is poorer than that of the Jurassic.
Completeness within Different Sauropodo-morph Groups.—Table 4 lists completeness scores for the six metrics for various saur-opodomorph groups. Saursaur-opodomorphs ly-ing outside of Sauropoda are, on average, considerably more complete than more de-rived forms, and non-neosauropod sauropo-domorphs also tend to be known from much more complete specimens than neosauro-pods. Within Neosauropoda, diplodocoids are known, on average, from slightly more complete material than macronarians; how-ever, both tend to be based on similarly complete type material. The average complete-ness of titanosaurs (derived macronarians) is slightly lower than for Macronaria as a whole, and non-titanosaurs are generally known from considerably more complete material than titanosaurs. This is interesting because the majority of titanosaurian taxa are Cretaceous in age, whereas most non-titano-saurs are from the Late Triassic and Jurassic. We might have expected the Cretaceous fossil record of sauropodomorphs to be higher in quality than that for the Triassic and Jurassic because, all things being equal, Cretaceous sediments have had less time to be destroyed by geological processes (the ‘‘Pull of the Recent’’ [Raup 1972]; but see Benton et al. [2000]). However, the relatively poorer fossil record of sauropodomorphs during the Cre-taceous, noted above, would inevitably have a disproportionate effect on the completeness scores for titanosaurs. This may explain why, despite intense taxonomic and phylogenetic work over the past two decades (e.g., Calvo and Salgado 1995; Upchurch 1995, 1998; Salgado et al. 1997; Wilson and Sereno 1998; Wilson 2002; Upchurch et al. 2004a; Curry Rogers 2005; Calvo et al. 2007), titanosaurs remain poorly understood in comparison to most other sauropodomorphs (Upchurch et al. 2004a; Curry Rogers 2005). Recent work (Mannion 2008; Mannion and Upchurch 2010)
has presented evidence that titanosaurs dis-played a preference for inland environments, whereas non-titanosaurs were more likely to inhabit coastal environments. This ecological difference may have decreased the probability of titanosaurian material being successfully fossilized, which may explain the lower completeness score for titanosaurs and the concomitant relative poverty of the Cretac-eous sauropodomorph fossil record, despite comparatively high numbers of DBFs.
Controls on Fossil Record Quality.—The above results suggest that sea level has, in some fashion, controlled the quality of the sauropodomorph fossil record, but only through part of the group’s evolutionary history, with high sea level correlated with low average completeness scores, and low sea level with high completeness scores in the Jurassic–Early Cretaceous. One possible inter-pretation is that periods of high sea level produced conditions that promoted low diversity and abundance among sauropodo-morphs. It is difficult to find convincing biological mechanisms to underpin this hy-pothesis, although Upchurch and Barrett (2005) noted that higher sea levels might fragment some terrestrial habitats and thus reduce diversity and/or abundance. A more probable, abiotic, explanation is that sea level affects the preservation potential of terrestrial organisms, although two conflicting mechan-isms have been proposed. Hunt et al. (1994) suggested that sauropod material was more likely to find its way into aquatic environ-ments during periods of higher sea level and therefore predicted that preservation rates should be highest at such times. Alterna-tively, Markwick (1998) has argued that the fossil record of terrestrial taxa will be poorer during times of high sea level, as a conse-quence of the greatly diminished availability of land area on which to preserve a terrestrial record. Our results support the latter view and contradict the prediction made by Hunt et al. (1994).
The lack of correlation between complete-ness and sea level in the Late Cretaceous is consistent with the dominance of titanosaurs during this time and the apparent preference of this group for inland habitats (Mannion
2008; Mannion and Upchurch 2010). We might expect the preservation potential of a terrestrial group that occupies habitats away from coastal lagoons, deltas, etc. to be less strongly affected by fluctuating sea levels.
A lack of correlation between completeness and outcrop area may mean that the two are unrelated; however, data on the latter are derived solely from the Western European rock record and as such may not be repre-sentative of the global record. Thus, it is possible that rock outcrop area also has an effect on completeness, but the outcrop data set may currently be inadequate for testing this hypothesis.
Historical Trends in Specimen Collection and Taxonomy
At least two factors lead to the prediction that SCM1, SCM2, CCM1, and CCM2 scores will tend to increase through historical time: 1. For each individual taxon (genera in this
study) the completeness score can only be increased by new discoveries, never de-creased. For example, given that the best-preserved individual of Apatosaurus is 77% complete, the discovery of an isolated femur belonging to this genus will not reduce this completeness score, but the discovery of an even more complete individual (e.g., 85% complete) would inevitably increase SCM1 and SCM2 and would probably result in increases in CCM1 and CCM2 (depending on the number of characters present on the newly available elements). Therefore, as sauropo-domorph material accumulates as a result of our collecting efforts, there should be a kind of ‘‘ratchet effect’’ that means that taxa either remain at a given level of completeness or improve, but never de-crease in completeness (except in rare cases where material is destroyed or new discoveries demonstrate that a previously named taxon known from multiple local-ities actually represents a chimera). 2. An awareness of the current state of the
sauropodomorph fossil record could influ-ence the collection of new material. Thus, during the early years of the study of
sauropodomorphs (i.e., from 1830 to 1870) virtually every specimen might have seemed worthy of collection, irrespective of its level of completeness, partly because most localities would be ‘‘new’’ in terms of their age or geographic position. In con-trast, field crews working today might deem isolated teeth and vertebrae as relatively unimportant, and instead focus their efforts on finding and collecting skulls and partial or complete skeletons. Of course, the decision whether or not to collect material will vary with the circum-stances: a field crew might collect every specimen from a locality, no matter how fragmentary, because of an interest in taphonomic or paleoecological parameters such as relative abundance. On the other hand, a team working in an already well-sampled portion of the sauropod fossil record (e.g., the Morrison Formation, U.S.A.) is likely to ignore very fragmentary specimens and focus on collecting more complete ones.
Analyses and Results
Specimen Quality through Historical Time.— In order to examine the above prediction, we have calculated SCM1, SCM2, CCM1, and CCM2 for sauropodomorph taxa for each of the ten-year time bins from 1830 to the present (Fig. 3A, B) and assessed the statis-tical support for an increase in average taxon completeness through time. SCM1, SCM2, CCM1 and CCM2 closely follow one another for each historical time bin (Table 5; Fig. 3, p
, 0.001), with CCMs tending to produce
slightly higher percentages for most de-cades. All four metrics show peaks in the 1830s, 1900s, and 1960s, with the 2000s actually being one of the decades with the lowest average completeness scores in each case (Fig. 3A,B). Contrary to the prediction
that specimen quality should improve
through historical time, our results suggest that there is no such trend (Fig. 3A,B; Pearson’s r , 0.15; p . 0.5). Additionally, runs tests demonstrate that there is no statistically significant departure from ran-domness (p . 0.127).
Type Specimens through Historical Time.— Benton (2008a) argued that the quality of dinosaurian type material has improved through historical time. We tested this claim
for sauropodomorphs by plotting SCMts and CCMtsagainst historical time, using Benton’s (2008a) ten-year time bins (Fig. 3C) (N.B. the 1860s have been excluded because no sauro-podomorph taxa were named during this decade). SCMtsand CCMtsdisplay low or no correlation with the other four metrics (Spear-man’s rs 5 0.325–0.449, p 5 0.064–0.205; Table 5) but do show a trend of improving completeness through historical time (Pear-son’s r , 0.542, p , 0.039; Fig. 3C), although runs tests indicate that there is no statistical support for any deviation from randomness
(p . 0.9). SCMts and CCMts both show a
statistically significant correlation with the trend found by Benton (2008a) (p , 0.022 for all tests). These results are in broad agreement with Benton’s (2008a,b) conclusions regarding dinosaurian type specimens as a whole, although the statistical support for this pattern is considerably weaker in our analysis and disappears completely when we apply the Bonferroni correction.
Using an entire data set may produce a statistically robust trend, but this may ob-scure variation in support for this trend within different parts of the data (for an example, see the earlier comparisons between completeness and sea level through
geologi-cal time). The SCMts and CCMts curves
(Fig. 3C) demonstrate considerable fluctua-tion in completeness from 1830 until around 1930, though there is a slight increase from 1850 to 1900. Completeness also appears to decline from the 1940s to the present. To test these observations, we partitioned our data into two portions, one covering 1830 to 1940 and the other from 1940 to the present, and then searched for statistical trends within each subset. Neither time interval showed any statistically significant trends in type specimen completeness (p . 0.373 for all Pearson’s tests; Fig. 3C). Similarly, statisti-cally insignificant results were recovered when we partitioned the data set into 1830– 1900 and 1900 to the present (p . 0.497 for all Pearson’s tests and for both time intervals). The differences between our results for sauropodomorphs and Benton’s results for dinosaurs as a whole are most marked for relatively recent historical time. The average FIGURE3. Completeness of taxa through historical time,
using both SCM (black bars) and CCM (gray bars). A, Most complete individual for SCM1 (Pearson’s r 5 0.0141; best-fitting line: y 5 20.717x + 42.876; p 5 0.5207) and CCM1 (Pearson’s r 5 0.0759; best-fitting line: y 5 20.2881x + 45.763; p 5 0.816). B, Percentage of taxon known for SCM2 (Pearson’s r 5 0.1028; best-fitting line: y 5 20.1418x + 45.547; p 5 0.8903) and CCM2 (Pearson’s r 5 0.1459; best-fitting line: y 5 0.1983x + 45.407; p 5 0.853). C, Completeness of type material for SCMts
(Pearson’s r 5 0.4956; best-fitting line: y 5 1.2823x + 6.7382; p 5 0.0419) and CCMts(Pearson’s r 5 0.4850;
best-fitting line: y 5 1.4923x + 8.2967; p 5 0.0193). Note that no valid taxa were named during the 1860s. The standard error of the estimate of the mean for each averaged completeness score is provided in the Supplementary Materials.
completeness of sauropodomorph types in the 2000s is no different from that of the 1920s and is less than that of the 1840s (Fig. 3C), and the 1940s and 1960s represent decades with the highest average completeness (though only one taxon, Riojasaurus, was described in the 1960s). In contrast, Benton (2008a) found that the 2000s has the second highest ratio of complete to incomplete dinosaurian type specimens. Benton (2008b) also highlighted an improvement in the naming of valid taxa in the last 15 years. To test whether there has been a recent improvement in sauropodo-morph type specimen completeness, we cal-culated average completeness for each year from 1970 to 2008 and from 1990 to 2008. Neither of these analyses produced any statistical support for a trend toward increas-ing completeness durincreas-ing these time periods (p . 0.66 for all Pearson’s tests; p . 0.27 for all runs tests).
We found the same lack of support for a recent trend in improving type specimen quality when we reanalyzed the original Benton data sets. We partitioned Benton’s data for dinosaurs as a whole into subsets covering 1830–1900 and 1900–2004; neither period displayed any statistical trends (p . 0.10 for all Pearson’s tests). Similarly, no trends were observed for the time interval 1940–2004 (p 5 0.31 for Pearson’s test).
Differences between Previous Work and Our Study.—This study and those by Benton (2008a,b) may have produced different re-sults because they used different methods for assessing type specimen quality. We calculated average completeness whereas Benton (2008a) used a ratio of ‘‘good’’ to ‘‘poor’’ specimens, and we used less arbi-trary percentages to express specimen com-pleteness whereas Benton (2008b) used a scale from 1 to 5. In addition, Benton (2008a) includes all species, regardless of their validity. We have evaluated the effect of these choices by re-running the analyses in three ways:
1. We used Benton’s data to calculate average completeness scores for type specimens (again in ten-year time bins) based on his quality scale from 1 to 5. These data
showed strong support for a trend of increased completeness with time (Pear-son’s r , 0.844; p , 1 3 1024; p 5 6.7 3 1023
for runs test). However, when this mod-ified data set was partitioned into 1830– 1900 and 1900–2004, we found a trend of improving completeness for the first peri-od (p 5 0.008), but again no statistical support for any trend for 1900–2004 (p 5 0.6; p 5 0.35 for runs test). In addition, we found no trend when we examined aver-age completeness during the time period of 1940–2004 (p 5 0.147).
2. We then used our SCMtsand CCMtsscores to assign sauropodomorph type specimens to ‘‘good’’ and ‘‘poor’’ categories (where ‘‘good’’ and ‘‘poor’’ are identified as speci-mens with SCMtsand CCMtsscores for the skull and/or skeleton that are higher or lower than 50% respectively) and calcu-lated ratios for each decade, in an attempt to replicate the methodology of Benton (2008a). For the period 1830–present, this analysis yielded weak support (Pearson’s r , 0.455, p 5 0.066)—although runs tests showed no statistical support (p 5 0.9)— for a trend of increasing type specimen completeness. This weak improving trend, however, disappeared completely when we partitioned the data into 1830–1900 and 1900 to the present (p . 0.41 for all Pearson’s tests).
3. Finally, we calculated SCMts and CCMts scores for all sauropodomorph species from 1940–2008, regardless of whether they are valid or invalid taxa. This mod-ified version of our data set yielded a trend toward decreasing type specimen com-pleteness in terms of average scores per decade (SCMts: Pearson’s r 5 20.825, p 5 0.027; CCMts: Pearson’s r 5 20.730, p 5 0.082), though this trend disappeared when we excluded the 1940s. We observed no statistically robust trends when we analyzed average completeness scores per year from 1940 to 2008 (p . 0.58 for all Pearson’s tests; p . 0.42 for runs tests), from 1970 to 2008 (p . 0.4 for all Pearson’s tests; p . 0.41 for runs tests), and from 1990 to 2008 (p . 0.84 for all Pearson’s tests; p . 0.66 for runs tests).
Discussion
Collection of Specimens.—The results of the analyses of historical trends in SCM1-2 and PCM1-2 suggest that paleontologists are con-tinuing to collect sauropodomorph material irrespective of its degree of completeness. We propose the following reasons for this: 1. Difficulty of determining the taxonomic
significance of a specimen while it is in the field, making a fragmentary specimen worth collecting ‘‘just in case.’’ There is also a growing appreciation that the completeness of a specimen is not entirely correlated with its systematic informa-tiveness; for example, even a very frag-mentary specimen can be valuable for phylogenetic analysis if it possesses an unusual combination of character states (Smith 1994; Upchurch et al. 2007b; Carrano and Sampson 2008). Moreover, as our knowledge of sauropodomorphs improves, a fragmentary specimen may prove to be sufficient to determine whether or not it represents a new taxon. 2. Demand from museums for sauropod specimens, even if they are very incom-plete (e.g., an isolated femur can still make a spectacular display).
3. Greater emphasis on consistent and com-plete sampling for studies of relative abundances and other paleoecological parameters or aspects of taphonomy (e.g., Behrensmeyer et al. 2000; Moore et al. 2007).
4. The exploration of new geographic loca-tions (Benton 2008a,b). Paleontologists working in previously unsampled por-tions of the fossil record are likely to collect a wide range of specimens, irre-spective of their completeness, because every new specimen is potentially a new data point.
The factors listed above may explain why very incomplete specimens are not left in the field as often as we might expect, but they do not counteract the ‘‘ratchet effect’’ on average completeness scores through historical time. However, average completeness scores will be lowered for a given time bin if systematists
name a large number of new sauropodo-morph taxa on the basis of relatively incom-plete material. Thus, the observation that average SCM and CCM scores fluctuate through historical time, rather than showing a gradual upward trend, indicates occasional influxes of relatively incomplete new taxa, and the low average score for the past decade implies just such an influx.
Type Specimen Quality.—The results from our analyses and the reanalyses of Benton’s data suggest that there is a historical trend toward increasing type specimen complete-ness, but only when the period of time considered includes the earliest phase of dinosaur discovery and naming (1830 to approximately 1900). This trend disappears when we examine more recent time periods, including 1900, 1940, 1970, or 1990 to the present. Decisions regarding ratios versus averages, or fine-grained percentage scales versus coarse-grained category scales, have a minor effect on the results of our analyses, but the broad conclusions remain unchanged. Similarly, including or excluding type speci-mens that are currently considered to be invalid does not alter our conclusions con-cerning the absence of a recent trend in type
specimen completeness for
sauropodo-morphs.
Benton’s work is based on dinosaurian taxa as a whole, whereas our data set is restricted to sauropodomorphs; perhaps the differences in our conclusions reflect peculiarities of the taxonomy in the latter group compared to theropods and ornithischians. If this is cor-rect, then trends that hold true for Or-nithischia and Theropoda might overwhelm a separate and different signal from the sauropodomorphs. In theory, one could test whether there are differences through histor-ical time in the quality of type material between sauropodomorphs, ornithischians, and theropods by partitioning Benton’s dino-saurian data into subsets pertaining to these three clades. Unfortunately, Benton’s data set does not provide a breakdown of type species numbers and quality scores beyond the level of Dinosauria. We note, however, that throughout the history of the study and naming of dinosaurs, many of the individual
workers who have erected new sauropodo-morph taxa (e.g., R. Owen, O. C. Marsh, E. D. Cope, F. von Huene, C. W. Gilmore and so on) have worked on a broad range of dinosaurs, encompassing all three major clades. It seems unlikely that these workers, and those of today, have applied inconsistent
standards when dealing with different
groups. This view is consistent with the observation, noted above, that the trend toward increasing type specimen complete-ness disappears for Dinosauria as a whole when Benton’s data set is reanalyzed for more recent time periods. Thus, pending a clade-by-clade analysis, we provisionally reject the idea that the systematic practices applied to sauropodomorphs have been significantly different from those applied to theropods and ornithischians.
The above results raise two questions. First, why did type specimen quality increase during the first 60 years of discovery and study of dinosaurs? Second, given that Ben-ton (2008a,b) has identified several factors that should have resulted in an increase in type specimen quality through historical time, why is such a trend not detectable from 1900 onward? The answer to the first question is probably straightforward. Poor average com-pleteness of the type specimens of the earliest named taxa is expected because early workers
had less material upon which to make comparisons; thus new specimens would frequently appear to be unique and only with subsequent discoveries would ‘‘diagnostic’’ features be shown to be ‘‘historically obsoles-cent’’ (Wilson and Upchurch 2003). In con-trast, modern workers have a wealth of comparative data, making it easier to recog-nize that a fragmentary specimen cannot be uniquely diagnosed as a new genus or species.
The absence of a more recent trend toward increased type specimen quality is a more complex issue. It seems self-evident that our knowledge of the dinosaurian fossil record is vastly superior today, and that many recently discovered taxa have been based on exqui-sitely preserved and very complete material, often including multiple individuals. For example, prior to the 1970s, the average number of sauropodomorph genera named per decade was less than four, rising to 13 and 12 new genera in the 1970s and 1980s respectively. From 1990 onward, there has been an exponential increase (Fig. 4), with 31 named in the 1990s and 71 (up to September 2008) named in the 2000s (accounting for 40% of all named sauropodomorph taxa). Under such circumstances, the relatively low com-pleteness scores for recently described type specimens seem paradoxical. However, it FIGURE4. Collector curve showing cumulative number of sauropodomorph taxa named through historical time.
should be noted that our data (and that of Benton [2008a,b]) are based on virtually comprehensive lists of type specimens and therefore include not only spectacular nearly complete skeletons and skulls, but also all type specimens based on isolated fragments. Thus, overall completeness scores for recent decades might be lowered because paleontol-ogists continue to name new taxa on the basis of very fragmentary specimens such as iso-lated teeth or vertebrae.
This explanation is supported both by our own data on sauropodomorphs and also by Benton’s (2008a) data for dinosaurs as a whole. For example, our data indicate that the 2000s has one of the lowest average
completeness scores. This is because,
although relatively complete taxa such as
Unaysaurus (SCMts 5 48%, CCMts 5 56%)
and Pantydraco (SCMts545%, CCMts560%) have been named this decade, numerous other taxa have been erected on the basis of very fragmentary material (e.g., Xenoposeidon [SCMts 5 1%, CCMts 5 6%], Borealosaurus [SCMts 5 1%, CCMts 53%] and Nopcsaspon-dylus [SCMts 5 1%, CCMts 5 7%]). Benton (2008b: Table 1 and supplementary materials) lists the number of type specimens in each time bin cohort for each of his five quality categories. Although the emphasis is upon the increasing number of type specimens with quality scores of 2–5 through time, the data also demonstrate an increase in type speci-mens with quality scores of 1: the three most recent cohorts (1990–1994, 1995–1999, and 2000–2004) all contain more type specimens with a quality score of 1 than any preceding five-year time bin, with the exception of 1875– 1879. Benton (2008a) noted that paleontolo-gists might be tempted to name new dino-saurian taxa on the basis of fragmentary material for a variety of reasons, such as intense public or media interest, or pressure from museums, funding agencies, or scientific journals.
The premises that relative completeness equates to type specimen quality, and that new taxa should be erected on the basis of high-quality (and therefore relatively com-plete) material, deserve critical evaluation. First, as noted previously, the completeness of
a specimen does not entirely correlate with how informative it is taxonomically or phy-logenetically. This is because the number of phylogenetically informative character states varies among taxa and across different re-gions of the skeleton. For example, the sauropods Barosaurus (SCM2 5 65%, CCM2
556%) and Omeisaurus (SCM2 5 98%, CCM2
5 100%) are currently known to possess only three and six autapomorphies respectively (Wilson 2002; Upchurch et al. 2004a). This contrasts with Xenoposeidon from the Early Cretaceous of the United Kingdom, which is based on a single incomplete dorsal vertebra (SCMts 5 1%, CCMts 5 6%) and yet appar-ently possesses six autapomorphies (Taylor and Naish 2007). Of course, the fact that the six autapomorphies of Xenoposeidon are re-stricted to a single dorsal vertebra, whereas the six pertaining to Omeisaurus are distrib-uted widely across its skeleton, might mean that the former taxon is more prone to historical obsolescence than the latter. Never-theless, it seems improbable that the ‘‘qual-ity’’ of a type specimen, in terms of its longevity as a valid taxon, is merely a function of its completeness; rather it may depend on a complex mix of completeness and information content.
A second critique that some workers have leveled is that the failure to name very fragmentary, but potentially diagnosable, specimens leads to biases in studies of diversity patterns (Naish and Martill 2007; Taylor and Naish 2007). One benefit of naming fragmentary, but diagnosable, speci-mens is that they tend to attract more attention from systematists than material labeled, for example, ‘‘Sauropoda indet.’’ Named specimens are therefore more likely to take part in studies of taxonomy, phylo-geny, diversity and biogeography.
In short, it is perhaps misleading and unhelpful to equate ‘‘completeness’’ with ‘‘quality’’; whereas completeness can be estimated quantitatively, quality is a subjec-tive term, which depends substantially on a researcher’s interests and the information we hope to derive from each specimen. Our results demonstrate that there is no discern-ible increase in the completeness of
dinosaur-ian type specimens through most of historical time to the present day, probably because paleontologists continue to name taxa on the basis of very incomplete specimens as well as very complete ones. This practice probably persists because of a complex mixture of motives, including the less desirable ones listed by Benton (2008a,b), as well as the more laudable scientific objectives outlined above. To suggest that dinosaurian type specimen quality is better now than in the past is not borne out by current data, and even if it were, such a statement is likely an oversimplifica-tion.
Completeness Metrics in a Wider Context Our completeness metrics could be mod-ified for use with other vertebrates, or even non-vertebrate groups. Such metrics are more ‘‘fine-grained’’ and less arbitrary than simple quality scales based on five or six broad categories. Below, we briefly discuss the potential advantages and disadvantages of the variants of SCM and CCM, which may affect decisions about their appropriateness for particular studies. We then turn to the potential role of completeness metrics in the study of diversity patterns.
The Costs and Benefits of Different Completeness Metrics
Overall, our results indicate that SCM1, SCM2, CCM1 and CCM2 behave in very similar ways (p , 0.001 for all tests, Tables 3, 5; Figs. 2, 3). This suggests that neither the choice of completeness metric nor the per-centages awarded to different parts of the skeleton significantly influence conclusions concerning the completeness of the sauropo-domorph fossil record through either geo-logical or historical time. Nevertheless, our work represents just a single set of case studies based on sauropodomorphs, and the metrics we used may not perform so consis-tently in other contexts or when applied to other groups.
In general, we prefer CCM to SCM because the percentage weights given to each part of the skeleton are dictated by the detailed evaluation of the distribution of anatomical characters in phylogenetic studies. The
per-centages used in the CCM therefore appear to be less arbitrary than those applied in the SCM. However, SCM and CCM estimate slightly different aspects of preservation in the fossil record. SCM attempts to capture a combination of the number of elements preserved and their physical bulk; it may be most useful in taphonomic studies that aim to quantify and compare the amount of material preserved in a series of individuals from different localities, facies, or horizons. CCM estimates the taxonomic/phylogenetic infor-mation content of each specimen and may therefore be particularly suited to the study of diversity patterns through geological time (see below) and trends in systematics through historical time. CCM also has the advantage over SCM and Benton’s (2008a,b) metrics in that it does not over-score poorly preserved, but complete, skulls, because it scores only the characters for which the skull can actually be coded.
We believe that SCM2 and CCM2 are more useful measures than SCM1 and CCM1. This is partly because SCM2 and CCM2 can encompass information from many individ-uals, thus allowing taxa such as bonebed-based forms (e.g., Lapparentosaurus) to be included (see ‘‘Materials and Methods’’). However, this strength is also a potential weakness: incorrect scores are more probable with these metrics because they rely more heavily on beliefs about the association of elements or the taxonomic affinities of in-dividuals.
Completeness Metrics as Sampling Proxies? Recent studies have raised concerns that the diversity fluctuations observed in the fossil record might, at least in part, be artifacts of sampling (Peters and Foote 2002; Peters 2005, 2008; Smith and McGowan 2007). This has led to the development of several meth-ods for measuring fossil record quality (e.g., Benton et al. 2000; Pol and Norell 2006; Wills et al. 2008), the removal of biases via rarefac-tion (e.g., Raup 1975), and the use of sampling proxies (e.g., Upchurch and Barrett 2005; Barrett et al. 2009; Butler et al. 2009). The completeness metrics proposed here could be added to the growing list of sampling proxies,
which currently includes numbers of fossil-bearing geological formations (Upchurch and Barrett 2005; Butler et al. 2009), numbers of collections or localities sampled (Crampton et al. 2003; Alroy et al. 2008), and area of sedimentary rock outcrop (Peters and Foote 2002; Peters 2005; Smith and McGowan 2007). Although a detailed comparison of SCM and CCM with other sampling proxies, and with sauropodomorph diversity, lies outside the scope of our study, we briefly examine some of the issues relating to use of completeness metrics as a sampling proxy and the extent to which completeness might control observed diversity in the fossil record.
The principle underlying the use of sam-pling proxies is that there should be some mechanism by which the proxy controls our opportunities to observe diversity in the fossil record. For example, sedimentary rock out-crop area could affect observed diversity because the amount of rock preserved during each time bin has some control over our opportunities to collect fossils. It is unlikely, however, that any single proxy will represent all of the diverse factors that might produce sampling biases. One aspect of observed diversity that is not captured by previous sampling proxies relates to how the state of preservation of fossils controls our opportu-nities to identify particular genera or species. A time bin might contain a relatively large amount of sedimentary rock including nu-merous formations, and might also have been thoroughly sampled in terms of the number of localities visited and the number of collec-tions made, but observed diversity will still be low if the recovered fossils are so fragmentary that they can be assigned only to indetermi-nate members of higher taxa. Our ability to identify fossils to lower taxonomic levels, such as genus or species, depends on which parts of the organism are preserved and the taxonomic/phylogenetic information content of those parts. Therefore, completeness met-rics, especially the CCM, could provide an additional sampling proxy for use in studies of paleodiversity patterns.
We noted above that completeness metrics do not capture information on the absolute numbers of specimens or taxa preserved in
each time bin. This could result in a mismatch between a completeness metric score and observed diversity. For example, the two time bins t1 and t2 could have the same complete-ness score of 40%, even though t2 has three times as many taxa as t1. It is even possible to envision a scenario where observed diversity might be inversely correlated with complete-ness scores (see the earlier example of the Early Cretaceous). Suppose there are two genera (x and y) in t1 and one genus (z) in t2. Suppose also that x and y are well preserved, each with individual SCM and CCM scores of 90%. The high completeness of these two genera means that we have many opportunities to compare their anatomy based on homologous skeletal elements. Consequently, the danger that taxonomic problems will artificially inflate the number of t1 genera is very low. In contrast, suppose that genus z is known from many specimens, but each is relatively incomplete and informa-tion on associainforma-tions is rare or absent. Over-enthusiastic naming of isolated but diagnos-able fragments of z could result in paleontol-ogists believing that there are many more genera present than is actually the case. For example, if the skull, dorsal vertebrae, and hindlimb of genus z are found separately at different locations, and each portion is diag-nosable, the absence of anatomical overlap between these specimens might mean that three genera are erected rather than one. Thus, a comparison of t1 and t2 would reveal that the former has lower observed diversity and higher completeness, and the latter has higher observed diversity and lower complete-ness. It is possible that this phenomenon is responsible for the negative correlation be-tween observed diversity and completeness in the Early Cretaceous. Such problems are likely to be reduced when (1) sampling of the fossil record is thorough, (2) the taxonomy and phylogenetic relationships of a group receive detailed and sustained attention, and (3) at least some of the taxa from a given time bin are well preserved and therefore provide opportunities to resolve issues such as the synonymy of taxa based on different parts of the skeleton. Nevertheless, the above scenar-ios demonstrate that we should question the
reality of relatively high observed diversity levels when the overall completeness score for that time bin is low.
Thus, if correlation between a completeness metric and observed diversity does not occur, this might be because of anomalous effects, such as those outlined above relating to taxonomic practice, but whatever the reason for the lack of correlation, this will show that completeness is not acting as a control and can be ignored further in a diversity study. However, if a correlation between observed diversity and a completeness metric is found (as is the case for sauropods in the Cretac-eous), then the effects of fluctuations in preservation quality through time should be evaluated and removed in order to obtain a more accurate reconstruction of diversity patterns.
Conclusions
The completeness of sauropodomorph speci-mens has fluctuated throughout geological time, with peaks in the Hettangian, Late Jurassic, and Late Cretaceous, and troughs in the Rhaetian, early Middle Jurassic, earliest Cretaceous, and early Late Cretaceous. Fluc-tuations in the Jurassic and Early Cretaceous correlate negatively with sea level, suggesting that high sea levels diminish the preservation potential of terrestrial organisms by decreasing the availability of land area (Markwick 1998). The application of completeness metrics to sauropodomorphs also reveals the surprising result that the fossil record for Cretaceous forms is poorer than that for Triassic and Jurassic ones. This may reflect the putative preference for inland habitats displayed by the Cretaceous titanosaurs (Mannion 2008; Man-nion and Upchurch 2010).
The results of Benton (2008a,b) for all dinosaurs and our analyses for sauropodo-morphs agree that type specimen complete-ness has increased since 1830. However, this ‘‘trend’’ masks a more complex picture in which completeness scores fluctuate from decade to decade, and from year to year, and in which there is no discernible trend from 1900, 1940, 1970, or 1990 to the present. The type specimens described during the earliest phase of dinosaur paleontology
(1830–1900) apparently were, on average, less complete than those described since 1900. However, we do not interpret this as reflect-ing an ‘‘improvement’’ in taxonomic practice; rather, it seems inevitable that the specimens discovered early in a field’s history will be genuinely ‘‘new,’’ irrespective of their com-pleteness, and will receive a name. As the number of type specimens and completeness of specimens available for comparison in-crease through time, many of the early type specimens will be shown to be invalid because their once diagnostic characters have become historically obsolescent. The fact that average type specimen quality has not in-creased since 1900, and indeed is particularly low for the past decade, suggests that paleontologists have continued to name new taxa on the basis of very incomplete speci-mens. We believe this interpretation holds true for all dinosaurs, not just sauropodo-morphs, because reanalysis of Benton’s data also indicates that there is no trend toward
increasing type specimen completeness
through more recent historical time. How-ever, future studies should test this proposal by examining theropods, ornithischians, and sauropodomorphs separately.
In general SCM1-2 and CCM1-2 appear to produce the same overall patterns through geological and historical time, but this is a single case study of sauropodomorphs and these metrics might diverge from each other when applied to other organisms. We recom-mend the use of all four metrics as each has its own benefits and pitfalls. The creation and application of quantitative completeness met-rics is still in its infancy and there is scope for modifying or refining these completeness metrics in future analyses. For example, the CCM could be refined by introducing infor-mation on the distribution of autapomorphies across the skeleton, in an attempt to highlight which skeletal elements are most informative for diagnosing taxa. In addition, complete-ness might be correlated with body size, such that smaller individuals are more likely to be complete; future studies may wish to explore this idea. Finally, much remains to be done in terms of comparing completeness metric scores with other measurements used as