Publisher’s version / Version de l'éditeur:
Vous avez des questions? Nous pouvons vous aider. Pour communiquer directement avec un auteur, consultez la première page de la revue dans laquelle son article a été publié afin de trouver ses coordonnées. Si vous n’arrivez pas à les repérer, communiquez avec nous à PublicationsArchive-ArchivesPublications@nrc-cnrc.gc.ca.
Questions? Contact the NRC Publications Archive team at
PublicationsArchive-ArchivesPublications@nrc-cnrc.gc.ca. If you wish to email the authors directly, please see the first page of the publication for their contact information.
https://publications-cnrc.canada.ca/fra/droits
L’accès à ce site Web et l’utilisation de son contenu sont assujettis aux conditions présentées dans le site
LISEZ CES CONDITIONS ATTENTIVEMENT AVANT D’UTILISER CE SITE WEB.
2nd International Building Physics Conference [Proceedings], pp. 445-454, 2003-09-01
READ THESE TERMS AND CONDITIONS CAREFULLY BEFORE USING THIS WEBSITE.
https://nrc-publications.canada.ca/eng/copyright
NRC Publications Archive Record / Notice des Archives des publications du CNRC :
https://nrc-publications.canada.ca/eng/view/object/?id=2fde7b33-629a-408f-a2ac-48eb8c6d8b18 https://publications-cnrc.canada.ca/fra/voir/objet/?id=2fde7b33-629a-408f-a2ac-48eb8c6d8b18
NRC Publications Archive
Archives des publications du CNRC
This publication could be one of several versions: author’s original, accepted manuscript or the publisher’s version. / La version de cette publication peut être l’une des suivantes : la version prépublication de l’auteur, la version acceptée du manuscrit ou la version de l’éditeur.
Access and use of this website and the material on it are subject to the Terms and Conditions set forth at
Hygrothermal performance of a masonry wall retrofitted with interior insulation
Hygrothermal performance of a masonry wall retrofitted with interior insulation
Said, M.N.A.; Demers, R.G.; McSheffrey, L.L.
NRCC-46109
A version of this document is published in / Une version de ce document se trouve dans: Research in Building Physics, Leuven, Belgium, Sept. 14-18, 2003, pp. 445-454
Hygrothermal performance of a masonry wall retrofitted with interior
insulation
M.N.A. Saïd, Ph.D, P.Eng.
R.G. Demers
L.L. McSheffrey
(Retired)Institute for Research in Construction National Research Council Canada
1200 Montreal Rd., Ottawa, Ontario, Canada K1A 0R6
ABSTRACT:
A 4-storey masonry building was retrofitted and converted to offices. The wall retrofit included the addition of insulation and vapour & air barriers on the inside of the brick wall. A section of the retrofitted wall was continuously monitored for over two years. This paper describes the monitoring program and discusses the hygrothermal performance of the retrofitted masonry wall.
The retrofit had a negligible effect on the drying potential of the brick wall during the summer months but reduced the wall drying potential during the winter months. The cooling rate of the brick mean temperature, at temperatures below 0°C, increased to -3.4°C/hr as compared to –2.7°C/hr for the uninsulated wall case. The moisture level in the brick wall increased, which was partially due to the retrofit and partially due to a wetter weather during the monitoring period. As a result of increased moisture level in the brick, the RSI-value of the brick wall decreased from an average of 0.31 in the first winter following the retrofit to an average value of 0.18 in the second winter months. The brick wall may be at a higher risk of frost damage than before the retrofit.
1 INTRODUCTION
Older masonry exterior walls may be retrofitted with insulation in order to reduce heat loss/gain through the walls. Insulation retrofit strategies include apply-ing insulation on the outside or the inside face of the masonry. The latter strategy is usually preferred when the façade heritage appearance must be pre-served. In the masonry wall with a cavity, the cavity may be filled with insulation in addition to the inte-rior/exterior insulation option. The following is a re-view of closely related literature that discussed the impact of insulation retrofit strategies on the hy-grothermal performance of brick masonry walls.
Hutcheon (1964) discussed the thermal behaviour of various insulation strategies of masonry walls. He indicated that the location of the insulation in the masonry wall has considerable effect on the tem-perature range across the wall and the resulted pos-sible dimensional changes. Wilson (1965) carried out measurements in 1.2 by 1.2-m and 2.4-m high test huts. His objective was to study moisture condi-tions in various masonry walls that were insulated on the inside face using mineral wool batt between wood furring, a vapour barrier, and an inside finish. The inside face of some masonry walls had a ½-inch
thick parging coat of 1:1:3 cement-lime mortar mix and others had asphalt saturated felt building paper. Wilson reported that there were no moisture prob-lems during the winter but some condensation oc-curred during the summer in the insulation and on the vapour barrier of walls incorporating permeable insulation on the inside of the masonry. Wilson noted that in the summer, moisture in masonry walls exposed to the sun is transferred by diffusion to-wards the inside of the building. As will be dis-cussed later, a similar process was observed in this study.
Andersson (1979), using computations, studied the consequences of adding insulation on the inside face of a 380-mm thick brick masonry wall. She concluded that the brick wall would be under greater risk of condensation during winter if a vapour bar-rier was not used or damaged. The brick wall might also be subjected to an increased risk of frost dam-age in severe driving rain climate conditions. An-dersson also concluded that the added insulation would not affect the wall thermal stresses.
Hens (1998) studied the hygrothermal perform-ance of masonry walls insulated on the inside face. He indicated that insulating masonry walls on the in-side face increased the significance of the thermal bridging effect of partition walls, which resulted in much lower R-value than that calculated. Also, the
masonry mean temperature increased by about 30% between winter and summer. The interior insulation might reduce the risk of temperature-induced crack-ing because the insulated masonry would have a lower temperature gradient than the non-insulated masonry. Hens also provided guidance on construct-ing masonry walls with a reduced risk for moisture related problems and demonstrated the significance of computation and laboratory testing in optimizing the design of masonry walls.
Maurenbrecher et al. (1998) monitored the hy-grothermal performance of two sections of a 765-mm thick masonry wall retrofitted with insulation on the inside face. One of the two wall sections was in-tentionally not insulated. Their finding included that the temperature of the masonry inside face was low-ered by as much as 25°C and was below freezing for several months during the winter. The RSI of the 765-mm thick masonry wall was lowered by 37% from 1.9 for the uninsulated wall section to 1.2 for the insulated wall section.
Dumont et al. (2001) studied two solid masonry wall buildings retrofitted with insulation on the inte-rior. One building located in central Canada was a 4-storey solid masonry, 480-mm to 400-mm thick, with a wood post and beam interior frame structure. It was retrofitted on the interior with an air space, wood frame wall, RSI 3.5 fiberglass batt insulation in the stud space, vapour barrier, and gypsum board finish. The retrofit also included a ventilation system to control indoor humidity. Monitoring results indi-cated that the masonry wall did not experience no-ticeable problems. The second building was a 4-storey solid masonry building located in a climate that is characterized as very cold, wide temperature swings, and heavy rainfall. The building was retro-fitted on the interior with a continuous 25-mm thick coating of spray applied polyurethane foam insula-tion, followed by a 45-mm air space, steel-stud wall, stud space filled with fiberglass insulation, and 12.5-mm foil-backed gypsum finish. A condition survey of the masonry wall 16-years later found the wall in good condition with no indication of adverse effects attributable to the retrofit strategy. Dumont et al., however, recommended caution and not to general-ize the promising results of the retrofitted cases stud-ied.
van Zijl & Verhoef (2001) used 2-D computa-tions to assess the impact of proposed interior insulation strategies on the masonry walls of a Dutch historic building built in 1906. The building struc-ture consists of load bearing masonry walls (330-mm thick except at piers where it is 440-(330-mm thick) and internal reinforced concrete columns, beams, and floors. The connections between the structural elements were rigid. The building, which was used as a soap-manufacturing factory, was to be reno-vated and converted to offices. The wall (bricks and mortar) was simulated as a homogenous continuum,
and the façade temperature was assumed to vary linearly with time (i.e. typical daily diurnal variation was not considered). The authors predicted that the standard application of insulation on the masonry in-side face would cause unacceptable cracking in the walls because the temperature difference between the wall and the concrete floor would increase. Cracks would be initiated between -7 & -10ºC tem-perature difference and reach unacceptable width at -32ºC.
Newman et al. (1982) tested nine cavity-wall type masonry walls with various fill-in insulation retrofit strategies. The masonry cavity-wall type incorpo-rates a continuous air cavity between the inner and the outer wythes. They found that the insulation ret-rofit increased the occurrence of damp patches on the inner wythe as a result of rain penetration. Hens & Ali (1995) used computation and measurements to examine the pros and cons of partial and entirely filled insulation retrofits of a masonry cavity-wall. Similar to Newman et al. (1982), Hens & Ali con-cluded that the cavity insulation fill retrofit in-creased the risk of damage due to rain penetration and interstitial condensation (that is in European climate and construction). They, however, noted that the filled masonry cavity is a forgiving system for imperfect design or construction. They also dis-cussed seven principles for a good wall design. Similarly, the Building Research Establishment guides (BRE 2001a, b) provide guidance on tech-niques, materials, and principal risks associated with insulating masonry cavity-walls in the UK.
Also relevant is the work of Bojic & Loveday (1997) and Al-Sanea & Zedan (2001). Bojic & Lov-eday (1997), using computation, investigated the in-fluence of the relative thickness and location of the insulation within the masonry wall on its thermal behaviour. Using the climatic condition for United Kingdom, they indicated that the location of the in-sulation in the wall could have considerable reduc-tion (32-72%) on the heating and cooling energy budget. Al-Sanea & Zedan (2001), using 1-D com-putation, studied the impact of insulation location on the initial transient thermal response of building en-velopes for the climatic conditions of Riyadh, Saudi Arabia. They concluded that, compared to placing the insulation on the outside, placing the insulation on the inside reduces the cooling load by 20% dur-ing the initial transient process.
In the present work, long-term field measurement was carried out in eastern Canada climate in order to assess the impact of an interior insulation retrofit strategy on the hygrothermal performance of a 330-mm thick brick wall. A section of the retrofitted brick wall was continually monitored for 27 months. This paper describes the monitoring program and discusses the hygrothermal performance of the retro-fitted brick wall including freeze-thaw cycles and thermal resistance of the wall.
2 THE BUILDING
It is a 4-storey building built in 1943 as a light in-dustrial factory in eastern Canada. Floor area is 1505-m2 per floor. The structure consists of a con-crete frame with solid brick masonry exterior walls 330-mm thick. In 1993/1994 the building was retro-fitted and converted to offices.
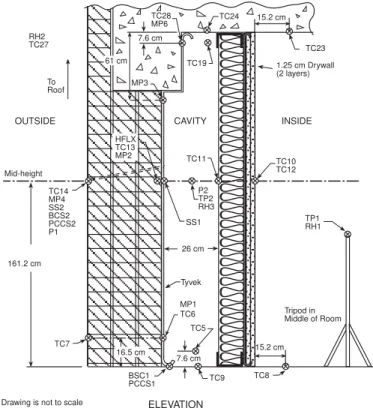
The brick wall retrofit strategy (Figure 1) in-cluded Tyvek on the inside face of the brick wall, an air cavity space, 38x140-mm steel-stud framing 394-mm on centre, 140-394-mm mineral fibre insulation batt (RSI 3.5) in the stud space, paper backed aluminum foil, and 2 layers of 12.5-mm gypsum boards. In or-der to square the floor space, the steel-stud wall was set away from the brick wall, which created a vari-able depth cavity space between the brick wall and the steel-stud wall. The cavity space at the moni-tored wall section was about 260-mm deep. The cav-ity space was used for electric wire routing to in-doors. This created two large air leakage paths, about 40-mm wide holes, at the top and bottom of the gypsum board in the interior steel-stud wall.
The building retrofit included new windows, lighting, and HVAC system. The HVAC system in-cluded air humidification, which started operating in mid March 1996.
Figure 1. Elevation of monitored wall section showing retrofit assembly and locations of some instrumentation.
[Where: BCS = brick ceramic moisture sensor, HFLX = heat flux sensor, MP = moisture pin sensor, P = pressure transducer, PCCS = printed circuit condensation sensor, RH = relative hu-midity sensor, SS = Sereda moisture sensor, TC = thermocou-ple, and TP = Platinum resistance temperature probe].
2.1 Monitoring program
A section of the brick wall was continuously moni-tored from April 1995 to June 1997. The main objectives of the long-term monitoring were:
− To assess the impact of the retrofit on the hygrothermal performance of the brick wall, and
− To provide data for validation of hygrothermal computational fluid dynamics models.
The monitored wall section was located approxi-mately in the middle of the east façade, oriented northeast (NE), of the fourth floor. Figure 1 shows selected sensor locations. The major parameters monitored included:
− Ambient conditions;
(a) Outdoor air temperature and relative humidity (RH) were measured on site. Other meteorological conditions were taken from the Meteorological Service of Environment Canada.
(b) Temperature and RH of indoor air and cavity air. The latter was measured at three heights. In addition, three thermocouple arrays measured cav-ity air temperatures for numerical simulation ap-plications. Two vertical arrays were located in the boundary stud spaces to the right and the left of the monitored stud-space. A third 3-point horizon-tal array measured cavity air temperatures across the depth of the wall-cavity.
− Brick wall’s exterior surface temperatures were measured at four locations.
7.6 cm INSIDE CAVITY OUTSIDE TC10 TC12 TC11 P2 TP2 RH3 SS1 26 cm Tyvek TC5 TC7 161.2 cm TC14 MP4 SS2 BCS2 PCCS2 P1 Mid-height TP1 RH1 Tripod in Middle of Room 15.2 cm TC8 TC9 7.6 cm BSC1 PCCS1 ELEVATION To Roof TC23 TC19
ote: Drawing is not to scale
16.5 cm HFLX TC13 MP2 61 cm 1.25 cm Drywall (2 layers) MP3 RH2 TC27 MP1 TC6 TC28 MP6
− Temperatures of surfaces in the wall cavity in-cluded the brick wall at two heights, spandrel concrete beam, top and bottom steel tracks, steel-stud at mid-height, and the concrete floor and ceiling within the wall-cavity and indoors.
− Gypsum board indoor surface temperature was monitored at 3-heights at a stud and at mid-way the stud space.
− Heat flux through the brick wall.
− Air pressure differentials, outdoor-to-indoor and wall cavity-to-indoor.
− Moisture measurements: a variety of moisture sensors were used to monitor time of wet-ness/dryness of surfaces and changes in moisture content in the brick wall. This included the brick wall exterior surface at 2 locations, brick wall in-side surface at 3 locations, the spandrel concrete beam, and the floor in the wall cavity. Saïd et al. (1997) provides more detailed information on moisture sensors.
2.2 Instrumentation system
Temperatures were measured, primarily, using type-T shielded thermocouple wire, accuracy ±0.5oC. Ra-diation shields were used for the interior and exterior air temperature sensors. RH was measured using humidity sensors with accuracy ±1% for 0 to 90% range and ±2% outside this range. Two air pressure
15.2 cm TC24
transducers ranges were used, a ±250 Pa range for the cavity-to-indoor air pressure differential and a ±625 Pa range for the outdoor-to-indoor air pressure differential. The accuracy of the pressure transduc-ers was ±0.14% of full scale. The stated accuracy of the heat flux sensor was ±5%. A calibration check at the National Research Council Canada indicated an accuracy of ±3%. Resistance measurements for the resistance-type moisture sensors were measured di-rectly using a 10-channel digital multimeter scanner, 300-MΩ range and ±2 % accuracy, in conjunction with the data logger. All sensors were connected to a data acquisition system, which automatically sam-pled a total of 53 sensors once every minute. In ad-dition to the one-minute data records, the data was averaged and saved every 10 minutes and every hour.
3 RESULTS AND DISCUSSION
Initially, the 1-minute data and the 10-minute aver-aged data were used to debug the monitoring system over the period April-June 1995. The results and ob-servations discussed here are based on the recorded hourly averaged data for the period July 1995 to June 1997.
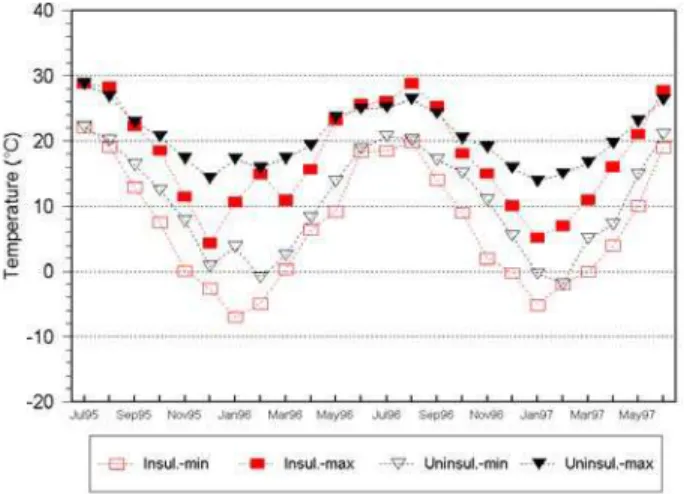
3.1 Ambient conditions
The climate of eastern Canada is generally charac-terized as very cold, wide temperature swings, and heavy rainfall. Monitored data covered a wide range of seasonal environmental variations. Figure 2 shows maximum and minimum temperatures of out-door air and the brick wall exterior surface. The temperatures show diurnal seasonal variations with summer and winter being the extremes and the re-maining months falling in-between. Outdoor air temperature ranged from 38°C (August 1995) to -25°C (January 1997). 1995 and 1996 were slightly (3%) warmer than normal, while 1997 was close to normal (Figure 3). Total annual precipitation was higher than normal during the monitoring period (Figure 3). Compared to normal, precipitation was 20% higher in 1995 and 1997 and 13% higher in 1996. Number of days with measurable precipitation was close to normal in 1995 and 1996 and was 6% lower in 1997. Hours of bright sunshine were slightly higher than normal in 1995 and 1997 by 6% and 3% respectively, and were normal in 1996.
The HVAC maintained the indoor air temperature between 23°C and 24°C during the summer. During winter, December to February, indoor air tempera-ture was about 28°C as perimeter baseboard heaters were used.
Figure 2. Monthly minimum & maximum temperatures of out-door air and brick wall exterior surface at wall mid-height, mid-way stud space.
Figure 3. % of normal values of degree-days, total annual cipitation (Precipitation), number of days with measurable pre-cipitation (Precip. days), and hours of bright sunshine (Sun-shine). Normal values: 4575 degree-days base 18°C, 940-mm total annual precipitation, and 162 days with measurable pre-cipitation, 2033 hours of bright sunshine. [Source: Environ-ment Canada].
Figure 4. Monthly minimum & maximum temperatures of wall-cavity air and brick wall interior surface at test wall mid-height mid-way stud space.
Temperatures of the air in the wall-cavity and the brick wall interior surface followed the diurnal
variations of outdoor air temperatures (Figures 2 and 4) with an expected time lag of the brick wall ther-mal mass. The noted increase in cavity air and brick surface temperature in February 1996 was a result of the indoor air influx when the wall-cavity was opened for inspection. In summer, the air in the 260-mm deep wall-cavity was well mixed. Monitored air temperatures were uniform and were very close to room air temperatures. Temperature stratification (ceiling-to-floor temperature difference) was very small. This indicated the presence of convection cur-rents in the wall-cavity, which would reduce the in-sulation effectiveness and result in a higher cooling load.
As noted earlier, there were two large air leakage paths at the top and bottom of the interior steel-stud wall. Under stack effect conditions during winter months, the warmer room air would flow into the wall-cavity through the top opening and cavity-air would flow into the room through the bottom open-ing. The flow of room air into the wall-cavity re-sulted in higher than usual measured air tempera-tures in the wall-cavity in the winter months, up to 13°C in January 1996 (Figures 4 & 5). It also con-tributed to higher temperatures of the concrete beam at the top of the wall cavity (Figure 5).
The incoming room air at the top of the wall-cavity also contributed to large air temperature stratification in the cavity in winter months. Ceiling-to-floor temperature difference was up to 13oC (Fig-ure 5). Air in the wall-cavity was characterized by two layers. A lower layer, up to wall mid-height, characterized with a small vertical temperature change (0.5°C/m), and a warmer upper layer charac-terized by a larger vertical temperature change of 4°C/m. The air temperature along the cavity depth at wall mid-height was uniform.
Figure 5. Vertical temperature profile of air in wall-cavity and surface temperature of the brick wall interior surface and the spandrel concrete beam, mid-way stud space.
Indoor air relative humidity (RH) ranged from 6% in winter to 71% in summer. The HVAC hu-midification system started operation in March
1996. Often, RH of indoor air and wall-cavity air followed the variation of outdoor air RH but at a lesser extent suggesting little control of RH. In the wall-cavity, RH ranged from 25% to 97% and was in the higher range, 80%, most of the time.
3.2 Air pressure differential
In absence of high wind conditions, the monitored wall section was subjected to air pressure differen-tials, outdoor-to-indoor, within ±18 Pa, which is typical for most buildings. During high wind condi-tions, air pressure differentials were within –63 to +334 Pa. If leakage openings exist, the wall section would be subjected to potential air infiltration during summer months and air exfiltration during cold win-ter months. Air pressure differential wall cavity-to-indoor, was within -9 to +2 Pa. Higher indoor air pressure than cavity air pressure is desirable in terms of indoor air quality concerns, but it also increases the risk of condensation of leaked indoor air on cooler cavity wall surfaces.
The monitored area was depressurized, about 10 Pa, by the HVAC system operation. The air pressure differential outdoor-to-indoor rose to 13 Pa during the mechanical system operation (05:00 to 20:00) and decreased to 3 Pa when the system was off at night. Cavity-to-indoor air pressure differential was slightly affected, about 2 Pa, by the mechanical sys-tem operation because the wall cavity was well con-nected to indoors by the large air leakage paths at the top and bottom of the interior steel-stud wall. 3.3 Brick wall performance
The surface temperatures of the brick façade, meas-ured at 4 locations, were generally uniform. Façade temperature is mainly affected by outdoor conditions such as air temperature and solar/sky radiation. The façade temperature followed the diurnal changes in outdoor air temperature (Figure 2), and was usually within 2 to 5°C from the ambient air temperature. The effect of solar radiation heat was minimal be-cause of the northern exposure of the monitored wall section (oriented NE). Similarly, the temperature of the brick inside face followed outdoor air tempera-ture diurnal variation with expected time lag of the brick wall thermal mass (see Figures 4 and 2).
The exterior surface temperature ranged from -20°C in winter (usually in January) to 36°C in summer (usually in July/August) with an annual temperature range of about 56°C (outdoor air tem-perature annual range was about 61°C). The brick interior surface temperature varied from -7°C in winter (usually in January/February) to 29°C in summer (July/August) with an annual temperature range of 36°C (cavity air temperature annual range was about 30°C). The inside surface temperature was below freezing for many days during the winter.
The mean temperature of the brick wall ranged from -13°C in January to 31°C in July/August.
The wall section was not monitored prior to the insulation retrofit. As discussed earlier, the tempera-ture of the exterior surface of the brick wall prior to the insulation retrofit would be the same as that for the insulated wall because it is generally affected by outdoor conditions. The temperature of the interior surface of the uninsulated brick wall case was ob-tained using a 1-D differential equation and an ex-plicit finite difference formulation as suggested by Kimura (1977). The temperatures of the brick exte-rior surface and room air were imposed as boundary conditions. The computations were carried out for an average brick density of 2050 kg/m3 as measured for brick samples from the building, a brick wall ther-mal conductivity of 1.06 W/m·K, and a brick spe-cific heat of 800 J/kg·K (ASHRAE 2001). The com-putation scheme was validated by computing the measured brick interior surface temperature for the insulated wall case. Computed temperatures agreed quite well with measured temperatures (for example, see Figure 6).
Figure 6. Computed and measured temperatures of the brick wall interior surface for the months of July 95 and January 96.
During summer months, the interior insulation retrofit had little effect on the interior surface tem-perature of the 330-mm thick brick wall (Figure 7). The maximum interior surface temperature was about 29°C for both the insulated (measured) and the uninsulated (computed) cases. Hence, the retrofit would have little effect on the drying potential of the brick wall in summer months. However, during the winter months, the temperature of the interior sur-face of the brick wall was lowered because the insu-lation retrofit reduced the heating effect of indoor air. The minimum interior surface temperature of the insulated brick wall was -7°C as compared to -2°C for the uninsulated wall case.
The maximum temperature difference across the brick wall decreased by 28% from 30.5°C for the uninsulated case to 22°C for the insulated case. This would reduce the drying potential of the brick wall
during the low-sun months October-March. The brick wall might take a longer time to dry, particu-larly the north facing walls.
Figure 7. Monthly minimum and maximum temperatures of the interior surface of the insulated (measured) and uninsulated (computed) brick wall at wall mid-height mid-way stud space.
The mean temperature of the 330-mm thick brick wall decreased from a low of –8°C for the uninsu-lated case to -13°C for the insuuninsu-lated case. The win-ter-to-summer mean temperature range increased by 16% (from 38.5°C to 44.6°C) as a result of the insu-lation retrofit. This result is consistent with the find-ing of Hens (1998), which indicated that, as a result of an interior insulation retrofit of a 190-mm thick brick wall, the mean temperature of the brick wall increased by about 30% between winter and sum-mer.
The increase in the brick wall mean temperature range from winter and summer might increase po-tential stresses in the brick wall due to thermal movement depending on the degree of restraint by other structure members. The mean temperature range 44.6°C from winter to summer of the insulated brick wall might produce 0.24 mm/m dimensional change in the brick. Typical cyclical dimensional change for clay brick is 0.1 mm/m (CMHC 1997). This result refines the finding of Andersson (1979) that the added insulation would not affect the dura-bility limit of the wall due to thermally induced stresses.
As expected, during summer, the insulation retro-fit had little effect on the rise rate of the mean tem-perature of the brick wall, which was about 4.2°C/hr for both the insulated and uninsulated wall cases. In winter, however, the cooling rate of the brick mean temperature (at temperatures below 0°C) increased from –2.7°C/hr for the uninsulated case to -3.4°C/hr for the insulated wall. Cooling rate is one of the fac-tors that affect the freeze-thaw durability of the brick. Litvan (1984) noted that the risk of frost dam-age increases with increased cooling rates because a fast cooling rate reduces the water’s chance to es-cape towards the back of the brick. In the current
study, the change in the cooling rate is not signifi-cant.
Table 1. Freeze-thaw cycles for 0 to –5°C threshold freezing tempera-tures for insulated and uninsulated wall cases
Freeze-thaw cycles, Winter 95/96 Freeze-thaw cycles, Winter 96/97 Freezing temperature (ºC) 0 -2 -3 -4 -5 0 -2 -3 -4 -5 Insulated wall Outdoor air 45 42 47 47 40 55 59 51 51 45 Exterior surface 34 35 41 40 33 32 42 39 34 27 Interior surface 9 7 3 2 1 8 2 2 3 1 Brick mean temp 23 22 19 18 14 24 19 20 14 11 Uninsulated wall
Interior surface 1 2 Brick mean temp 18 9 8 8 4 13 8 6 6 4
3.4 Freeze-thaw cycles of brick wall
A freeze-thaw cycle was defined as a temperature drop below a threshold freezing temperature and the return above that threshold. Within the brick wall, freezing temperature might be lower than zero be-cause of dissolved salts in the brick pores. Freezing temperature thresholds of 0 to –5°C were used to es-timate the number of freeze-thaw cycles for the brick wall (Table 1).
For the climate condition during the monitoring period July 1995 to June 1997, the -2°C freezing temperature threshold gave the highest freeze-thaw cycles for the exterior surface (42 cycles in winter 96/97). The 0°C threshold gave the highest freeze-thaw cycles for the interior surface (9 cycles in win-ter 95/96). Based on the mean temperature of the brick wall, the highest number of freeze-thaw cycles was 24 cycles for 0°C freezing threshold and 22 cy-cles for -2°C threshold.
As would be expected, the interior surface of the uninsulated brick wall would experience much less freeze-thaw cycles (Table 1). Based on 0°C thresh-old, the interior surface would experience 1 cycle in winter 95/96 and 2 cycles in winter 96/97. It would not experience freeze-thaw cycles for thresholds lower than 0°C. Based on the mean temperature of the uninsulated brick wall, the highest number of freeze-thaw cycles would occur for the 0°C thresh-old (18 cycles in winter 95/96 and 13 cycles in win-ter 96/97).
Based on the brick wall mean temperature, the in-sulation retrofit exposed the brick wall from 85% (0°C threshold) to 250% (-5°C threshold) more freeze-thaw cycles than the uninsulated brick wall case. At -2°C freezing threshold, the highest number of freeze-thaw cycles occurred in January for the in-sulated wall case (7 cycles) and in January/February for the uninsulated wall case (5 cycles).
Frost damage risk of the brick wall depends on a number of factors including the degree of moisture
saturation (over 75% saturation), pore structure, ma-terial thickness, mama-terial strength, rate of freezing,
and the number of freeze-thaw cycles (Baker 1964 & Latta 1962). Based on the brick wall mean temperature, the freeze-thaw cycles experienced by the NE facing brick wall were 22 cycles at -2°C freezing threshold. However, façade facing east, south, or west may be at a higher frost damage risk because they might experience higher number of freeze-thaw cycles due to solar heat which warms up the façade above freezing during cold days. Exposure tests by Ritchie & Davison (1968) indicated that there is a considerable directional influence on the number of freeze-thaw cycles; for example, the brick facing south experienced almost twice as many cycles as that facing north. Davison (1970), however, reported that masonry walls sel-dom reach a degree of saturation sufficiently high to cause frost damage. Factors affecting the moisture content of the brick wall include the nature of the material, wind-driven rain exposure, and water shedding details.
3.5 Thermal resistance of brick wall
The thermal resistance was calculated using meas-ured temperature difference across the brick wall, and the heat flow through the wall. Because of the thermal mass of the wall, there is a time lag, about 24-hour, between the temperature and the heat flow through the wall (the time lag was estimated using cross-correlation calculations). A summation tech-nique as per ASTM C1155-95 was therefore used to determine the cumulative average of the thermal re-sistance of the brick wall. One-week cumulative av-erage was found to be the minimum and one-month cumulative average being preferable.
Figure 8. RSI (m2·K/W) of the brick wall and corresponding brick wall mean temperature. RSI values are 30-days cumula-tive average, not corrected for temperature, and do not include surface film coefficients.
0 0.1 0.2 0.3 0.4 0.5 0.6 RSI -4 -2 0 2 4 6 8 Mea n Temp era tu re ( °C )
Nov95 Dec95 Jan96 Feb96 Mar96 Nov96 Dec96 Jan97 Feb97 Mar97
RSI Mean T
Figure 8 shows the brick wall RSI (m2·K/W) and mean temperature over the cumulative averaging pe-riod. In the first winter following the insulation
ret-rofit, RSI ranged between 0.3 to 0.39 over Nov. 95 to Feb. 96 before decreasing to 0.18 in March 96. RSI averaged 0.31 over the 1st winter of monitoring (Nov. 95 to March 96), which decreased to an aver-age of 0.18 in the second winter of monitoring (Nov. 96 to March 97). This decrease in RSI is believed to be due to higher moisture level in the brick wall, as noted earlier, as a result of decreased drying poten-tial of the brick. Efflorescence observed on the fa-çade is a sign of increased moisture level in the brick wall. The presence of moisture in the brick’s pores increases the conductivity of the brick and reduces its effective thermal resistance. In this study, tem-perature effect on estimated RSI values would be negligible because the brick wall mean temperature in winter 95/96 (0ºC) was very close to that in win-ter 96/97 (1.2ºC). Also the brick wall mean tempera-tures were mostly close for similar months in the two winters except for the month of December, which was -2ºC in 1995 compared to 4ºC in 1996 (Figure 8).
In the first winter, 95/96, of monitoring, the av-erage thermal conductivity of the monitored 330-mm thick brick wall was about 1.15 W/m·K (corre-sponding brick mean temperature was 0ºC). In the 2nd winter, 96/97, the average thermal conductivity of the brick wall increased to 1.9 W/m·K (brick mean temperature 1.2ºC). Other than higher mois-ture content, the reason for this high value is not clear given the degree of saturation of the brick wall. It is also noted that, the measured thermal conductivity values would generally be higher than that measured in the laboratory because of the thermal bridging effect of the concrete floors. Hens (1998) indicated that insulating masonry walls on the inside face increased the significance of the thermal bridging effect of partition walls. This resulted in a much lower measured R-values (higher thermal conductivity) than that measured in the laboratory.
3.6 Moisture performance
Moisture sensors on the façade indicated periods of wetting and drying due to driving rain and con-densation. The moisture pin sensors inserted 10-mm into a mortar joint on the inside surface of the brick wall indicated delayed changes in moisture level corresponding to the wetness/drying patterns on the façade. Figure 9 shows an example of the delayed wetting/drying reaction of moisture pin sensors on the brick interior surface (MP1 & MP3) to façade wetness/drying as indicated by the brick ceramic moisture sensor (BCS2). The delay is associated with moisture diffusion and possible capillary suc-tion processes through the brick wall.
Similar to Wilson’s (1965) observation, moisture diffusion in the brick wall was driven to the inside by solar heat particularly during the high-sun months April to September. As a result, cavity air
dew point temperature (an indicator of moisture level in the air) was higher than indoor air dew point most of the time (Figure 10). The dew point of the air in the wall-cavity followed the variations of out-door air dew point with a time lag.
Moisture and temperature sensors in the wall cav-ity indicated several surface condensation events on the brick interior surface and the concrete floor in the wall cavity as the surface temperature decreased below the air dew point temperature. The condensed moisture, however, dried within 2 to 11-hour. The air leakage from indoors through the openings at the top and bottom of the interior steel-stud wall proba-bly contributed to the wetting as well as aided in the drying of the wetness. Thus, for the retrofit case studied, surfaces in the wall-cavity are unlikely to experience excessive condensation problems. No wetness was indicated on the ceiling of the wall cav-ity. The ceiling surface temperature was always higher than the air dew point during the monitoring period.
Figure 9. Example of delayed wetting/drying reaction of mois-ture sensors on the brick interior surface (MP1 & MP3) to fa-çade wetness/drying indicated by a brick ceramic moisture sen-sor (BCS2). A drop in sensen-sor output, resistance, indicates increase in wetness and vise versa.
Figure 10. Monthly max & min dew-point temperatures of air outdoors, in wall-cavity, and indoors.
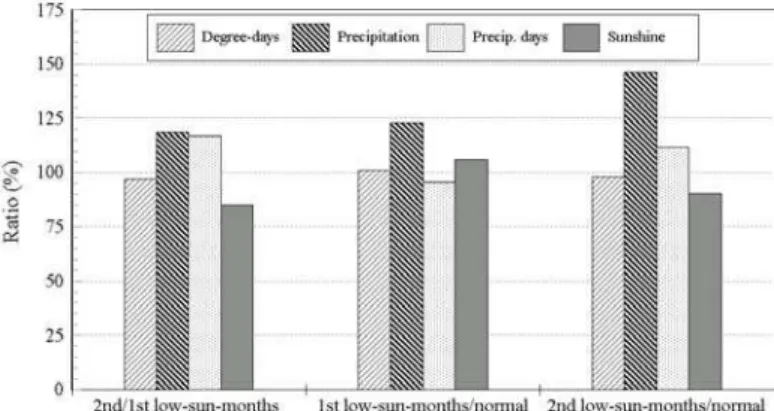
As discussed earlier, moisture level in the brick wall increased in the 2nd winter following the insula-tion retrofit. This was partially due to the retrofit that led to lower drying potential of the brick wall during the low-sun-months, October to March, and partially due to a wetter climate. The total precipitation in the 2nd low-sun-months (Oct. 96-March 97) was 19% higher than that in the 1st low-sun-months (Oct. 95-March 96), and 46% higher than normal (Figure 11). Compared to the 1st low-sun-months period, the 2nd low-sun-months period was slightly warmer (3%), number of days with measurable precipitation was 17% higher, and the hours of bright sunshine were 15% less. Figure 11 also compares 1st and 2nd low-sun-months periods to the normal values (Figure 11). Also the coldest month January 1997 had 30% less bright sunshine than that in January 1996.
Efflorescence observed on the façade is a sign of increased moisture level in the brick wall. Efflores-cence usually peaks in late winter months because the temperatures at the time create conditions, which bring moisture in the brick to the surface where it evaporates and leaves salt deposits on the surface (Davison 1970 & Ritchie 1960).
Figure 11. Comparison (%) of 1st year low-sun-months (Oct. 95-March 96), 2nd year low-sun-months (Oct. 96-March 97), and normal values of degree-days, total annual precipitation, number of days with measurable precipitation, and hours of bright sunshine. Normal values: 3840 degree-days base 18°C, 442-mm total annual precipitation, and 87 days with measur-able precipitation, 690 hours of bright sunshine. [Source: Envi-ronment Canada].
4 CONCLUSION
A section of a 330-mm thick brick wall retrofitted with insulation from the inside was continually monitored for over 2 years. The paper discussed the impact of the retrofit on the hygrothermal perform-ance of the brick wall, which included:
The retrofit had a negligible effect on the drying potential of the brick wall during the summer months but reduced the wall drying potential during the winter months because the temperature differ-ence across the brick wall decreased by 28%. The mean temperature range winter-to-summer of the
brick wall increased by 16%, which might lead to higher stresses in the wall depending on the degree of restraint by other structure members. The cooling rate of the brick mean temperature at temperatures below 0°C increased to -3.4°C/hr as compared to – 2.7°C/hr for the uninsulated case, which is not sig-nificant.
Based on the brick wall mean temperature, the in-sulated brick wall was exposed to 22 freeze-thaw cycles at -2°C freezing temperature threshold as compared to 9 cycles for the uninsulated wall. The brick wall interior surface was exposed to 7 cycles as a result of the insulation retrofit.
For the retrofit case studied, surfaces in the wall-cavity are unlikely to experience excessive conden-sation problems. Wetness, due to condenconden-sation, dried within 2 to 11-hour. Air leakage from indoors through openings at the top and bottom of the inte-rior steel-stud wall probably contributed to the wet-ting as well as aided in the drying of the wetness.
RSI of the brick wall decreased from an average of 0.31 in the first winter following the retrofit to an average value of 0.18 in the second winter months due to higher moisture level in the brick wall. The higher moisture level was partially due to a reduced drying potential of the brick wall during the low-sun months October to March and partially due to a wet-ter climate during the monitoring period.
5 ACKNOWLEDGEMENT
The authors gratefully acknowledge the helpful dis-cussion of Dr. A.H.P. Maurenbrecher and Mr. C.J. Shirtliffe and the assistance of Mr. K. Trischuk in measuring the density of a brick sample.
6 REFERENCES
Al-Sanea, S.A. & Zedan, M.F. 2001. Effect of insulation loca-tion on initial transient thermal response of building walls. Journal of Thermal Envelope and Building Science, April, pp. 275-300
Andersson, A.C. 1979. Additional insulation of existing build-ings – technical consequences. 5th International Brick/Masonry Conference, Philadelphia, PA, USA.
ASHRAE 2001. ASHRAE Handbook Fundamentals, SI Edi-tion. ASHRAE Inc., Atlanta, GA 30329, USA
ASTM 1995. Standard practice for determining thermal resis-tance of building envelope components from the in-situ data. Standard C1155-95, American Society for Testing and Materials, PA, USA.
Baker, M.C. 1964. Thermal and moisture deformations in building materials. National Research Council Canada, In-stitute for Research in Construction, Canadian Building Di-gest, CBD-56, August.
Bojic, M.Lj. & Loveday, D.L. 1997. The influence on building thermal behaviour of the insulation/masonry distribution in a three-layered construction. Energy and Buildings Journal, Vol 26, No 2, pp. 153-157.
BRE 2001a. Insulating masonry walls: techniques and materi-als, Good Building Guide. GBG44, Part 1, Building Re-search Establishment, Watford, Herts, UK, January.
BRE 2001b. Insulating masonry walls: principal risks and guidance – Part 2, Good Building Guide. GBG44, Part 2, Building Research Establishment, Watford, Herts, UK, February.
CMHC 1997. Best practice guide: building technology – brick
veneer concrete masonry unit backing. Canada Mortgage
and Housing Corporation, 700 Montreal Road, Ottawa, On-tario, Canada.
Davison, J.I. 1970. Cold weather masonry construction. Na-tional Research Council Canada, Institute for Research in Construction, Canadian Building Digest, CBD-123, March. Dumont, R.S., Snodgrass,L.J. & Hill, D. 2001. Insulating solid
masonry buildings: case studies of interior retrofit. Proceed-ings of the 8th Conference on Building Science and Tech-nology – Solution to Moisture Problems in Building Enclo-sures, Feb. 22-23, Toronto, Ontario, Canada, PP. 209-222. Hens, H. 1998. Performance predictions for masonry walls
with inside insulation using calculation procedures and laboratory testing. Journal of Thermal Envelopes and Building Science, Vol. 22, July, pp. 32-48.
Hens, H. & Ali, M.F. 1995. Heat-air-moisture design of ma-sonry cavity walls: theoretical and experimental results and practice. ASHRAE Transactions 1, Paper # CH-95-3-2. ASHRAE INC., Atlanta, Georgia, USA.
Hutcheon, N.B. 1964. Principles applied to an insulated ma-sonry wall. National Research Council Canada, Institute for Research in Construction, Canadian Building Digest, CBD-50, February.
Kimura, K. 1977. Scientific Basis of Air Conditioning. London. Applied Science Publishers Ltd.
Latta, J.K. 1962. Water and building materials. National Re-search Council Canada, Institute for ReRe-search in Construc-tion, Canadian Building Digest, CBD-30, June.
Litvan, G.G. 1984. Frost action in porous systems, National Research Council Canada, Institute For Research In Con-struction, DBR Paper No. 1176, NRCC-0023133.
Maurenbrecher A.H.P., Shirtliffe, C. J., Rousseau, M. Z. & Saïd, M.N.A. 1998. Monitoring the hygrothermal perform-ance of a masonry wall with and without thermal insulation on its interior surface. Proceedings of the 8th Canadian Ma-sonry Symposium, Jasper, Alberta, Canada, May 31-June 3. Newman A.J., Whiteside, D., Kloss, P.B. & Willis, W. 1982. Full-scale water penetration tests on twelve cavity fills – Part I. nine retrofit fills. Building and Environment Journal, Vol. 17, No. 3, PP. 175-191.
Ritchie, T. & Davison, J.I. 1968. Moisture content and freeze-thaw cycles of masonry materials. ASTM Journal of Mate-rials, Vol. 3, No. 3, September, pp. 658-671.
Ritchie, T. 1960. Efflorescence. National Research Council Canada, Institute for Research in Construction, Canadian Building Digest, CBD-2, February.
Saïd, M.N.A., Brown, W.C. & Walker, I.S. 1997. Long-term field monitoring of an EIFS clad wall. Journal of Thermal Insulation and Building Envelopes, V. 20, April, pp. 320-338.
van Zijl, G.P.A.G. & Verhoef, L.G.W. 2001. Computational assessment of renovation intervention in a historic masonry building. Proceedings the 9th Canadian Masonry Sympo-sium “Spanning the Centuries with Masonry, University of New Brunswick, Fredericton, New Brunswick, Canada, June 4-6.
Wilson, A.G. 1965. Condensation in insulated masonry walls in summer. RILEM/CIB Symposium Moisture Problems in Buildings, Helsinki.