Publisher’s version / Version de l'éditeur:
Vous avez des questions? Nous pouvons vous aider. Pour communiquer directement avec un auteur, consultez la
première page de la revue dans laquelle son article a été publié afin de trouver ses coordonnées. Si vous n’arrivez pas à les repérer, communiquez avec nous à PublicationsArchive-ArchivesPublications@nrc-cnrc.gc.ca.
Questions? Contact the NRC Publications Archive team at
PublicationsArchive-ArchivesPublications@nrc-cnrc.gc.ca. If you wish to email the authors directly, please see the first page of the publication for their contact information.
https://publications-cnrc.canada.ca/fra/droits
L’accès à ce site Web et l’utilisation de son contenu sont assujettis aux conditions présentées dans le site LISEZ CES CONDITIONS ATTENTIVEMENT AVANT D’UTILISER CE SITE WEB.
Technical Report (National Research Council of Canada. Institute for Ocean
Technology); no. TR-2006-21, 2006-09
READ THESE TERMS AND CONDITIONS CAREFULLY BEFORE USING THIS WEBSITE.
https://nrc-publications.canada.ca/eng/copyright
NRC Publications Archive Record / Notice des Archives des publications du CNRC :
https://nrc-publications.canada.ca/eng/view/object/?id=5823af52-348b-4dc6-8fdf-3f826b691770
https://publications-cnrc.canada.ca/fra/voir/objet/?id=5823af52-348b-4dc6-8fdf-3f826b691770
NRC Publications Archive
Archives des publications du CNRC
For the publisher’s version, please access the DOI link below./ Pour consulter la version de l’éditeur, utilisez le lien DOI ci-dessous.
https://doi.org/10.4224/8894923
Access and use of this website and the material on it are subject to the Terms and Conditions set forth at
Thermal protection in life rafts: assessment of occupant heat balance
and development of performance criteria environmental conditions, raft
factors and occupant factors
DOCUMENTATION PAGE
REPORT NUMBERTR-2006-21
NRC REPORT NUMBER DATE
September 2006
REPORT SECURITY CLASSIFICATION
Unclassified
DISTRIBUTION
Unlimited
TITLE
THERMAL PROTECTION IN LIFE RAFTS: ASSESSMENT OF OCCUPANT HEAT
BALANCE AND DEVELOPMENT OF PERFORMANCE CRITERIA
AUTHOR(S)
Mak, L.M. and Kuczora, A.
CORPORATE AUTHOR(S)/PERFORMING AGENCY(S)
Institute for Ocean Technology, National Research Council, St. John’s, NL
PUBLICATION
SPONSORING AGENCY(S)
Transport Canada and National Search and Rescue Secretariat
IOT PROJECT NUMBER
2173
NRC FILE NUMBER KEY WORDS
Thermal protection, life rafts, environmental condition
PAGES iv, 24
App. A-H
FIGS.10
TABLES8
SUMMARYThe thermal protection in life rafts project is aimed to –
1. Assess and propose thermal protection requirements for unprotected life raft
occupants in a ship abandonment situation, where after evacuating into a life
raft, the occupants sit on the floor.
2. Develop and propose standard test methods to evaluate the thermal
protection performance of life rafts.
3. Provide quantitative performance data and practical knowledge to
stakeholders to support operational decision-making and inform the activities
of vessel operators, marine emergency training providers and SAR planners.
The combined impact is to reduce the risk of hypothermia and improve
survivability at sea.
The important environmental conditions, raft factors and occupant factors
determined from literature research are summarized in this report, to enable the
project team to select the range of key variables to study.
ADDRESS
National Research Council
Institute for Ocean Technology
Arctic Avenue, P. O. Box 12093
St. John's, NL A1B 3T5
National Research Council Conseil national de recherches Canada Canada Institute for Ocean Institut des technologies
Technology océaniques
THERMAL PROTECTION IN LIFE RAFTS:
ASSESSMENT OF OCCUPANT HEAT BALANCE
AND
DEVELOPMENT OF PERFORMANCE CRITERIA
ENVIRONMENTAL CONDITION, RAFT FACTORS AND OCCUPANT FACTORS
TR-2006-21
Mak, L.M. and Kuczora, A.
September 2006
Table of Contents
List of Figures ... iv
List of Tables ... iv
1.0 Introduction ...1
2.0 Environmental Condition...1
2.1
Atlantic Region ...2
2.2
Great Lakes...7
2.3
West
Coast
of Canada ...15
3.0 Raft Factors and Occupant Factors ...18
3.1
Raft
Factors...18
3.2
Occupant
Factors ...19
4.0 Conclusions ...19
5.0 Acknowledgements...20
6.0 References ...20
Appendix A: Environmental Data for Newfoundland and Labrador Gulf Gerry Routes
Appendix B: Environmental Data for Newfoundland and Labrador Intra-provincial Ferry
Routes
Appendix C: Environmental Data for Lake Superior
Appendix D: Environmental Data for Lake Erie
Appendix E: Environmental Data for Lake Huron
Appendix F: Environmental Data for Lake Ontario
Appendix G: Environmental Data for Lake Michigan
Appendix H: Environmental Data for British Columbia
List of Figures
Page
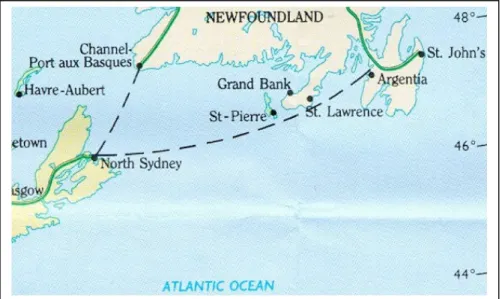
Figure 1. Ferry routes between Newfoundland and North Sydney...2
Figure 2. Ferry routes to St. Pierre et Miquelion ...3
Figure 3. Newfoundland and Labrador intra-provincial ferry routes ...3
Figure 4. MEDS hydrographic data Shediac station ...4
Figure 5. MEDS Area LS21 ...7
Figure 6. Great Lake region ferry routes ...8
Figure 7. Ontario map ...14
Figure 8. West coast ferry route...15
Figure 9. Location (Race Rocks) where sea surface temperature was referenced
...17
Figure 10.Location of National Data Buoy Center, Moored Buoy 46088...17
List of Tables
Page
Table 1. Environment data for Newfoundland and Labrador Gulf ferry routes ....4
Table 2. Environment data for Newfoundland and Labrador intra-provincial ferry
routes
6
Table 3. Environment data for Lake Superior Centre...9
Table 4. Environmental data for Lake Erie...4
Table 5. Environmental data for Lake Huron North...11
Table 6. Environmental data for Lake Ontario ...12
Table 7. Environmental data for Lake Michigan...13
Table 8. Environmental data for British Columbia...16
1
1.0 Introduction
The thermal protection in life rafts project is aimed to –
1. Assess and propose thermal protection requirements for unprotected life raft
occupants in a ship abandonment situation, where after evacuating into a life
raft, the occupants sit on the floor.
2. Develop and propose standard test methods to evaluate the thermal
protection performance of life rafts.
3. Provide quantitative performance data and practical knowledge to
stakeholders to support operational decision-making and inform the activities
of vessel operators, marine emergency training providers and SAR planners.
The combined impact is to reduce the risk of hypothermia and improve
survivability at sea.
The important environmental conditions, raft factors and occupant factors
determined from literature research are summarized in this report, to enable the
project team to select the range of key variables to study.
2.0 Environmental Conditions
Three maritime regions in Canada with major ferry services are examined in this
report –
Atlantic Region
Great Lakes
British Columbia
Most of the environmental data summarized in this report are obtained from the
following sources:
(1) Fisheries and Oceans Canada
(a) Marine Environmental Data Services (MEDS)
(b) Bedford Institute of Oceanography - Oceanographic Databases
(2) Environment Canada
(a) Canadian Climate Normals and Averages 1971-2000.
The MEDS data is available online at http://www.meds-sdmm.dfo-mpo.gc.ca/. Its
databases contain over 6 million observed wave spectra from 500 locations in
Canada. Schock and Tominson (2002) gave a description of the MEDS data.
The Bedford Institute of Oceanography - Oceanographic Databases are available
at
http://www.mar.dfo-mpo.gc.ca/science/ocean/database/data_query.html.
The Environment Canada data is also available online at
http://www.climate.weatheroffice.ec.gc.ca/climate_normals/index_e.html.
These data are supplemented by other published data, wherever necessary.
2
2.1 Atlantic Region
The major ferry routes in this region include -
1. Gulf ferry routes between Argentia, Newfoundland and North Sydney, Nova
Scotia (See Figure 1)
2. Gulf ferry routes between Port aux Basques, Newfoundland and North
Sydney, Nova Scotia (see Figure 1)
3. High speed ferry between Fortune, Newfoundland and St. Pierre et Miquelion
(see Figure 2).
4. Intra-provincial ferry routes to various parts of Newfoundland and Labrador
(see Figure 3)
The MacLaren Plansearch, The East Coast of Canada report, gives a description
of the environmental data for this area.
3
Figure 2. Ferry routes to St. Pierre et Miquelion
4
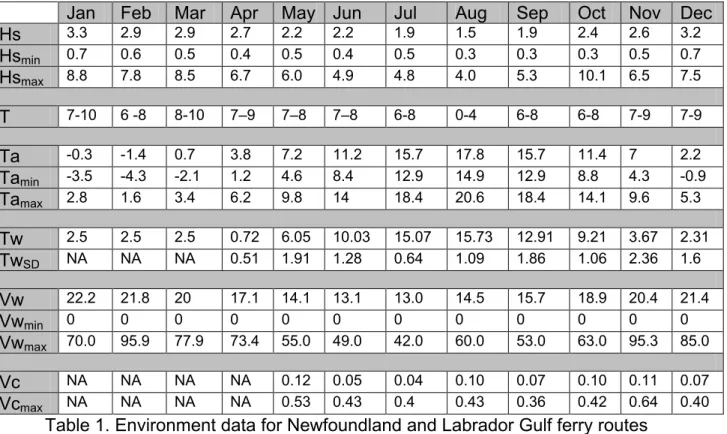
The averaged monthly environmental data for the region where the Gulf ferries
and ferries to St. Pierre et Miquelion operate are shown in Table 1. The
referenced data can be found in Appendix A.
Jan
Feb
Mar
Apr
May Jun
Jul
Aug
Sep
Oct
Nov Dec
Hs
3.3 2.9 2.9 2.7 2.2 2.2 1.9 1.5 1.9 2.4 2.6 3.2Hs
min 0.7 0.6 0.5 0.4 0.5 0.4 0.5 0.3 0.3 0.3 0.5 0.7Hs
max 8.8 7.8 8.5 6.7 6.0 4.9 4.8 4.0 5.3 10.1 6.5 7.5T
7-10 6 -8 8-10 7–9 7–8 7–8 6-8 0-4 6-8 6-8 7-9 7-9Ta
-0.3 -1.4 0.7 3.8 7.2 11.2 15.7 17.8 15.7 11.4 7 2.2Ta
min -3.5 -4.3 -2.1 1.2 4.6 8.4 12.9 14.9 12.9 8.8 4.3 -0.9Ta
max 2.8 1.6 3.4 6.2 9.8 14 18.4 20.6 18.4 14.1 9.6 5.3Tw
2.5 2.5 2.5 0.72 6.05 10.03 15.07 15.73 12.91 9.21 3.67 2.31Tw
SD NA NA NA 0.51 1.91 1.28 0.64 1.09 1.86 1.06 2.36 1.6Vw
22.2 21.8 20 17.1 14.1 13.1 13.0 14.5 15.7 18.9 20.4 21.4Vw
min 0 0 0 0 0 0 0 0 0 0 0 0Vw
max 70.0 95.9 77.9 73.4 55.0 49.0 42.0 60.0 53.0 63.0 95.3 85.0Vc
NA NA NA NA 0.12 0.05 0.04 0.10 0.07 0.10 0.11 0.07Vc
max NA NA NA NA 0.53 0.43 0.4 0.43 0.36 0.42 0.64 0.40Table 1. Environment data for Newfoundland and Labrador Gulf ferry routes
Where
Hs =
Mean significant wave height [m]
Source: Marine Environmental Data Services 2006
T =
Wave period with the highest percentage of occurrence [s]
Source: Marine Environmental Data Services 2006
Ta =
Mean air temperature [C]
Source: The Green Lane, Canadian Climate Normals and Averages
1971-2000, Sable Island, Environment Canada,
Tw =
Mean water surface temperature [C]
Source: Marine Environmental Data Services 2006 Shediac Station (see
Figure 4) and L.D. Mortsch et. al (1985)
Vw = Mean wind speed at 20 m above mean sea level [knots]
Source: Marine Environmental Data Services 2006
Vc =
Mean surface current speed [m/s]
5
The geographic location of Shediac Station, where the mean water surface
temperature was referenced is shown in Figure 4.
Figure 4. MEDS hydrographic data Shediac station
The averaged monthly environmental data for the region where the
intra-provincial ferries operate are shown in Table 2. The ferry routes cover two
environmental regions, Labrador Coast and North East Coast of Newfoundland.
For the purpose of this report, Labrador Coast region data is used since it has
more severe survival weather condition. The referenced data can be found in
Appendix B.
6
Jan
Feb
Mar
Apr
May Jun
Jul
Aug
Sep
Oct
Nov Dec
Hs
NA NA NA NA NA 1.3 1.3 1.5 2.1 2.9 2.9 NAHs
min NA NA NA NA NA 0.7 0.2 0.4 0.3 0.5 0.8 NAHs
max NA NA NA NA NA 2.3 5.5 5.7 7.3 9.4 7.1 NAT
NA NA NA NA NA 5-7 5-9 5-9 7-9 8-9 8-9 NATa
-18.5 -18.3 -12.3 -4.9 1 6.2 10.1 10.7 7 1.1 -5.1 -12.8Ta
min -23.1 -22.9 -17.3 -9.5 -3 1.4 5.2 5.7 3 -2.1 -8.3 -16.8Ta
max -14 -13.6 -7.3 -0.3 5.1 11 15.1 15.6 10.9 4.2 -1.8 -8.8Tw
-0.12 0.66 0.55 -1.5 2.22 1.61 4.42 5.12 3.92 2.24 0.89 -0.48Tw
SD 1.3 2.55 2.19 0 1.27 1.03 2.34 1.65 1.4 1.24 1.5 0.7Vw
22.6 22.0 19.4 15.9 12.4 13.6 14.6 16.6 17.1 20.8 20.4 23Vw
min 0 0 0 0 0 0 0 0 0 0 0 0Vw
max 90 74 70 60 41 54 50 64 78 74 74 80Vc
NA NA NA NA NA NA 0.43 0.45 0.35 0.38 NA NAVc
max NA NA NA NA NA NA 0.82 0.85 0.80 0.76 NA NATable 2. Environment data for Newfoundland and Labrador intra-provincial ferry
routes.
Where
Hs =
Mean significant wave height [m]
Source: Marine Environmental Data Services 2006
T =
Wave period with the highest percentage of occurrence [s]
Source: Marine Environmental Data Services 2006
Ta =
Mean air temperature [C]
Source: The Green Lane, Canadian Climate Normals and Averages
1971-2000, Nain A, Environment Canada,
Tw =
Mean water surface temperature [C]
Source: Bedford Institute of Oceanography - Oceanographic Databases
Area LS21 and L.D. Mortsch et. al (1985)
Vw = Mean wind speed at 20 m above mean sea level [knots]
Source: Marine Environmental Data Services 2006
Vc =
Mean surface current speed [m/s]
7
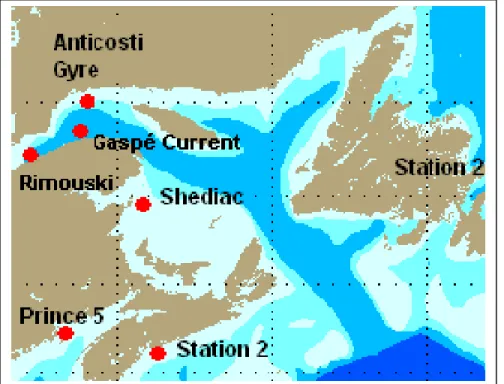
The geographic location where the mean water surface temperature was
referenced is shown in Figure 5.
Figure 5. MEDS Area LS21
2.2 Great Lakes
The main ferry routes in Great Lakes region include those in Lake Superior, Lake
Erie, Lake Ontario, Lake Huron and Lake Michigan (see Figure 6). The MacLaren
Plansearch, The Great Lakes report gives a description of the environmental
data for this region.
8
Figure 6. Great Lake region ferry routes
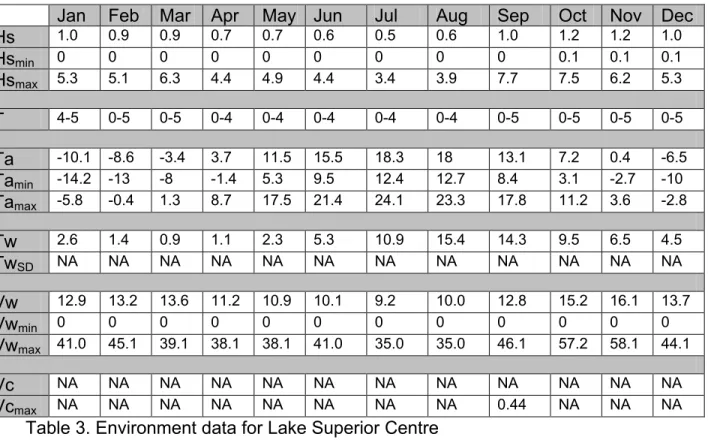
The averaged monthly environmental data for Lake Superior Centre is shown in
Table 3. The environment data for Lake Superior is divided into three regions –
west, centre and east. The referenced data for all three regions can be found in
Appendix C.
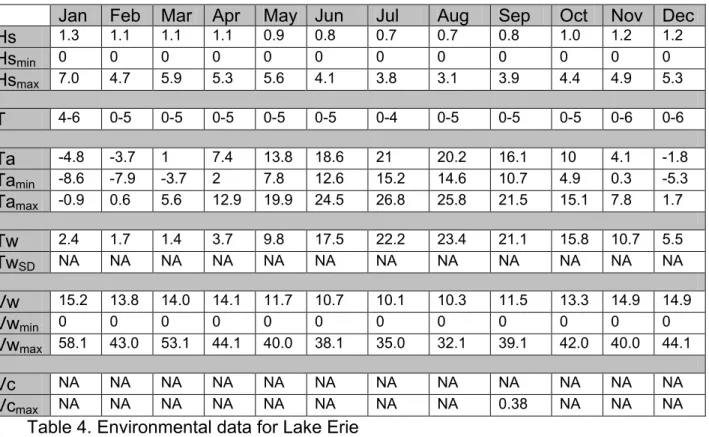
The averaged monthly environmental data for Lake Erie is shown in Table 4. The
reference data for all three regions can be found in Appendix D.
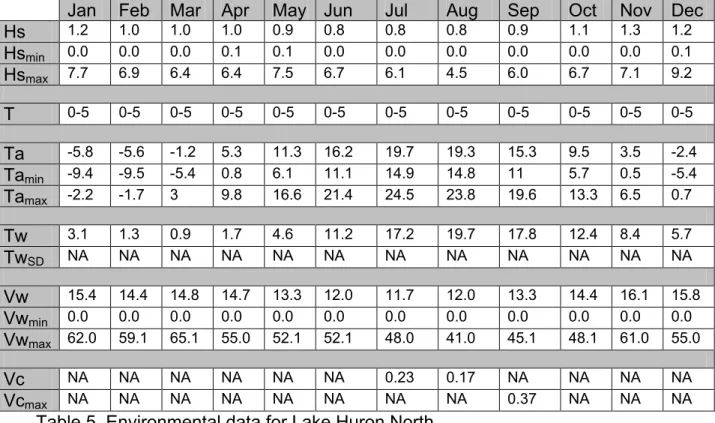
The averaged monthly environmental data for Lake Huron North is shown in
Table 5. The environment data for Lake Huron is divided into two regions – north
and south. The referenced data for all two regions can be found in Appendix E.
The averaged monthly environmental data for Lake Ontario is shown in Table 6.
The referenced can be found in Appendix F.
The averaged monthly environmental data for Lake Michigan is shown in
Table 7. The referenced data can be found in Appendix G.
9
Jan
Feb Mar Apr
May Jun
Jul
Aug
Sep
Oct
Nov Dec
Hs
1.0 0.9 0.9 0.7 0.7 0.6 0.5 0.6 1.0 1.2 1.2 1.0Hs
min 0 0 0 0 0 0 0 0 0 0.1 0.1 0.1Hs
max 5.3 5.1 6.3 4.4 4.9 4.4 3.4 3.9 7.7 7.5 6.2 5.3T
4-5 0-5 0-5 0-4 0-4 0-4 0-4 0-4 0-5 0-5 0-5 0-5Ta
-10.1 -8.6 -3.4 3.7 11.5 15.5 18.3 18 13.1 7.2 0.4 -6.5Ta
min -14.2 -13 -8 -1.4 5.3 9.5 12.4 12.7 8.4 3.1 -2.7 -10Ta
max -5.8 -0.4 1.3 8.7 17.5 21.4 24.1 23.3 17.8 11.2 3.6 -2.8Tw
2.6 1.4 0.9 1.1 2.3 5.3 10.9 15.4 14.3 9.5 6.5 4.5Tw
SD NA NA NA NA NA NA NA NA NA NA NA NAVw
12.9 13.2 13.6 11.2 10.9 10.1 9.2 10.0 12.8 15.2 16.1 13.7Vw
min 0 0 0 0 0 0 0 0 0 0 0 0Vw
max 41.0 45.1 39.1 38.1 38.1 41.0 35.0 35.0 46.1 57.2 58.1 44.1Vc
NA NA NA NA NA NA NA NA NA NA NA NAVc
max NA NA NA NA NA NA NA NA 0.44 NA NA NATable 3. Environment data for Lake Superior Centre
Where
Hs =
Mean significant wave height [m]
Source: Marine Environmental Data Services 2006
T =
Wave period with the highest percentage of occurrence [s]
Source: Marine Environmental Data Services 2006
Ta =
Mean air temperature [C]
Source: The Green Lane, Canadian Climate Normals and Averages
1971-2000, Sault Saint Marie, Environment Canada,
Tw =
Mean water surface temperature [C]
Source: National Oceanic and Atmospheric Administration, CoastWatch
Great Lakes Node.
Vw = Mean wind speed at 20 m above mean sea level [knots]
Source: Marine Environmental Data Services 2006
Vc =
Mean surface current speed [m/s]
10
Jan
Feb Mar Apr
May Jun
Jul
Aug
Sep
Oct
Nov Dec
Hs
1.3 1.1 1.1 1.1 0.9 0.8 0.7 0.7 0.8 1.0 1.2 1.2Hs
min 0 0 0 0 0 0 0 0 0 0 0 0Hs
max 7.0 4.7 5.9 5.3 5.6 4.1 3.8 3.1 3.9 4.4 4.9 5.3T
4-6 0-5 0-5 0-5 0-5 0-5 0-4 0-5 0-5 0-5 0-6 0-6Ta
-4.8 -3.7 1 7.4 13.8 18.6 21 20.2 16.1 10 4.1 -1.8Ta
min -8.6 -7.9 -3.7 2 7.8 12.6 15.2 14.6 10.7 4.9 0.3 -5.3Ta
max -0.9 0.6 5.6 12.9 19.9 24.5 26.8 25.8 21.5 15.1 7.8 1.7Tw
2.4 1.7 1.4 3.7 9.8 17.5 22.2 23.4 21.1 15.8 10.7 5.5Tw
SD NA NA NA NA NA NA NA NA NA NA NA NAVw
15.2 13.8 14.0 14.1 11.7 10.7 10.1 10.3 11.5 13.3 14.9 14.9Vw
min 0 0 0 0 0 0 0 0 0 0 0 0Vw
max 58.1 43.0 53.1 44.1 40.0 38.1 35.0 32.1 39.1 42.0 40.0 44.1Vc
NA NA NA NA NA NA NA NA NA NA NA NAVc
max NA NA NA NA NA NA NA NA 0.38 NA NA NATable 4. Environmental data for Lake Erie
Where
Hs =
Mean significant wave height [m]
Source: Marine Environmental Data Services 2006
T =
Wave period with the highest percentage of occurrence [s]
Source: Marine Environmental Data Services 2006
Ta =
Mean air temperature [C]
Source: The Green Lane, Canadian Climate Normals and Averages
1971-2000, St. Thomas, Environment Canada,
Tw =
Mean water surface temperature [C]
Source: National Oceanic and Atmospheric Administration, CoastWatch
Great Lakes Node.
Vw = Mean wind speed at 20 m above mean sea level [knots]
Source: Marine Environmental Data Services 2006
Vc =
Mean surface current speed [m/s]
11
Jan
Feb Mar Apr
May Jun
Jul
Aug
Sep
Oct
Nov Dec
Hs
1.2 1.0 1.0 1.0 0.9 0.8 0.8 0.8 0.9 1.1 1.3 1.2Hs
min 0.0 0.0 0.0 0.1 0.1 0.0 0.0 0.0 0.0 0.0 0.0 0.1Hs
max 7.7 6.9 6.4 6.4 7.5 6.7 6.1 4.5 6.0 6.7 7.1 9.2T
0-5 0-5 0-5 0-5 0-5 0-5 0-5 0-5 0-5 0-5 0-5 0-5Ta
-5.8 -5.6 -1.2 5.3 11.3 16.2 19.7 19.3 15.3 9.5 3.5 -2.4Ta
min -9.4 -9.5 -5.4 0.8 6.1 11.1 14.9 14.8 11 5.7 0.5 -5.4Ta
max -2.2 -1.7 3 9.8 16.6 21.4 24.5 23.8 19.6 13.3 6.5 0.7Tw
3.1 1.3 0.9 1.7 4.6 11.2 17.2 19.7 17.8 12.4 8.4 5.7Tw
SD NA NA NA NA NA NA NA NA NA NA NA NAVw
15.4 14.4 14.8 14.7 13.3 12.0 11.7 12.0 13.3 14.4 16.1 15.8Vw
min 0.0 0.0 0.0 0.0 0.0 0.0 0.0 0.0 0.0 0.0 0.0 0.0Vw
max 62.0 59.1 65.1 55.0 52.1 52.1 48.0 41.0 45.1 48.1 61.0 55.0Vc
NA NA NA NA NA NA 0.23 0.17 NA NA NA NAVc
max NA NA NA NA NA NA NA NA 0.37 NA NA NATable 5. Environmental data for Lake Huron North
Where
Hs =
Mean significant wave height [m]
Source: Marine Environmental Data Services 2006
T =
Wave period with the highest percentage of occurrence [s]
Source: Marine Environmental Data Services 2006
Ta =
Mean air temperature [C]
Source: The Green Lane, Canadian Climate Normals and Averages
1971-2000, Owen Sound, Environment Canada,
Tw =
Mean water surface temperature [C]
Source: National Oceanic and Atmospheric Administration, CoastWatch
Great Lakes Node.
Vw = Mean wind speed at 20 m above mean sea level [knots]
Source: Marine Environmental Data Services 2006
Vc =
Mean surface current speed [m/s]
Source: National Oceanic and Atmospheric Administration and Great
Lakes Coastal Forecasting System, GLCFS NOWCAST
12
Jan
Feb Mar Apr
May Jun
Jul
Aug
Sep
Oct
Nov Dec
Hs
0.6 0.5 0.5 0.4 0.3 0.3 0.3 0.3 0.3 0.4 0.5 0.5Hs
min 0.0 0.0 0.0 0.0 0.0 0.0 0.0 0.0 0.0 0.0 0.0 0.0Hs
max 4.9 7.1 5.1 5.3 3.6 3.0 2.9 2.4 2.9 4.0 4.9 4.5T
0-4 0-4 0-4 0-4 0-4 0-4 0-4 0-4 0-4 0-4 0-4 0-4Ta
-7.1 -5.9 -0.6 6.7 13.7 18.7 21.6 20.6 15.9 9.3 3.2 -3.5Ta
min -11.5 -10.3 -5 2 8.7 13.7 16.6 15.7 11.3 5.1 -0.2 -7.3Ta
max -2.6 -1.4 3.8 11.4 18.7 23.6 26.6 25.4 20.4 13.5 6.7 0.4Tw
3.3 1.9 1.7 2.6 6.1 13.8 19.5 21.8 19.3 13.4 8.6 5.5Tw
SD NA NA NA NA NA NA NA NA NA NA NA NAVw
9.6 9.0 8.8 8.4 6.8 6.0 5.9 5.8 6.7 7.9 9.4 9.5Vw
min 0.0 0.0 0.0 0.0 0.0 0.0 0.0 0.0 0.0 0.0 0.0 0.0Vw
max 52.1 45.1 44.1 49.0 36.0 34.0 32.1 41.0 38.0 39.1 48.0 42.0Vc
NA NA NA NA NA NA NA NA NA NA NA NAVc
max NA NA NA NA NA NA NA NA 0.40 NA NA NATable 6. Environmental data for Lake Ontario
Where
Hs =
Mean significant wave height [m]
Source: Marine Environmental Data Services 2006
T =
Wave period with the highest percentage of occurrence [s]
Source: Marine Environmental Data Services 2006
Ta =
Mean air temperature [C]
Source: The Green Lane, Canadian Climate Normals and Averages
1971-2000, Belleville, Environment Canada,
Tw =
Mean water surface temperature [C]
Source: National Oceanic and Atmospheric Administration, CoastWatch
Great Lakes Node.
Vw = Mean wind speed at 20 m above mean sea level [knots]
Source: Marine Environmental Data Services 2006
Vc =
Mean surface current speed [m/s]
13
Jan
Feb Mar Apr
May Jun
Jul
Aug
Sep
Oct
Nov Dec
Hs
1.2 1.1 0.9 0.7 0.5 0.5 0.5 0.6 0.7 0.9 1.1 1.2Hs
min 0.1 0.1 0.1 0.0 0.0 0.0 0.0 0.0 0.0 0.1 0.1 0.1Hs
max 7.2 6.1 11.4 4.8 3.4 3.0 2.7 3.3 5.0 4.7 5.5 6.0T
4-5 0-5 0-4 0-4 0-4 0-4 0-4 0-4 0-4 0-4 0-5 4-5Ta
-6.3 -3.7 1.61 7.3 13.4 19.1 22.2 21.4 17.2 10.8 3.6 -3.2Ta
min -10.3 -7.6 -2.6 2.4 7.8 13.5 17.2 16.7 12.3 5.9 -0.6 -7Ta
max -2.2 0.3 5.9 12.2 18.9 24.6 27.3 26.2 22.2 15.7 7.6 0.6Tw
3.1 1.7 1.6 2.5 5.5 12.3 18.7 20.9 18.8 13.2 8.9 5.6Tw
SD NA NA NA NA NA NA NA NA NA NA NA NAVw
15.1 14.1 12.9 11.2 9.3 8.4 8.2 9.2 10.8 12.1 14.3 14.9Vw
min 1.0 1.9 1.0 0.0 1.0 0.0 1.0 0.0 0.0 1.0 1.9 1.9Vw
max 54.0 49.0 46.1 41.0 31.1 27.0 31.1 32.1 40.0 39.1 47.0 44.1Vc
NA NA NA NA NA NA NA NA NA NA NA NAVc
max NA NA NA NA NA NA NA NA 0.55 NA NA NATable 7. Environmental data for Lake Michigan
Where
Hs =
Mean significant wave height [m]
Source: Marine Environmental Data Services 2006
T =
Wave period with the highest percentage of occurrence [s]
Source: Marine Environmental Data Services 2006
Ta =
Mean air temperature [C]
Source: The Green Lane, Canadian Climate Normals and Averages
1971-2000, Milwaukee, Environment Canada,
Tw =
Mean water surface temperature [C]
Source: National Oceanic and Atmospheric Administration, CoastWatch
Great Lakes Node.
Vw = Mean wind speed at 20 m above mean sea level [knots]
Source: Marine Environmental Data Services 2006
Vc =
Mean surface current speed [m/s]
14
A map showing the cities (Sault Ste Marie, Owen Sound, St. Thomas, Belleville
and Milwaukee) where the average air temperature was reference is in Figure 7.
15
2.3 West Coast of Canada
The major ferry routes in this region are shown in Figure 8. The MacLaren
Plansearch, The West Coast of Canada report gives a description of the
environmental data for this region.
Figure 8. West coast ferry route
The averaged monthly environmental data for British Columbia is shown in
Table 8. The referenced data for this region can be found in Appendix H.
16
Jan
Feb Mar Apr
May Jun
Jul
Aug
Sep
Oct
Nov Dec
Hs
3.8 3.5 2.9 2.8 2.2 1.9 1.5 1.6 2.0 2.9 3.9 4.0Hs
min 0.9 0.8 1.0 0.8 0.5 0.6 0.5 0.5 0.5 0.5 0.2 0.9Hs
max 11.2 10.5 9.8 7.8 6.4 5.5 4.2 4.7 5.7 11.0 12.8 11.3T
12-13 11-13 9-13 9-13 9-11 9-11 6-10 7-10 9-11 9-13 9-13 9-13Ta
4.4 5.5 6.6 8.2 10.5 12.4 14 14.3 13 9.6 6.5 4.6Ta
min 1.8 2.5 3.1 4.4 6.8 8.7 9.8 10.1 8.8 6.1 3.8 2.1Ta
max 7 8.4 10.1 12 14.1 16.1 18.1 18.5 17.2 13.1 9.2 7Tw
6.9 7.0 7.8 9.2 11.2 13.5 15.5 15.8 13.9 11.1 8.9 7.5Tw
SD 0.84 0.76 0.74 0.76 0.71 0.85 0.94 1.29 1.07 0.71 0.73 0.71Vw
21.2 19.4 16.4 15.7 14.2 11.9 12.2 12.7 13.2 17.8 22.0 21.4Vw
min 1.8 1.3 0.5 0.2 0.4 0.0 0.3 0.0 0.7 0.9 3.4 0.4Vw
max 46.4 47.7 47.5 45.3 33.4 34.5 27.4 40.5 39.0 50.5 52.9 49.9Vc
NA NA NA NA NA NA 0.43 0.39 NA NA NA NAVc
max NA NA NA NA NA NA NA NA NA NA NA NATable 8. Environmental data for British Columbia
Where
Hs =
Mean significant wave height [m]
Source: Marine Environmental Data Services 2006
T =
Wave period with the highest percentage of occurrence [s]
Source: Marine Environmental Data Services 2006
Ta =
Mean air temperature [C]
Source: The Green Lane, Canadian Climate Normals and Averages
1971-2000, Milwaukee, Environment Canada,
Tw =
Mean water surface temperature [C]
Source: Marine Environmental Data Services 2006 near Race Rocks
Vw = Mean wind speed at 20 m above mean sea level [knots]
Source: Marine Environmental Data Services 2006
Vc =
Mean surface current speed [m/s]
Source: National Oceanic and Atmospheric Administration, National Data
Buoy Center, Northwest Straits / Puget Sound Recent Marine Data.
The location where mean water surface temperature was obtained was at
latitude 48° 31'N and longitude 123° 10'W, near Race Rocks (see Figure 9). The
current was obtained near the same location using National Data Buoy Center,
Moored Buoy 46088 (see Figure 10).
17
Figure 9. Location (Race Rocks) where sea surface temperature was referenced
18
3.0 Raft Factors and Occupant Factors
The following life raft variables and occupant variables are intended to be
studied, in order to understand the heat loss mechanisms and their relative
effects.
3.1 Raft Factors
Floor wetness
The floor of a life raft is typically wet in an evacuation situation due to wave
spray. Occupants sitting or lying on the wet floor are likely to experience
increased heat loss from direct contact with the cold ocean water and wet
clothing.
Floor insulation
Typical life raft construction consists of either an air-filled inflatable floor or a
non-inflatable floor. With the former, occupants are required to inflate the floor when
they enter the life raft. These forms of insulation provide a thermal barrier
between the occupant and the cold ocean water when they sit or lie on the floor.
CORD studied the thermal performance of an arctic life raft with occupants
wearing an immersion suit. They reported that canopy and direct contact are the
most significant means of heat loss.
Canopy entrance
The canopy entrance can be opened, closed or partially opened. With a closed
canopy entrance, the heat produced by the occupants may help to slow down the
cooling of the life raft internal environment. However, it would reduce ventilation
and thus air quality. With a partially or fully opened canopy entrance, the heat
produced by the occupants may be lost to the environment. CORD reported that
the canopy is the area of largest heat loss. Improvement with canopy will have
the greatest effect on the raft temperature. Any warming effect from occupants is
lost if the raft is not insulated. Wind speed has significant effect on raft thermal
resistance. Other factors such as wind direction, number of occupants and
occupant position has little effect.
19
3.2 Occupant Factors
Clothing
In a ferry evacuation situation, life raft occupants will only be wearing ordinary
clothing and life jackets. The clothing provides little, if any, protection against
wetness and heat loss. In contrast, in an offshore evacuation situation, occupants
will be wearing immersion suits. They provide protection against wetness and a
higher degree of protection against heat loss.
Direct contact area
The occupant, if not injured and in sufficiently good condition, will be sitting inside
the life raft. The direct contact area will be the buttock and the back. If injured or
in poor condition, the occupant will likely be lying on the floor on his back. The
direct contact areas include heat, back, buttock and limbs.
4.0 Conclusions
The environmental conditions for three maritime regions in Canada,
Newfoundland and Labrador, Great Lakes and British Columbia, with major ferry
services are summarized in this report. Also, the main life raft and occupant
variables that would contribute to variation in heat loss are discussed.
The most severe wave condition is found in Newfoundland and Labrador and
British Columbia, where the mean significant wave height is above 3 m. The
wave period is typically higher in British Columbia, ranging from 9 to13 seconds
as compared to 6 to 9 seconds in Newfoundland and Labrador. The mildest wave
condition is found in the Great Lakes.
The coldest mean air temperature is found in Newfoundland and Labrador,
where it can be as low as -18 C. The highest mean air temperature is found in
the Great Lakes, around 21 C.
The lowest mean water surface temperature is found in Newfoundland and
Labrador, around -1.5 C. The highest mean water surface temperature is found
in the Great Lakes, around 23 C.
The highest mean wind velocity, around 23 knots (or 11.5 m/s), is found in
Newfoundland and Labrador and British Columbia.
20
The highest mean current velocity is found in Newfoundland and Labrador and
British Columbia, around 0.45 m/s.
5.0 Acknowledgements
The project team would like to thank National Search and Rescue Secretariat
SAR New Initiatives Fund for their financial support on this project, and Transport
Canada for sponsoring this project.
6.0 References
1. Marine Environmental Data Service,
http://www.meds-sdmm.dfo-mpo.gc.ca/, accessed August to September, 2006
2. The Green Lane, Canadian Climate Normals or Averages 1971-2000,
Environment Canada. Updated April 18, 2006
http://www.climate.weatheroffice.ec.gc.ca/climate_normals/index_e.html,
accessed August to September, 2006
3. Great Lakes CoastWatch Node, National Oceanic and Atmospheric
Administration. Updated May 17, 2006 http://coastwatch.glerl.noaa.gov,
accessed August to September, 2006
4. Great Lakes Coastal Forecasting System, GLCFS NOWCAST, National
Oceanic and Atmospheric Administration. Updated Sept 15, 2006 at 1800
GMT http://www.glerl.noaa.gov/res/glcfs/, accessed Sept 15, 2006
5. National Oceanic and Atmospheric Administration, National Data Buoy
Center, Northwest Straits / Puget Sound Recent Marine Data. Updated
May 18, 2006 http://www.ndbc.noaa.gov/maps/NW_Straits_Sound.shtml,
accessed August to September, 2006
6. Mortsch, L.D. et al. (1985), Marine Climatological Atlas – Canadian East
Coast, Canadian Climate Centre, Report No. 85-11
7. Schock, C and Tominson, S (2002), Marine Environmental Data Service
Report for 2002, Marine Environmental Data Service (MEDS), Department
of Fisheries and Oceans.
8. MacLaren Plansearch Limited (1991), Wind and Wave Climate Atlas,
Volume I, The East Coast of Canada, Prepared for Transportation
Development Centre Policy and Coordination Group, Transport Canada,
TP 10820 E.
21
9. MacLaren Plansearch Limited (1991), Wind and Wave Climate Atlas,
Volume III, The Great Lakes, Prepared for Transportation Development
Centre Policy and Coordination Group, Transport Canada, TP 10820 E.
10. MacLaren Plansearch Limited (1991), Wind and Wave Climate Atlas,
Volume IV, The West Coast of Canada, Prepared for Transportation
Development Centre Policy and Coordination Group, Transport Canada,
TP 10820 E.
11. The CORD Group Limited (1990), The Design, Construction and Testing
of an Insulated Liferaft, Prepared for Equipment and Operational Ship
Safety Branch, Canadian Coast Guard.
Appendix A
Environmental Data
For
http://www.meds-sdmm.dfo-mpo.gc.ca/alphapro/wave/TDCAtlas/TDCP...
http://www.meds-sdmm.dfo-mpo.gc.ca/alphapro/wave/TDCAtlas/TDCP...
http://www.meds-sdmm.dfo-mpo.gc.ca/alphapro/wave/TDCAtlas/TDCP...
http://www.meds-sdmm.dfo-mpo.gc.ca/alphapro/wave/TDCAtlas/TDCP...
Canadian Climate Normals 1971-2000 http://www.climate.weatheroffice.ec.gc.ca/climate_normals/results_e.htm...
1 of 1 16/08/2006 12:31 PM
Temperature: Jan Feb Mar Apr May Jun Jul Aug Sep Oct Nov Dec Year Code
Daily Average (°C) -0.3 -1.4 0.7 3.8 7.2 11.2 15.7 17.8 15.7 11.4 7 2.2 7.6 B Standard Deviation 1.2 1.2 1 1 1.2 0.9 1 0.9 0.9 0.8 1 1.4 1.5 B Daily Maximum (°C) 2.8 1.6 3.4 6.2 9.8 14 18.4 20.6 18.4 14.1 9.6 5.3 10.3 B Daily Minimum (°C) -3.5 -4.3 -2.1 1.2 4.6 8.4 12.9 14.9 12.9 8.8 4.3 -0.9 4.8 B Extreme Maximum (°C) 14.5 12.8 13.7 13.9 17.8 21.7 29.6 27.8 27 22.8 18.9 15.6 Date (yyyy/dd) 1983/12 1919/16 1993/14 1901/22+ 1931/30 1907/29 1986/24 1951/27 1983/07 1961/04 1921/01+ 1968/05 Extreme Minimum (°C) -19.4 -18.3 -13.6 -8.9 -8.3 0.6 3 4.4 0.6 -1.2 -7.8 -16.7 Date (yyyy/dd) 1920/31 1914/12 1994/03 1916/15 1914/03 1992/04 1991/05 1987/28 1980/29 1984/14+ 1921/25+ 1933/29 Precipitation: Rainfall (mm) 113.3 82.8 102.9 99.9 99.5 117.3 95.2 106.8 119 140.3 142.8 124 B Snowfall (cm) 32.9 27.9 20.2 7.1 0.4 0 0 0 0 0 3.8 18.9 B Precipitation (mm) 146.4 110.9 124 107.1 99.9 117.3 95.2 106.8 119 140.3 147 145.3 B
Average Snow Depth (cm) 2 2 1 0 0 0 0 0 0 0 0 0 0 B
Median Snow Depth (cm) 0 1 0 0 0 0 0 0 0 0 0 0 0 B
Snow Depth at Month-end (cm) 2 3 0 0 0 0 0 0 0 0 0 1 B
Extreme Daily Rainfall (mm) 99.3 52.2 87.6 66 99.6 140.7 85.3 155.7 99.2 166.1 84.8 77.5
Date (yyyy/dd) 1894/30 1989/23 1899/07 1897/11 1969/23 1919/12 1895/10 1892/21 1982/17 1950/04 1927/06 1964/18
Extreme Daily Snowfall (cm) 61 45.7 45.7 27.4 15.2 0 0 0 0 0.2 25.4 66
Date (yyyy/dd) 1897/24 1892/04 1959/28 1992/06 1959/24 1891/01+ 1891/01+ 1891/01+ 1891/01+ 1985/29 1955/26 1934/11
Extreme Daily Precipitation (mm) 99.3 53.3 87.6 66 99.6 140.7 85.3 155.7 99.2 166.1 84.8 78.2
Date (yyyy/dd) 1894/30 1892/04 1899/07 1897/11 1969/23 1919/12 1895/10 1892/21 1982/17 1950/04 1927/06 1964/18
Extreme Snow Depth (cm) 60 41 25 24 3 0 0 0 0 0 25 20
Date (yyyy/dd) 1989/05 1971/24 1955/05+ 1992/06 1959/25 1955/01+ 1955/01+ 1955/01+ 1955/01+ 1955/01+ 1955/27 1993/24
Days with Maximum Temperature:
<= 0 °C 8.4 9.7 5 0.04 0 0 0 0 0 0 0.08 3.6 B > 0 °C 22.6 18.6 26 30 31 30 31 31 30 31 29.9 27.4 B > 10 °C 1.2 0.27 0.42 2.2 14.6 28.3 31 31 30 27.6 14.3 4.5 B > 20 °C 0 0 0 0 0 0.17 6.3 18.6 6.9 0.2 0 0 B > 30 °C 0 0 0 0 0 0 0 0 0 0 0 0 B > 35 °C 0 0 0 0 0 0 0 0 0 0 0 0 B
Days with Minimum Temperature:
> 0 °C 6.5 3.4 8.3 20.7 30.4 30 31 31 30 30.6 27 12.8 B <= 2 °C 28.3 27.3 28.5 19.5 3.6 0.04 0 0 0.08 0.88 8.1 24 B <= 0 °C 24.5 24.9 22.7 9.3 0.56 0 0 0 0 0.4 3 18.2 B < -2 °C 19.1 19.6 14 2 0.08 0 0 0 0 0 0.8 11.8 B < -10 °C 1.7 2.6 0.42 0 0 0 0 0 0 0 0 0.44 B < -20 °C 0 0 0 0 0 0 0 0 0 0 0 0 B < - 30 °C 0 0 0 0 0 0 0 0 0 0 0 0 B
Days with Rainfall:
>= 0.2 mm 11.9 9.2 12.6 14.4 14.2 13.4 12.8 11.5 12.6 15.5 17.7 15.3 B
>= 5 mm 7 5.2 6.4 6.4 5.6 6.3 4.8 5 5.6 6.2 7.7 7 B
>= 10 mm 4.5 3 4 3.6 3.4 4 3.1 3.4 3.6 4.3 4.8 4.4 B
>= 25 mm 0.81 0.65 0.62 0.64 0.96 1.2 0.79 0.96 1.2 1.8 1.4 1.1 B
Canadian Climate Normals 1971-2000
The minimum number of years used to calculate these Normals is indicated by a code for each element. A "+" beside an extreme date indicates that this date is the first occurrence of the extreme value. Values and dates in bold indicate all-time extremes for the location.
NOTE!! Data used in the calculation of these Normals may be subject to further quality assurance checks. This
may result in minor changes to some values presented here.
SABLE ISLAND
NOVA SCOTIA
Latitude: 43° 55' N Longitude: 60° 0' W Elevation: 05.00 m
Shediac Temperature Data 1971-2000 http://www.meds-sdmm.dfo-mpo.gc.ca/alphapro/zmp/stationclimat/SHE...
1 of 1 16/08/2006 12:23 PM
Shediac - Temperature (Cº)
Mean, Standard Deviation and Number of Observations
January
February
March
April
May
June
Depth
(m)
Mean S.D. #Obs Mean S.D. #Obs Mean S.D. #Obs Mean S.D. #Obs Mean S.D. #Obs Mean S.D. #Obs
0
-
-
-
-
-
-
-
-
-
0.72 0.51
12
6.05 1.91
18
10.03 1.28
19
10
-
-
-
-
-
-
-1.6
0
1
0.43 0.37
12
4.72 1.54
10
8.56 1.69
17
20
-
-
-
-
-
-
-
-
-
0.14 0.56
11
3.12 1.19
9
5.4
1.97
16
30
-
-
-
-
-
-
-
-
-
-0.35 0.82
10
1.58
0.9
10
2.59 0.68
15
40
-
-
-
-
-
-
-
-
-
-0.6 0.54
10
0.86 0.55
8
1.12 0.49
15
50
-
-
-
-
-
-
-
-
-
-0.62 0.43
10
0.18
0.6
9
-0.07 0.91
15
60
-
-
-
-
-
-
-
-
-
-0.48 0.34
9
-0.11 0.8
4
-0.46 0.56
14
70
-
-
-
-
-
-
-
-
-
-0.27 0.2
9
-0.03 0.56
8
-0.45 0.49
14
80
-
-
-
-
-
-
-
-
-
-0.18 0.17
9
-0.07 0.5
6
-0.26 0.45
6
90
-
-
-
-
-
-
-
-
-
-
-
-
-0.01
0
2
-0.9
0
1
100
-
-
-
-
-
-
-
-
-
-
-
-
-
-
-
-
-
-
July
August
September
October
November
December
Depth
(m)
Mean S.D. #Obs Mean S.D. #Obs Mean S.D. #Obs Mean S.D. #Obs Mean S.D. #Obs Mean S.D. #Obs
0
15.07 0.64
12
15.73 1.09
12
12.91 1.86
45
9.21 1.06
24
3.67 2.36
5
2.31
1.6
12
10
13.77 1.28
12
14.24 1.23
7
12.14 2.3
39
9.32 1.33
18
3.67 2.36
5
2.31 1.59
14
20
6.63 1.67
12
10.76 1.56
7
10.03 2.78
41
8.97 0.57
16
3.6
2.32
5
2.24 1.51
14
30
3.01 0.84
12
5.9
2.16
7
6.39 3.12
41
7.73 1.03
19
3.5
2.27
4
2.23 1.43
14
40
1.08 0.53
11
2.56 1.61
7
3.35 2.71
38
5.73 1.54
17
3.67 2.37
4
2.37 1.38
14
50
0.32 0.54
11
1.13 0.65
7
1.67
2
39
3.24 2.02
19
3.16 1.36
4
2.65 1.24
14
60
-0.04 0.4
11
0.59
0.2
6
0.76 1.09
37
1.56 1.36
18
2.41 0.71
4
2.9
1.2
14
70
-0.24 0.12
11
0.23 0.28
6
0.23 0.48
33
0.91 0.72
19
1.78 0.61
4
2.64 0.61
12
80
-0.32 0.01
3
0.1
0.11
4
0.33 0.44
19
0.62 0.45
7
1.7
0.94
3
2.4
0
2
90
-
-
-
0.2
0
1
0.59 1.05
4
-
-
-
-
-
-
-
-
-
100
-
-
-
-
-
-
-0.02 0.12
3
-
-
-
-
-
-
-
-
-Back to:
Station Page
http://www.meds-sdmm.dfo-mpo.gc.ca/alphapro/wave/TDCAtlas/TDCP...
Department of Fisheries and Oceans -Ocean Sciences Ocean Data Inventory
03-Aug-2006 14:57
1434 Query:
Latitude Longitude Date Days Max Speed m/s Mean Speed m/s Current Dir
T Major m/s Minorm/s DirT Major m/s Minorm/s DirT Moor
Depth M
Mid Freq Var Low Freq Var QC Event Spec
45 N 57 W - -MAY1997 29 0.528 0.118 130 0.125 0.092 318 0.081 0.041 325 1 45 4.9 N 57 34.73 W 18 MCM_97003_1254_7134_1800 JUN1997 30 0.430 0.051 184 0.141 0.102 326 0.097 0.023 336 1 JUL1997 31 0.400 0.044 141 0.101 0.092 306 0.036 0.026 342 1 AUG1997 31 0.430 0.097 136 0.102 0.085 303 0.033 0.017 332 1 SEP1997 30 0.360 0.070 134 0.099 0.083 307 0.042 0.026 349 1 OCT1997 31 0.424 0.096 137 0.120 0.089 303 0.052 0.019 316 1 NOV1997 30 0.636 0.113 155 0.145 0.113 305 0.074 0.043 309 1 DEC1997 10 0.398 0.071 169 0.114 0.097 304 0.061 0.023 312 1 MAY1997 29 0.406 0.097 135 0.123 0.063 328 0.076 0.010 320 1 68 MCM_97003_1254_6409_1800 JUN1997 30 0.377 0.040 162 0.141 0.050 327 0.118 0.012 323 1 JUL1997 31 0.316 0.030 138 0.104 0.055 332 0.057 0.016 317 1 AUG1997 31 0.400 0.085 146 0.102 0.055 333 0.064 0.011 325 1 SEP1997 30 0.427 0.079 140 0.112 0.054 326 0.074 0.019 323 1 OCT1997 31 0.400 0.100 140 0.130 0.053 324 0.095 0.012 320 1 NOV1997 30 0.496 0.105 143 0.142 0.064 324 0.107 0.020 318 1 DEC1997 10 0.453 0.028 156 0.171 0.053 326 0.138 0.016 323 1 MAY1997 29 0.319 0.024 159 0.072 0.041 329 0.035 0.009 321 1 133 MCM_97003_1254_6410_1800 JUN1997 30 0.389 0.021 185 0.108 0.042 327 0.080 0.012 323 1 JUL1997 31 0.325 0.016 194 0.067 0.034 332 0.030 0.009 327 1 AUG1997 31 0.255 0.015 186 0.059 0.033 327 0.030 0.007 324 1 SEP1997 30 0.278 0.032 160 0.081 0.033 329 0.056 0.010 324 1 OCT1997 31 0.319 0.024 179 0.073 0.038 326 0.045 0.009 319 1 NOV1997 30 0.479 0.030 158 0.107 0.049 329 0.070 0.010 323 2 DEC1997 10 0.389 0.033 166 0.104 0.044 335 0.055 0.008 322 1 MAY1997 29 0.302 0.014 138 0.055 0.045 73 0.013 0.009 312 1 183 MCM_97003_1254_9328_1800 JUN1997 30 0.360 0.004 135 0.051 0.043 66 0.014 0.009 298 1 JUL1997 31 0.305 0.016 106 0.052 0.045 66 0.010 0.010 89 1 AUG1997 31 0.270 0.011 122 0.056 0.043 59 0.015 0.010 275 1 SEP1997 30 0.238 0.011 75 0.045 0.036 61 0.014 0.008 271 1 OCT1997 31 0.273 0.014 54 0.069 0.036 62 0.016 0.010 82 1 NOV1997 30 0.322 0.013 111 0.072 0.052 56 0.021 0.012 287 1 DEC1997 10 0.328 0.012 136 0.071 0.051 58 0.018 0.014 328 1
Appendix B
Environmental Data
For
http://www.meds-sdmm.dfo-mpo.gc.ca/alphapro/wave/TDCAtlas/TDCP...
http://www.meds-sdmm.dfo-mpo.gc.ca/alphapro/wave/TDCAtlas/TDCP...
http://www.meds-sdmm.dfo-mpo.gc.ca/alphapro/wave/TDCAtlas/TDCP...
http://www.meds-sdmm.dfo-mpo.gc.ca/alphapro/wave/TDCAtlas/TDCP...
Canadian Climate Normals 1971-2000 http://www.climate.weatheroffice.ec.gc.ca/climate_normals/results_e.htm...
1 of 1 17/08/2006 10:23 AM
Temperature: Jan Feb Mar Apr May Jun Jul Aug Sep Oct Nov Dec Year Code
Daily Average (°C) -18.5 -18.3 -12.3 -4.9 1 6.2 10.1 10.7 7 1.1 -5.1 -12.8 -3 C Standard Deviation 3.2 3.7 2.8 2.5 1.7 1.5 1.3 1.1 1.1 1.9 2.6 3.2 1.4 C Daily Maximum (°C) -14 -13.6 -7.3 -0.3 5.1 11 15.1 15.6 10.9 4.2 -1.8 -8.8 1.3 C Daily Minimum (°C) -23.1 -22.9 -17.3 -9.5 -3 1.4 5.2 5.7 3 -2.1 -8.3 -16.8 -7.3 C Extreme Maximum (°C) 15.7 7.6 12.1 14.5 25.6 33.3 33.3 32.7 26.1 19.4 11.7 6.7 Date (yyyy/dd) 1990/12 2000/27 1999/29 1987/18 1950/31 1999/24 2000/31 2000/01 1927/03+ 1975/06 1927/03 1951/04 Extreme Minimum (°C) -42.5 -38.3 -37 -31.1 -17.5 -6.7 -2.8 -2.8 -6.7 -19 -24.4 -41.5 Date (yyyy/dd) 1995/27 1950/06+ 1992/02 1943/12 1992/05 1952/17 1933/02 1941/04+ 1929/24 1986/26 1951/25+ 1990/22 Precipitation: Rainfall (mm) 1.3 0.9 4.2 12.7 28.4 63.9 86.8 69.2 74.2 37.9 15.3 5.7 C Snowfall (cm) 77.2 55.3 82.5 58.7 28.8 16 0 0 2.6 26.9 63.8 80.3 C Precipitation (mm) 78.4 56.2 86.6 71.5 57.3 79.9 86.8 69.2 76.8 64.9 79 86.2 C
Average Snow Depth (cm) 69 84 104 95 26 0 0 0 0 1 15 47 37 D
Median Snow Depth (cm) 66 86 104 95 22 0 0 0 0 0 13 46 36 D
Snow Depth at Month-end (cm) 76 92 113 65 2 0 0 0 0 2 29 58 36 D
Extreme Daily Rainfall (mm) 11 5.6 31.6 35.6 45.7 42.2 54.1 65.8 63.8 39.4 43.2 53.1
Date (yyyy/dd) 1997/07 1940/14 1988/11 1995/23 1970/18 1929/26 1928/30 1953/17 1932/24 1998/02 1998/03 1927/18
Extreme Daily Snowfall (cm) 103.4 49.8 90.7 64.4 24 36.1 0 0 25.9 26.6 49.6 61
Date (yyyy/dd) 1988/06 1987/11 1943/13 1989/07 1988/23 1997/01 1927/01+ 1927/01+ 1943/27 1990/19 1987/06 1949/29
Extreme Daily Precipitation (mm) 103.4 49.8 90.7 64.4 45.7 48 54.1 65.8 63.8 39.4 49.6 61
Date (yyyy/dd) 1988/06 1987/11 1943/13 1989/07 1970/18 1989/29 1928/30 1953/17 1932/24 1998/02 1987/06 1949/29
Extreme Snow Depth (cm) 298 245 275 285 242 18 0 0 2 22 130 267
Date (yyyy/dd) 1990/02 1985/16+ 1985/26+ 1985/18+ 1985/01 1992/01 1985/01+ 1985/01+ 1992/30 1989/07 1989/24 1989/22+
Days with Maximum Temperature:
<= 0 °C 30.2 27.1 27.3 16.2 2.7 0 0 0 0 3.4 19.8 28.7 155.2 C > 0 °C 0.85 1.2 3.7 13.9 28.3 30 31 31 30 27.6 10.3 2.3 210.1 C > 10 °C 0.1 0 0.05 0.4 3.5 14.5 23.6 26.6 16.3 2 0 0 86.9 C > 20 °C 0 0 0 0 0.19 2.5 6 5.9 1 0 0 0 15.6 C > 30 °C 0 0 0 0 0 0.14 0.2 0.1 0 0 0 0 0.44 C > 35 °C 0 0 0 0 0 0 0 0 0 0 0 0 0 C
Days with Minimum Temperature:
> 0 °C 0.05 0 0.1 1.5 6.3 20.8 30.4 30.6 25.8 9.5 0.85 0.24 126 C <= 2 °C 31 28.3 31 29.8 30 20.1 2.2 2.3 11 28 29.9 31 274.4 C <= 0 °C 31 28.3 30.9 28.5 24.7 9.2 0.6 0.45 4.2 21.5 29.2 30.8 239.2 C < -2 °C 30.9 28.2 30.3 25.9 15.7 1.7 0.05 0 0.95 13.4 26.6 30 203.5 C < -10 °C 29.7 26.9 26 14.1 1.7 0 0 0 0 1.1 11 25.2 135.6 C < -20 °C 22.8 19.8 11 1.7 0 0 0 0 0 0 0.6 10.8 66.7 C < - 30 °C 3.8 3 0.3 0 0 0 0 0 0 0 0 0.76 7.8 C
Days with Rainfall:
>= 0.2 mm 0.48 0.5 1.2 3.1 7.1 12.7 13.6 12.9 13.5 8.1 2.1 1.1 C
>= 5 mm 0.1 0.05 0.11 0.76 1.7 4.4 5.1 4.1 5.3 2.9 0.81 0.43 C
>= 10 mm 0.05 0 0.11 0.33 0.67 2.1 3.1 2.6 2.4 1 0.48 0.24 C
>= 25 mm 0 0 0.05 0.05 0.1 0.19 0.63 0.35 0.24 0.14 0.19 0 C
Canadian Climate Normals 1971-2000
The minimum number of years used to calculate these Normals is indicated by a code for each element. A "+" beside an extreme date indicates that this date is the first occurrence of the extreme value. Values and dates in bold indicate all-time extremes for the location.
NOTE!! Data used in the calculation of these Normals may be subject to further quality assurance checks. This
may result in minor changes to some values presented here.
NAIN A
NEWFOUNDLAND
Latitude: 56° 33' N Longitude: 61° 40' W Elevation: 06.70 m
Sea Surface Temperature
AREA_NAME DEPTH MONTH MAX_TEMPERATURE AVG_TEMPERATURE STDDEV_TEMPERATURE
LS21 0 1 3.25 -0.12 1.3 LS21 0 2 3.52 0.66 2.55 LS21 0 3 3.1 0.55 2.19 LS21 0 4 -1.5 -1.5 0 LS21 0 5 3.12 2.22 1.27 LS21 0 6 4.34 1.61 1.03 LS21 0 7 10.59 4.42 2.34 LS21 0 8 9.39 5.12 1.65 LS21 0 9 7.44 3.92 1.4 LS21 0 10 5.2 2.24 1.24 LS21 0 11 5.1 0.89 1.5 LS21 0 12 1.44 -0.48 0.7
http://www.meds-sdmm.dfo-mpo.gc.ca/alphapro/wave/TDCAtlas/TDCP...
Department of Fisheries and Oceans -Ocean Sciences Ocean Data Inventory
17-Aug-2006 10:11
1444 Query:
Latitude Longitude Date Days Max Speed m/s Mean Speed m/s Current Dir
T Major m/s Minorm/s DirT Major m/s Minorm/s DirT Moor
Depth M
Mid Freq Var Low Freq Var QC Event Spec
52 N 51 W - -NOV1991 14 0.522 0.237 141 0.139 0.054 319 0.115 0.035 323 1 52 29.57 N 51 19.05 W 202 MCM_91052_SP1_1607_3600 DEC1991 31 0.529 0.251 141 0.108 0.096 330 0.071 0.046 324 1 JAN1992 31 0.550 0.145 141 0.111 0.071 316 0.103 0.058 317 1 FEB1992 29 0.578 0.214 141 0.118 0.070 319 0.111 0.052 319 1 MAR1992 31 0.625 0.280 139 0.128 0.061 321 0.120 0.037 321 1 APR1992 30 0.460 0.215 141 0.100 0.052 321 0.092 0.032 321 1 MAY1992 31 0.378 0.204 139 0.074 0.040 323 0.067 0.023 324 1 JUN1992 30 0.443 0.258 139 0.077 0.044 320 0.068 0.033 320 1 JUL1992 13 0.422 0.275 138 0.079 0.035 310 0.055 0.012 312 1 NOV1991 14 0.398 0.185 140 0.141 0.042 314 0.104 0.024 316 1 302 MCM_91052_SP1_5569_3600 DEC1991 31 0.477 0.207 141 0.092 0.057 321 0.077 0.026 322 1 JAN1992 31 0.439 0.104 141 0.094 0.054 318 0.088 0.038 319 1 FEB1992 29 0.453 0.161 139 0.103 0.044 321 0.096 0.025 321 1 MAR1992 31 0.582 0.242 140 0.136 0.043 318 0.129 0.024 318 1 APR1992 30 0.401 0.161 141 0.083 0.036 320 0.075 0.020 320 1 MAY1992 31 0.247 0.167 140 0.034 0.021 314 0.026 0.008 314 1 NOV1991 14 0.426 0.143 145 0.187 0.041 319 0.118 0.024 320 1 502 MCM_91052_SP1_5572_3600 DEC1991 31 0.423 0.177 143 0.093 0.048 325 0.086 0.022 326 1 JAN1992 31 0.377 0.109 143 0.079 0.044 321 0.076 0.020 325 1 FEB1992 29 0.357 0.133 140 0.085 0.038 331 0.083 0.026 331 1 MAR1992 31 0.511 0.194 142 0.106 0.032 322 0.108 0.013 322 1 APR1992 30 0.329 0.115 140 0.072 0.023 318 0.072 0.013 320 1 MAY1992 31 0.256 0.116 141 0.052 0.023 323 0.055 0.010 326 1 JUN1992 30 0.340 0.148 142 0.062 0.021 322 0.062 0.008 325 1 JUL1991 24 0.821 0.429 149 0.116 0.077 29 0.097 0.039 20 1 52 45.41 N 51 43.08 W 31 MCM_91912_4_1562_1800 AUG1991 31 0.853 0.451 151 0.126 0.116 35 0.102 0.087 9 1 SEP1991 30 0.802 0.354 149 0.130 0.123 86 0.068 0.060 319 1 OCT1991 25 0.755 0.383 151 0.126 0.111 32 0.094 0.082 10 1 JUL1991 24 0.473 0.230 143 0.072 0.042 322 0.062 0.021 327 1 195 MCM_91912_4_10135_1800 AUG1991 31 0.517 0.241 144 0.068 0.054 307 0.049 0.021 322 1 SEP1991 30 0.438 0.214 143 0.065 0.053 306 0.041 0.025 316 1 OCT1991 25 0.677 0.260 143 0.090 0.059 338 0.072 0.026 342 1 JUL1991 24 0.383 0.172 141 0.084 0.033 317 0.072 0.012 325 1 450 MCM_91912_4_9078_1800
http://www.meds-sdmm.dfo-mpo.gc.ca/alphapro/wave/TDCAtlas/TDCP...
http://www.meds-sdmm.dfo-mpo.gc.ca/alphapro/wave/TDCAtlas/TDCP...
http://www.meds-sdmm.dfo-mpo.gc.ca/alphapro/wave/TDCAtlas/TDCP...
http://www.meds-sdmm.dfo-mpo.gc.ca/alphapro/wave/TDCAtlas/TDCP...
http://www.meds-sdmm.dfo-mpo.gc.ca/alphapro/wave/TDCAtlas/TDCP...
Appendix C
Environmental Data
For
http://www.meds-sdmm.dfo-mpo.gc.ca/alphapro/wave/TDCAtlas/TDCP...
http://www.meds-sdmm.dfo-mpo.gc.ca/alphapro/wave/TDCAtlas/TDCP...
http://www.meds-sdmm.dfo-mpo.gc.ca/alphapro/wave/TDCAtlas/TDCP...
http://www.meds-sdmm.dfo-mpo.gc.ca/alphapro/wave/TDCAtlas/TDCP...
[
français
] [
Back
]
Canadian Climate Normals 1971-2000
The minimum number of years used to calculate these Normals is indicated by a code for each element. A "+" beside an extreme date indicates that this date is the first occurrence of the extreme value. Values and dates in bold indicate all-time extremes for the location.
NOTE!! Data used in the calculation of these Normals may be subject to further quality assurance checks. This may result in minor changes to some values presented here.
SAULT STE MARIE 2
ONTARIO
Latitude: 46° 31' N Longitude: 84° 19' W Elevation: 211.80 m
Climate ID: 6057590 WMO ID: TC ID:
Temperature: Jan Feb Mar Apr May Jun Jul Aug Sep Oct Nov Dec Year Code
Daily Average (°C) -10.1 -8.6 -3.4 3.7 11.5 15.5 18.3 18 13.1 7.2 0.4 -6.5 A Standard Deviation 2.8 2.9 2.2 1.9 2.1 1.6 1.4 1.4 1.2 1.8 1.7 3 A Daily Maximum (°C) -5.8 -4 1.3 8.7 17.5 21.4 24.1 23.3 17.8 11.2 3.6 -2.8 A Daily Minimum (°C) -14.2 -13 -8 -1.4 5.3 9.5 12.4 12.7 8.4 3.1 -2.7 -10 A Extreme Maximum (°C) 7.2 12 19 30 32 33.5 36 34 32.8 26.7 19.5 15 Date (yyyy/dd) 1973/18 2000/23 1995/14 1990/25 1993/10 1994/17 1988/08 1988/02 1976/08 1968/16 1990/02+ 2001/05 Extreme Minimum (°C) -35 -32.5 -33.9 -17.2 -6.7 -2 1.7 0 -3.5 -7.8 -21.7 -34.5 Date (yyyy/dd) 1982/10 1981/12 1972/03 1972/07 1966/07 1980/10 1972/05 1985/08 1993/30 1976/26 1964/30 1993/26 Precipitation: Rainfall (mm) 7.9 5.2 26.6 50.3 67.5 81 77.5 92.3 102.1 88.3 53.1 13.8 665.5 A Snowfall (cm) 93.4 47.9 37.6 17.2 0.5 0 0 0 0 9.5 41.5 97.3 345 A Precipitation (mm) 101.2 53.1 64.2 67.5 67.9 81 77.5 92.3 102.2 97.8 94.7 111.1 1010.5 A
Average Snow Depth (cm) 0 0 0 0 0 0 C
Median Snow Depth (cm) 0 0 0 0 0 0 C
Snow Depth at Month-end (cm) 0 0 0 0 0 0 C
Extreme Daily Rainfall (mm) 18.4 21.1 48 43.8 81 84.8 41.9 95.3 72.4 54.4 41.7 30.2 Date (yyyy/dd) 1980/16 1966/09 1976/26 1980/08 1970/30 1961/22 1958/04 1968/21 1985/02 2001/13 1963/22 1971/10
Extreme Daily Snowfall (cm) 35.6 22.9 30.5 28.2 5.1 0 0 0 2.5 15.2 22 60
Date (yyyy/dd) 1972/25 1968/02 1976/12 1991/09 1963/21+ 1958/01+ 1958/01+ 1958/01+ 1965/25 1972/17 1984/01 1995/08 Extreme Daily Precipitation (mm) 35.6 22.9 48 43.8 81 84.8 41.9 95.3 72.4 56.1 46.7 60 Date (yyyy/dd) 1972/25 1968/02 1976/26 1980/08 1970/30 1961/22 1958/04 1968/21 1985/02 1959/24 1963/22 1995/08
Extreme Snow Depth (cm) 102 106 104 63 3 0 0 0 0 15 36 120
Date (yyyy/dd) 1996/31 1996/11 1996/03+ 1996/01 1996/01 1961/01+ 1961/01+ 1961/01+ 1961/01+ 1969/28 1966/05 1995/11 Days with Maximum Temperature:
<= 0 °C 25.9 20.8 12.3 2.1 0 0 0 0 0 0.21 8.1 20.9 A > 0 °C 5.1 7.5 18.7 27.9 31 30 31 31 30 30.8 21.9 10.1 A > 10 °C 0 0 2 12.1 26.5 29.6 31 31 28.5 17 3.2 0.11 A > 20 °C 0 0 0 1.1 10.3 18.6 25.4 24.4 8.7 1 0 0 A > 30 °C 0 0 0 0 0.25 0.7 1.2 0.53 0.14 0 0 0 A > 35 °C 0 0 0 0 0 0 0.08 0 0 0 0 0 A
Days with Minimum Temperature:
> 0 °C 0.14 0.85 3.3 11.6 25.7 29.7 31 31 29.1 22.5 8.6 1.7 A <= 2 °C 31 28.2 29.9 23.3 9.8 1.5 0.04 0 3 13 25.2 30.6 A <= 0 °C 30.9 27.4 27.7 18.4 5.3 0.29 0 0 0.9 8.5 21.4 29.4 A < -2 °C 29.6 25.6 24.1 11.7 1.3 0 0 0 0.05 3 15.1 26.1 A < -10 °C 20.9 18.1 10.6 1.1 0 0 0 0 0 0 2.9 14.3 A < -20 °C 7 5.3 0.96 0 0 0 0 0 0 0 0.08 3.3 A < - 30 °C 0.62 0.19 0 0 0 0 0 0 0 0 0 0.08 A
Page 1 of 2
Canadian Climate Normals 1971-2000
31/08/2006
http://www.climate.weatheroffice.ec.gc.ca/climate_normals/results_e.html?Province=AL...
< - 30 °C 0.62 0.19 0 0 0 0 0 0 0 0 0 0.08 A Days with Rainfall:
>= 0.2 mm 1.8 1.6 4.3 7.9 11 11.9 11.3 12.9 14.6 14.3 8.6 3.2 103.6 A
>= 5 mm 0.6 0.48 1.6 3.1 4.6 5 4.9 5.2 6.5 5.6 3.3 0.97 41.8 A
>= 10 mm 0.3 0.1 0.86 1.7 2.3 2.8 2.7 3 3.5 3.2 1.8 0.43 22.8 A
>= 25 mm 0 0 0.03 0.28 0.41 0.6 0.53 0.85 0.64 0.34 0.33 0.07 4.1 A
Days With Snowfall:
>= 0.2 cm 20.2 14.3 10.5 4.4 0.4 0 0 0 0.13 2.9 11.3 18.7 82.8 A
>= 5 cm 6.5 3.4 2.5 1.1 0 0 0 0 0 0.63 3 7 24.2 A
>= 10 cm 2.6 1 0.83 0.45 0 0 0 0 0 0.27 0.9 3 9 A
>= 25 cm 0.2 0 0.07 0.03 0 0 0 0 0 0 0 0.23 0.53 A
Days with Precipitation:
>= 0.2 mm 20.9 15.1 13.7 11.1 11.2 11.9 11.3 12.9 14.6 16 17.8 20.7 177.3 A
>= 5 mm 7.1 4 3.9 4.3 4.6 5 4.9 5.2 6.5 6.5 6.4 7.9 66.2 A
>= 10 mm 2.9 1.2 1.8 2.1 2.3 2.8 2.7 3 3.5 3.6 2.8 3.5 32.4 A
>= 25 mm 0.2 0 0.17 0.31 0.41 0.6 0.53 0.85 0.64 0.34 0.37 0.3 4.7 A
Days with Snow Depth:
>= 1 cm 0.12 0 0 0 0 C >= 5 cm 0 0 0 0 0 C >= 10 0 0 0 0 0 C >= 20 0 0 0 0 0 C Degree Days: Above 24 °C 0 0 0 0 0 0.4 1.4 0.8 0.1 0 0 0 A Above 18 °C 0 0 0 0.1 5 18.5 40.3 41.8 8.5 0.2 0 0 A Above 15 °C 0 0 0 0.8 18.5 54 102.9 106 27.8 1.7 0 0 A Above 10 °C 0 0 0.2 7.7 77.9 165.1 249.3 253.8 109.8 21 1 0.1 A Above 5 °C 0 0 4.4 41.8 195.1 310.7 404.2 408.7 244.6 94.6 13.4 0.6 A Above 0 °C 1.3 6 31.8 134.2 344.8 460.6 559.2 563.7 394.2 226.3 66.7 8.9 A Below 0 °C 309.1 245.5 128.5 19.2 0.1 0 0 0 0 1.5 53.6 210.6 A Below 5 °C 462.8 381 256.1 76.8 5.4 0.1 0 0 0.4 24.7 150.3 357.3 A Below 10 °C 617.8 522.4 406.8 192.8 43.1 4.5 0 0.1 15.6 106.2 287.9 511.8 A Below 15 °C 772.8 663.8 561.6 335.8 138.7 43.4 8.7 7.3 83.6 241.9 436.9 666.7 A
Below 18 °C 865.8 748.6 654.6 425.2 218.2 97.9 Important Notices39.1 36.1 154.4 333.4 526.9 759.7 A Created : 2002-06-21
Modified : 2004-02-25 Reviewed : 2004-02-25
Url of this page : http://www.climate.weatheroffice.ec.gc.ca/climate_normals/results_e.html
The Green LaneTM,
Environment Canada's World Wide Web Site.
Page 2 of 2
Canadian Climate Normals 1971-2000
31/08/2006
http://www.climate.weatheroffice.ec.gc.ca/climate_normals/results_e.html?Province=AL...
Mean water surface temperature
Year Day Sup. Mich. Huron Erie Ont.
Jan Avg 2.6 3.1 3.1 2.4 3.3 Feb Avg 1.4 1.7 1.3 1.7 1.9 Mar Avg 0.9 1.6 0.9 1.4 1.7 Apr Avg 1.1 2.5 1.7 3.7 2.6 May Avg 2.3 5.5 4.6 9.8 6.1 Jun Avg 5.3 12.3 11.2 17.5 13.8 Jul Avg 10.9 18.7 17.2 22.2 19.5 Aug Avg 15.4 20.9 19.7 23.4 21.8 Sep Avg 14.3 18.8 17.8 21.1 19.3 Oct Avg 9.5 13.2 12.4 15.8 13.4 Nov Avg 6.5 8.9 8.4 10.7 8.6 Dec Avg 4.5 5.6 5.7 5.5 5.5
http://www.meds-sdmm.dfo-mpo.gc.ca/alphapro/wave/TDCAtlas/TDCP...
Back to GLCFS HomePage Jump To:
Jump To:
Nowcast Products...
Forecast Products...
Lake Superior Surface Currents
Animation (-24 to 00) Java | FLC 00-03 -06 -09 -12 -15 -18 -21 -24
Animation (-48 to -24) Java | FLC-27-30 -33 -36 -39 -42 -45-48
Page 1 of 1
GLCFS Nowcast Surface Currents
15/09/2006
http://www.glerl.noaa.gov/res/glcfs/ssfcur-00.html
http://www.meds-sdmm.dfo-mpo.gc.ca/alphapro/wave/TDCAtlas/TDCP...
http://www.meds-sdmm.dfo-mpo.gc.ca/alphapro/wave/TDCAtlas/TDCP...
http://www.meds-sdmm.dfo-mpo.gc.ca/alphapro/wave/TDCAtlas/TDCP...
http://www.meds-sdmm.dfo-mpo.gc.ca/alphapro/wave/TDCAtlas/TDCP...
http://www.meds-sdmm.dfo-mpo.gc.ca/alphapro/wave/TDCAtlas/TDCP...
http://www.meds-sdmm.dfo-mpo.gc.ca/alphapro/wave/TDCAtlas/TDCP...
http://www.meds-sdmm.dfo-mpo.gc.ca/alphapro/wave/TDCAtlas/TDCP...
http://www.meds-sdmm.dfo-mpo.gc.ca/alphapro/wave/TDCAtlas/TDCP...
http://www.meds-sdmm.dfo-mpo.gc.ca/alphapro/wave/TDCAtlas/TDCP...
http://www.meds-sdmm.dfo-mpo.gc.ca/alphapro/wave/TDCAtlas/TDCP...
Appendix D
Environmental Data
For
http://www.meds-sdmm.dfo-mpo.gc.ca/alphapro/wave/TDCAtlas/TDCP...
http://www.meds-sdmm.dfo-mpo.gc.ca/alphapro/wave/TDCAtlas/TDCP...
http://www.meds-sdmm.dfo-mpo.gc.ca/alphapro/wave/TDCAtlas/TDCP...
http://www.meds-sdmm.dfo-mpo.gc.ca/alphapro/wave/TDCAtlas/TDCP...