HAL Id: hal-00741867
https://hal.archives-ouvertes.fr/hal-00741867
Submitted on 15 Oct 2012HAL is a multi-disciplinary open access
archive for the deposit and dissemination of sci-entific research documents, whether they are pub-lished or not. The documents may come from teaching and research institutions in France or abroad, or from public or private research centers.
L’archive ouverte pluridisciplinaire HAL, est destinée au dépôt et à la diffusion de documents scientifiques de niveau recherche, publiés ou non, émanant des établissements d’enseignement et de recherche français ou étrangers, des laboratoires publics ou privés.
Numerical study of the coupling between reaction and
mass transfer for liquid-liquid slug flow in square
microchannels
Nathalie Di Miceli Raimondi, Laurent E. Prat
To cite this version:
Nathalie Di Miceli Raimondi, Laurent E. Prat. Numerical study of the coupling between reaction and mass transfer for liquid-liquid slug flow in square microchannels. AIChE Journal, Wiley, 2011, vol. 57, pp.1719-1732. �10.1002/aic.12411�. �hal-00741867�
O
pen
A
rchive
T
OULOUSE
A
rchive
O
uverte (
OATAO
)
OATAO is an open access repository that collects the work of Toulouse researchers and makes it freely available over the web where possible.This is an author-deposited version published in : http://oatao.univ-toulouse.fr/
Eprints ID : 6645
To link to this document : DOI:10.1002/aic.12411
URL : http://dx.doi.org/10.1002/aic.12411
To cite this version : Raimondi, Nathalie Di Miceli and Prat, Laurent E. Numerical study of the coupling between reaction and mass transfer for liquid-liquid slug flow in square microchannels. (2011) AIChE Journal, vol. 57 (n° 7). pp. 1719-1732. ISSN 0001-1541
Any correspondance concerning this service should be sent to the repository administrator: staff-oatao@inp-toulouse.fr.
Numerical study of the coupling between reaction and mass transfer for
liquid-liquid slug flow in square microchannels
Nathalie Di Miceli Raimondi, Laurent Prat
Université de Toulouse; INPT, UPS; Laboratoire de Génie Chimique CNRS UMR 5503; 5 rue Paulin Talabot, BP1301, F- 31106 Toulouse cedex 01, France
Abstract
While the benefits of miniaturisation on processes have been widely demonstrated, its impact on microfluidics and local mechanisms such as mass transfer is still little understood. The aim of this work is to simulate coupling between reaction and mass transfer in microchannels for liquid-liquid slug flow. First, the extrapolation to confined flow of the classical model used to calculate interfacial mass fluxes in reactive infinite media was studied. This model consists in estimating transferred fluxes between two phases as a function of the enhancement factor E. Its expression depends on the model used to represent interfacial mass transfer. In infinite media, Lewis and Whitman’s stagnant film theory is generally preferred for its simplicity and its reliability. In the case of confined slug flow, the limitation of such a model to predict interfacial fluxes is highlighted. Secondly, the case of liquid-liquid competitive consecutive reactions in microchannels is considered. This work emphasizes the unfavourable impact of the length between droplets on selectivity. This is a direct consequence of mass transport mechanisms in microchannels.
Introduction
Process intensification by miniaturisation opens up numerous perspectives in terms of chemical production. Indeed, decreasing device size allows a reduction of technology constraints to the benefit of chemistry.1-3 On one hand, micro-devices are characterised by high surface area to volume ratio which provide them good thermal capacity.4-6 On the other hand, it allows the enhancement of mass transfer notably in two-phase flow where high interfacial area can be obtained.7
While the impact of miniaturisation on such geometric parameter is well-known, its impact on microfluidics and local mechanisms such as mass transfer is still little understood. Consequently, to predict reaction results proceeded in a microchannel, many experiments are usually required. Hisamoto et al. (2001) carried out a liquid-liquid diazocoupling reaction in a 20 mL stirred vessel (dispersed flow) and a microchannel (stratified flow).8 For a conversion close to 100 % in both devices, they observed the formation of precipitate side products at macroscale while such precipitation did not appear at microscale. They mainly explained this unexpected phenomenon by mass transfer enhancements due to short molecular diffusion distances that characterize microdevices. Wörz and al. (2001) used a micromixer coupled with a micro heat exchanger to carry out an exothermic liquid-liquid reaction.1 They obtained higher conversion than in a fed-batch reactor while diminishing by half the production of by-products. These results are probably due to better mixing and thermal controls. These works confirm the potential of microtechnologies for chemical reaction, but highlight the complexity of fundamental mechanism coupling at microscale and the importance to acquire knowledge in this domain. Numerous research groups devoted their works on the coupling between hydrodynamics at microscale and mass transfer.9-14 Fewer got interested in the comprehension of phenomenon coupling in two-phase reaction at such scale.15 This article focuses on the numerical study of the coupling between reaction and mass transfer in square microchannels considering liquid-liquid slug flow. This flow configuration is particularly interesting for mass transfer because of recirculation loops inside the droplets which intensify mixing in this phase,16 and a film characterized by a high velocity gradient which allows intense transfers with the droplets.17 Study has been carried out as follows :
- Firstly, the impact of reaction on liquid-liquid mass transfer is studied. Reaction can lead to an increase of interfacial mass transfer fluxes.18 This phenomenon is generally represented through the enhancement factor E, which is commonly used to estimate mass transfer fluxes in infinite reactive media. The objective of this work is to study the extrapolation of this classical model to confined media.
- Secondly, this work deals with the impact of mass transfer on reaction. For that purpose, a competitive chemical scheme is considered to characterise the impact of mass transportation in liquid-liquid slug flow in microchannels on reaction selectivity.
Numerical method
Two dimensional (2D) simulations are carried out to calculate the concentration field of a chemical component in a square microchannel. The computations are done in two steps: first, the hydrodynamic characteristics of the flow are determined using a research code developed at the Institute of Fluid Mechanics of Toulouse (IMFT – University of Toulouse, France): JADIM.19 This code allows the resolution of continuity and Navier-Stokes equations in two-phase flows. The second step consists in the computation of the concentration field of the transferring component, based on the resolution of a mass balance for this component. This last code was developed under Matlab 7.4.
Tryggvason et al. pointed out the difficulty to compute the motion of multiphase flows20. The representation and simulation of deformable phase interfaces is still a major challenge. In their article, they reviewed the most popular numerical techniques used to compute Navier-Stokes equations in the case of multiphase flows. This work has led to a study on reactive mass transfer in bubbles21.
Volume-of-fluid method is used in the present work. This numerical method is based on an interface-capturing technique without any interface reconstruction. The two-phase flow is described using the one-fluid approach. The phase tracking is insured by a continuous function
ϕ
, the so called volume fraction, which equals zero in the continuous phase and one in the droplets: consequently the interface is located in the area whereϕ
strictly ranges from zero to one22. The equations and balances are discretised on space according to a finite-volume method.This method assumes that (1) the fluids in both phases are Newtonian and incompressible, (2) the physical properties of both phases are constant and not influenced by mass transfer, (3) mass transfer has no impact on the flow (computation of the hydrodynamic parameters and the concentration field decoupled), (4) the two-phase flow and the concentration are planar symmetric. Consequently, the computational domain is half a unit cell as shown in Fig. 1. On the figures the interface is fictitious (deduced from volume fraction as it is not calculated by JADIM code). The interface was arbitrary considered in the area where
ϕ
= 0.75. This value was chosen since the concentration inside the droplets is important to identify mass transfer coefficients in the droplet side from the concentration fields (this is described afterwards). This choice has no impact on the computations.Fig. 1. Illustration of a two dimensional computational mesh. The thick line represents the fictitious interface obtained with JADIM.
JADIM code was previously validated to describe the hydrodynamics of liquid-liquid slug flow in square microchannels by means of micro-PIV (Particle Image Velocimetry) experiments,23 comparing computed and experimental 3D velocity fields. Sarrazin et al. (2006) also demonstrated that the hydrodymamic structure of slug flow in square microchannel could be well estimated using 2D simulations.23 Indeed, the velocity fields computed with JADIM performing 3D and 2D simulations showed that the flow structures obtained with both kinds of simulation were similar. The purpose of this work is to identify a potential impact of channel size on the coupling between hydrodynamics, mass transfer and reaction. Since the hydrodynamics of liquid-liquid slug flow in microchannel is well represented by 2D simulations, this work exclusively focuses on the calculation of hydrodynamic parameters and concentration fields over 2D computational domains.
The whole numerical method was already used to study pure mass transfer in such two-phase systems.13 The hydrodynamics and the concentration field computation algorithms are described in details in this reference. The present article will only present the mathematical formulation that allows the concentration field computation for chemical species that are affected by both mass transfer and reaction. This formulation depends on the reaction scheme and kinetic laws considered: therefore, it will be afterwards described in each part dealing with a case study, i.e. the study of the impact of reaction on mass transfer, and reciprocally.
Impact of reaction on mass transfer
In a first part, the impact of reaction on mass transfer is considered. The objective of this work is to study the extrapolation of the classical model used to estimate mass transfer fluxes in reactive infinite media (i.e. based on the enhancement factor E estimation) to confined media. It is considered the case of a reactant A which transfers from the continuous phase to the dispersed phase and reacts to give a product B:
A 1 B in the dispersed phase (1)
This irreversible reaction is a first order reaction whose kinetic rate rd is given by:
d,A d KC
r = (2)
where K is the kinetic rate constant of the reaction, and Cd,A the concentration of A in the
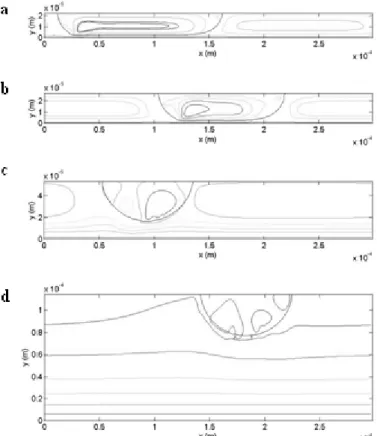
dispersed phase. The extrapolation of the classical model to confined media is studied comparing the mean concentration of reactant A in the droplets over time (1) obtained from concentration field computations (direct numerical simulations), and (2) estimated using the enhancement factor model. Four flow configurations are considered, which present the same droplet volumes and the same unit cell lengths (LUC = 300 µm) but different degrees of
confinement as illustrated in Fig. 2. This degree is represented by the ratio of the droplet length Ld and the channel width wC (Ld/wC = 3.1, 2.0, 0.71 and 0.36).
Fig. 2. Illustration of the streamlines in the flow configurations simulated to study the impact of reaction on mass transfer. (a) Ld = 154.4 µm, wC = 50 µm, Ud = 0.062 m/s, Ld/wC = 3.1. (b) Ld = 121.6 µm, wC = 60 µm, Ud =
0.039 m/s, Ld/wC = 2.0. (c) Ld = 84.8 µm, wC = 120 µm, Ud = 0.022 m/s, Ld/wC = 0.71. (d) Ld = 87 µm, wC = 240
Concentration field computation
The concentration field of component A over the computational domain is governed by the general convective diffusive equations in each phase, where the diffusive fluxes are expressed according to Fick’s law:
A d A d A d A d A d KC C D C t C , , 2 , , , + ⋅′∇ = ∇ − ∂ ∂ u (3) A c A c A c A c C D C t C , 2 , , , + ⋅′∇ = ∇ ∂ ∂ u (4)
where t is the residence time. u’ represents the velocity field in a frame of reference moving with the droplets. D is the mass diffusion coefficient of the transferring component. The subscripts c and d respectively stand for the continuous and dispersed phases. It assumes the concentration at the interface obeys the thermodynamic equilibrium given by Eq. (5), m being the distribution coefficient of component A between the two phases.
A c A
d mC
C , = , at the interface (5) The resolution of Eqs (3) and (4) according to the one-fluid approach requires the concentration to be continuous at the interface. For that purpose, some changes in the concentration formulation are suggested :24,25
m C
Cˆd,A = d,A/ , Cˆc,A =Cc,A m (6) Consequently, Eqs. (3), (4) and (5) can be rewritten as follows:
A d A d A d A d A d C m K C m D C m t C m , ˆ , , 2 ˆ , .ˆ , ˆ − ∇ = ∇ ⋅′ + ∂ ∂ u (7) A c c A c A c C m D C m t C m , 2 , , 1 ˆ ˆ ˆ 1 ∇ = ∇ ⋅′ + ∂ ∂ u (8) A c A d C Cˆ , = ˆ , at the interface (9)
Therefore, the mass balance in A over the whole computational domain can be represented by a single equation (Eq. (10)), where tˆ, 'uˆ , Dˆ and Kˆare transformed parameters defined as a function of the volume fraction
ϕ
as shown by Eqs. (11) to (14). The concentration field is computed through the parameter2
13
. A A A A C K C D C t C ˆ ˆ ˆ ˆ ˆ ˆ ˆ ˆ 2 − ∇ = ∇ ⋅′ + ∂ ∂ u (10)ϕ
11 2 3 44 5 6 − + = mt m t t m tˆ (11)ϕ
11 2 3 44 5 6 ′− ′ + ′ = ′ m m m u u u uˆ (12)m D m D D D D d c d c ) 1 ( ˆ
ϕ
ϕ
1+ − 2 3 4 5 6 = (13)ϕ
K m Kˆ = (14) Initial condition:A is initially present in the continuous phase with a concentration
2
14:) (1 ˆ 0
ϕ
− = A A mC C at t = 0 s (15) Boundary conditions:At the wall and the symmetry plan, there is no mass flux over the direction normal to the flow: 0 ˆ = ∂ ∂ y CA for y = 0 and y = wC/2 (16)
For the boundaries normal to the flow, two fictitious columns are introduced outside the domain to estimate the convective and diffusive terms. They are considered at the same concentration as the boundaries.
From the concentration field, the mean concentration profile of A in the droplets can be obtained using Eq. 17.
77
77
⋅ ⋅ = dxdy dxdy C Cd A d ϕ ϕ , (17)Modelling of the mass transfer enhancement phenomenon due to reaction
The consumption of A during its transfer to the dispersed phase leads to a modification of the mass transfer driving force, resulting in a mass transfer enhancement phenomenon. This phenomenon is generally represented through the enhancement factor E.26 The modelling of mass transfer with reaction is usually based on the Lewis and Whitman’s stagnant film theory. This model is easy to apply and gives predictions in terms of transfer fluxes in reactive medium very close to those obtained using more sophisticated theories such as Higbie’s penetration theory or Danckwerts’ surface renewal model. Lewis and Whitman’s stagnant film theory supposes that the interface is composed of two stagnant films which contain all the resistance to mass transfer. In this work, mass transfer is supposed to be at least limited by the resistance in the droplet side. Indeed, two distinct volumes contribute to mass transfer in the continuous phase: the film and the liquid slug between two droplets.11 The importance of both contributions on interfacial mass transfer kinetic is complex to determine. Previous works show that assuming mass transfer is partly limited by resistance in the droplet side allows good representation of mass fluxes at liquid-liquid interfaces in square microchannels of 50 to 960 µm depth.13
According to this model, the mass flux in reactive media transferring from the continuous phase to the droplets by interfacial area unit (Φm)c1d can be written in terms of Eq. (18). Its expression depends on the enhancement factor E.
) (
)
(2m c→d =E⋅kd Cdi −Cdb (18)
The superscripts i and b respectively refers to the concentration at the interface and in the bulk phase. kd is the droplet mass transfer coefficient. It is defined by Eq. (19), where Dd is the mass diffusion coefficient of the transferring component in the dispersed phase, and δd the stagnant film thickness.
d d d 3 D k = (19)
The mass balance at steady state for reactant A in the stagnant film (droplet side) can be written as follows: 0 2 + = ∇ d,A d,A d,A C r D (20)
This equation relates the diffusive flux in the film, expressed in terms of Fick’s law, and the flux consumed by reaction. There is no term relative to the convective flux because the film is supposed stagnant. Lewis and Whitman’s theory considers that the mass transfer flux between two phases is directed perpendicularly to the flow. Therefore, considering a 2D representation of a square microchannel, Eq. (20) can be rewritten as follows:
d,A d,A d,A KC dy C d D 2 = 2 (21)
In order to express Eq. (21) in a dimensionless form, changes of variable on the concentration and the coordinate over the width are done (Eqs. (22) and (23)). Thus, the mass balance in the stagnant film can be written in terms of Eq. (24).
i d,A d,A d,A C C = χ (22) d 3 y Y = (23) d,A d,A d,A d,A d,A d d,A k KD D K3 dY d χ χ χ 2 2 2 2 = = (24)
In this equation appears the dimensionless Hatta number Ha which represents the ratio of the maximal fluxes of reaction and of mass transfer:
2 2 d d,A k KD Ha = (25) Boundary conditions: 1 ) 0 ( ) 0 (y= =C ⇔ Y = =
Cd,A d,Ai
χ
d,A at the interface (26)b d,A d,A b d,A d d,A y 3 C Y C ( = )= ⇔
χ
( =1)=χ
in the bulk (27)The integration of Eq. (24) leads to an analytical solution. In accordance with the boundary conditions, this solution can be written as follows:
(
)
[
b HaY HaY Ha HaY Ha HaY]
d,A Ha Ha d,A e e e e e e e e ⋅ − ⋅ − ⋅ − ⋅ − − + ⋅ − ⋅ − =χ
χ
1 (28)Therefore, the mass transfer flux at the interface can be expressed as a function of Ha:
) ( tanh ) ( cosh ) ( 0 0 Ha Ha Ha C C k dY d C k dy dC D 2 b d,A i d,A d Y d,A i d,A d y d,A d,A d c m 11 2 3 4 4 5 6 − = 11 2 3 44 5 6 − = 11 2 3 44 5 6 − = = = →
χ
(29)Finally, the enhancement factor E is deduced from Eqs. (18) and (29):
(
)
cosh tanh( ) 1 Ha Ha (Ha) C C C C E b d,A i d,A b d,A i d,A 1 1 2 3 4 4 5 6 − ⋅ − = (30)In this study, the mean concentration profiles of A in the droplets obtained from the concentration fields (Eq. (17)) are compared to those calculated with mass balances on the droplets: d A d UC d d c A m A d d a V KC V t C V , =(Φ , ) − , ∂ ∂ → (31)
where Cd,A represents the mean concentration of A in the droplets. Vd and VUC respectively stand for the volumes of a droplet and a unit cell. ad is the specific interfacial area of the two-phase flow, estimated as a function of the capillary number.13 The mass flux is calculated with Eqs. (18) and (30).
It assumes that the concentration of the bulk Cdb,A corresponded to the mean concentration in the droplet (Cd,A). This hypothesis has been chosen for this parameter is easier to experimentally capture than the concentration in the bulk. This assumption leads to an underestimation of the concentration gradient used to calculate interfacial mass flux. At macroscale, the impact of such an assumption is generally negligible as the stagnant film thickness is very small compared to the droplets diameter. At microscale, this assumption may strongly affect the mass transferred flux estimation as it will be seen afterwards.
The concentration at the interface Cdi,A was deduced from the concentration field
computation. In the first unit cell, the concentration in both phases obeys the initial condition given by Eq. (15): the thermodynamic equilibrium at the interface is not imposed (Eq. (5)). This leads to unrealistic value of the mean concentration of A at the interface on the first times of the operation. Consequently, the profiles obtained from computations and mass balance calculations were compared from the second unit cell: time t = 0 on the graphs presented afterwards corresponding to a real residence time t = T, where T is the flow period.
Results
The extrapolation of the enhancement factor modelling to predict mass transfer in reactive media in microchannels is studied in two regimes defined by different Hatta number :27
- Ha = 0.1: reaction is slow compared to mass transfer. Most of the reaction occurs in the bulk (within the droplets).
- Ha = 1: reaction and mass transfer rates are of the same order of magnitude. Part of the reaction occurs in the stagnant film.
When Ha = 0.1, the reaction is too slow to occur in the stagnant film and to induce a significant mass transfer enhancement: E is roughly equals to unity. Indeed, Danckwerts (1970) presents values of enhancement factor as a function of Hatta number.28 For a first order reaction, E is estimated at roughly 1.02 when Ha = 0.1, and 1.3 when Ha =1. Consequently, the first part of the simulations does not lead to conclusions on the extrapolation of the enhancement factor modelling in microchannels. However, it will show whether the reaction flux in Eq. (31), calculated with an averaged concentration, reliably predicts the reactant consumption in the droplets.
Hatta number depends on the mass transfer coefficient kd as shown in Eq. (25). For each flow configuration, this coefficient is firstly identified simulating pure mass transfer operation, i.e. without reaction. A prior study showed that the simulation results obtained with the numerical method used in this work were affected by numerical diffusion.13 This numerical diffusion corresponds to a truncation error of the convective term in the general mass transport equation. This error is included in the apparent mass diffusion, leading to a global overestimation of the diffusive mass fluxes. In the simulated conditions, the numerical diffusion coefficient was estimated at about 4110-9 m2/s, which is of the same order of magnitude as mass diffusion coefficient in liquids (about 10-9 m2/s). Hatta number is a function of the mass diffusion coefficient. Therefore, this number numerically obtained from simulations will be underestimated by Eq. (25), which will affect the predictions of mass fluxes calculated using the enhancement factor E. In order to make the numerical diffusion impact negligible, a value of mass diffusion coefficient was settled very high compared to the coefficient associated to numerical diffusion: D = Dd,A = Dc,A = 5110-8 m2/s.
In order to check the reliability of the computed concentration field near the interface, the thickness of concentration boundary layer
δ
m is estimated and compared to the mesh grid size. Slip boundary condition at the interface is assumed to minimizeδ
m. With such condition, velocity in the film is uniform, equal to -Ud in the frame of reference moving with the droplets as illustrated in Fig. 3 (the velocity profile in the film is linear when no-slip boundary condition is assumed).Fig. 3. Scheme of the concentration boundary layer in the film (a) with slip boundary condition and (b) no-slip boundary condition.
The local equilibrium between mass diffusion and convection can be written as follows:
2 2 y C D x C u ∂ ∂ − = ∂ ∂ ′ (32)
At the limit of the concentration boundary layer, both terms of Eq. (32) are approximated using characteristic parameters of the observed phenomenon:
2 ,s m d d C D L C U
δ
∆ ≈ ∆ (33)where
δ
m,s is the thickness of concentration boundary layer assuming slip condition, and is estimated as a function of Peclet number Pe:2 1 2 1 , = − 11 2 3 44 5 6 ≈ Pe L U D Ld d d s m
δ
(34)Table 1 shows the result of this layer estimation and the mesh grid size over the y-direction
∆
yfor the four flow configuration used in this study. The mesh is refined near the wall: the smallest and highest mesh sizes are given. It is observed that the estimated thicknesses of the concentration boundary layer are higher than the mesh sizes. Therefore, grid refinement may be sufficient to predict mass transfer in this area.
Finally, the following parameters are used: CA0 = 10 kg.m-3, and m = 1.
Table 1. Comparison between the estimated thicknesses of the concentration boundary layer and the mesh grid sizes. Ld/wC 3.1 2.0 0.71 0.36 Ld (µm) 154.4 121.6 84.8 87.0
δ
film (µm) 3.1 3.4 20.7 80.1 Ud (cm/s) 6.16 3.68 2.21 1.44δ
m,s (µm) 11.2 12.9 13.9 17.4∆
y (µm) 0.3 – 1.33 0.3 – 1.65 0.3 – 3.47 1 – 2.97Identification of the mass transfer coefficient without reaction
The concentration field computation allows the calculation of the mean concentration profiles of A in the droplets, in the continuous phase and at the interface on the droplets side. Fig. 4 shows these profiles for the four flow configurations considered.
The concentration at an infinite time rises when the degree of confinement decreases, i.e. when the channel diameter increases. This is logically due to the increase of the continuous phase volume while the droplets volume and the initial concentration
2
14 are the same in eachFig. 4. Mean concentration profiles of A in the droplets, the continuous phase and at the interface, estimated from the simulations without reaction. (a) Ld/wC = 3.1, (b) Ld/wC = 2.0, (c) Ld/wC = 0.71, (d) Ld/wC = 0.36.
From the mean concentration in the droplets, the mass transfer coefficient kd is identified so that the mass balance given by Eq. (35), and more precisely the discretised form of this equation (Eq. (36)), allows a good fitting of the mean concentration profile in the droplets obtained from the simulation.
(
i)
A d A d UC d d A d d k a V C C t C V , =− , − , ∂ ∂ (35)(
( ) ( ))
) ( ) ( , , , , C t C t V V a k dt t C dt t C i A d A d d UC d d A d A d − ⋅ − = + (36)Fig. 5 shows that the results of the identification are very satisfying. Indeed, the simulated profile and the one calculated from the mass balance present a good adequacy.
Fig. 5. Mean concentration profiles of A in the droplets simulated and calculated (without reaction). (a) Ld/wC =
3.1, (b) Ld/wC = 2.0, (c) Ld/wC = 0.71, (d) Ld/wC = 0.36.
Table 2 presents the identified mass transfer coefficient for each flow configurations studied. The values of the kinetic constant to set in the numerical code were determined in order to roughly obtain Ha = 0.1 and 1.
Table 2. Mass transfer coefficients identified and reaction kinetic constants calculated to study the impact of reaction on transfer.
Ld/wC 3.1 2.0 0.71 0.36
kd (m/s) 3.06e-03 3.03e-03 5.29e-03 3.35e-03
Ha 0.103 1.03 0.104 1.04 0.104 1.04 0.106 1.06
K (1/s) 2 200 2 200 6 600 2.5 250
Impact of reaction on mass transfer, Ha = 0.1
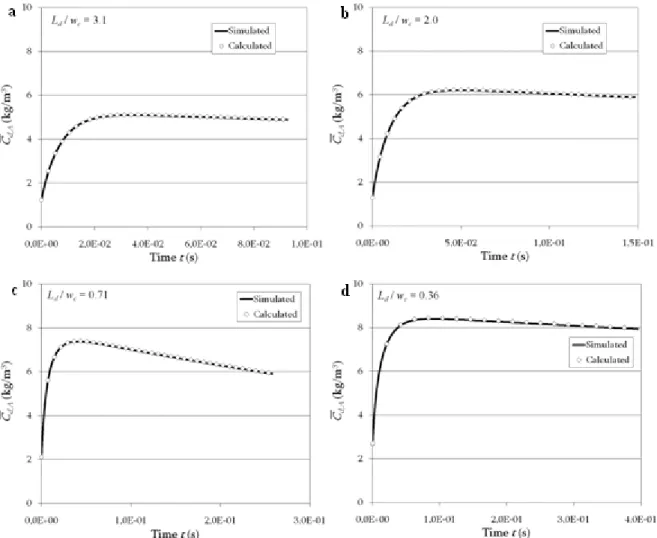
Fig. 6 shows that the mean concentration profiles in the droplets obtained from the simulations are well predicted by Eq. (37), which is the discretised form of the mass balance given by Eq. (31). Indeed, the simulated and calculated profiles are very close whatever is the degree of confinement of the droplets.
(
)
[
UC dA d]
i A d A d d d d A d A d E k a C t C t V KC t V V dt t C dt t C , ( + )= , ( )− ⋅ ⋅ , ( )− , ( ) ⋅ + , ( )⋅ (37)This result validates the reliability of the estimation of the reaction fluxes in Eq. (37) using a mean concentration over a droplet.
Fig. 6. Mean concentration profiles of A in the droplets simulated and calculated, Ha = 0.1. (a) Ld/wC = 3.1, (b)
Ld/wC = 2.0, (c) Ld/wC = 0.71, (d) Ld/wC = 0.36.
Impact of reaction on mass transfer, Ha = 1
Finally, simulations are carried out with Ha = 1 in order to observe a significant impact of reaction on mass transfer. Fig. 7 shows the comparison between the simulated and calculated concentration profiles in the droplets. This time, it is noticed an important difference between the two profiles.
This difference is more important in the confined flow configurations as illustrated on Fig. 8, which represents the relative deviation between the two profiles as a function of the length in the microchannel. When droplets are confined (Ld/wC > 1), the deviation is of about 35 %, while it is roughly of 25 % when Ld/wC < 1. Moreover, it can be noticed that the calculated concentration profile overestimates the one obtained from the computations. This remark
highlights that interfacial mass fluxes are overestimated by the model based on the enhancement factor calculation.
Indeed, concentration of the bulk in the droplet was approximated by the mean concentration in this volume. This implies an overestimation of the concentration gradient, and so an underestimation of the mass transfer coefficient kd (see part 3.3.1) to compensate. This coefficient was used to calculate Hatta number as described by Eq. (25). Therefore, the classical model for the estimation of interfacial mass flux in reactive liquid-liquid media applied at microscale tends to an overestimation of Hatta number, and so of the enhancement factor which directly impacts on the prediction of mass fluxes.
Fig. 7. Mean concentration profiles of A in the droplets simulated and calculated, Ha = 1. (a) Ld/wC = 3.1, (b)
Fig. 8. Relative deviation between the simulated and calculated mean concentration profiles in the droplets as a function of the degree of confinement of the flow.
Impact of mass transfer on reaction selectivity
In a second part, the study focuses on the case of a complex chemical scheme to carry out in a microchannel. Consecutive competitive reactions given by the following scheme are considered:
R1: A + B 1 C in the continuous phase (38) R2: A + C 1 D in the continuous phase (39) R1 and R2 are irreversible and second order reactions whose respective kinetic rates rc,1and
rc,2are given by:
c,B c,A c K C C r,1 = 1 (40) c,C c,A c K C C r,2 = 2 (41)
The reactants and products are soluble in both phases but the reactions are supposed to occur only in the continuous phase. The desired product is C, and D the by-product. In homogeneous systems, the selectivity of the reaction would depend on the ratio of the kinetic rate constants K1/K2 and the conversion of B. In two phase systems, mass transfer is a supplementary factor influencing the selectivity. The production of D depends on:
- the residence time of component C in the continuous phase after its formation. This time is linked to the transfer rate of C from the continuous phase to the droplets,
- the kinetic of the second reaction.
The unit cell length is one of the factors influencing the mass transfer kinetics in microchannels.13 Indeed, its increase slows down the transfer between the two phases. In this work, the influence of the unit cell length on the selectivity of the competitive consecutive reaction scheme is studied by means of a numerical study based on the numerical tool described in the second part. The mathematical formulation of the mass balances has been modified to take into account the two reactions and to follow the concentrations of the four
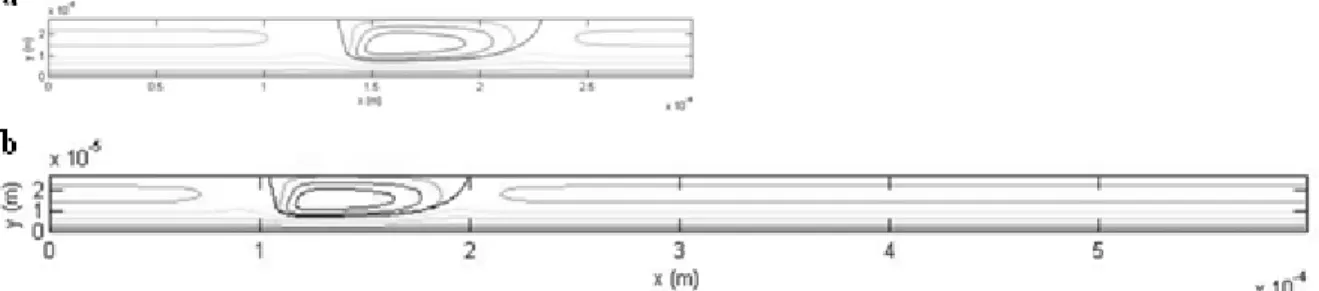
components. Two flow configurations are considered which present identical droplet length, velocity and hydrodynamic structures but different unit cell length as it can be seen on Fig. 9 :
LUC = 300 and 600 µm.
Fig. 9. Flow configurations simulated to study the impact of mass transfer on reaction selectivity. (a) Ld = 100.8
µm, Ud = 0.15 m/s, wC = 60 mm, LUC = 300 µm. (b) Ld = 100.8 µm, Ud = 0.15 m/s, wC = 60 mm, LUC = 600 µm.
Mathematical formulation for the concentration field computation
As previously said, the reactions occur in the continuous phase. Consequently, the following mass balances and interfacial equilibrium for each component j (j corresponds to the species A, B, C or D) in both phases can be written as follows:
j d j d j d j d C D C t C , 2 , , , ∇ = ∇ ⋅′ + ∂ ∂ u (42) C c A c j B c A c j j c j c j c j c C C K C C K C D C t C , , 2 , 2 , , 1 , 1 , 2 , , , + ⋅′∇ = ∇ +
ν
+ν
∂ ∂ u (43) j c j j d m C C , = , at the interface (44)where
ν
1,j andν
2,j stand for the stoichiometric coefficients of reactions R1 and R2. These equations were also formulated according to a one-fluid approach using the transformations described in part 3.1. Simulations are done with mA = 1, and mB = mC = mD = m. The reactant A is initially present in the continuous phase (with a concentration CA0 = 1 kg/m3) and B in the dispersed phase (with a concentration CB0 = 10 kg/m3). Therefore, the reaction is initiated by the transfer of B to the continuous phase.Results
The simulating conditions in terms of distribution coefficient m and ratio of kinetic constants
K1/K2 were varied. In order to highlight an impact of mass transport on reaction selectivity, kinetic constant values are set so that mass transfer kinetics are not limiting compared to reaction kinetics. This avoids that the reactions strictly occur at the interface. For that purpose, the simulations were done at low Hatta number: Ha < 0.5.
B, C and D characterised by a high distribution coefficient (m = 500), K1/K2 = 10
The distribution coefficient m was set at 500, which means that B, C and D are preferentially present in the dispersed phase. This condition notably induces that the transfer of the reactant B is limited. The kinetic constant of the secondary reaction is ten times lower than the one of the main reaction (K1 = 50 m3.mol-1.s-1; K2 = 5 m3.mol-1.s-1). Fig. 10 illustrates the
concentration fields obtained for each component at a residence time of 8 ms in the flow configuration characterised by the short unit cell length (LUC = 300 µm). The colour scale is not the same for each picture, but was adapted so that the concentrated areas for the different components clearly appear.
Fig. 10. Concentration fields of the reactants (a) A and (b) B, and the products (c) C and (d) D at a residence time of 8 ms, LUC = 300 µm, m = 500, K1 = 50 m3/(mols), K2 = 5 m3/(mols).
It is observed that:
- concentration of A tends to uniformity in both phase since this component is characterised by a distribution coefficient equal to unity.
- concentration of B is much higher in the dispersed phase (m = 500): the mass transferred fluxes of B are low.
- concentration of C and D are also higher in the dispersed phase (m = 500) while these components are produced in the continuous phase. It means that most of the reactions occur near the interface, which leads to a rapid transfer of these products to the dispersed phase after their generation.
- in the continuous phase, components C and D are in higher concentration in the film than in the interval, notably near the wall. This presumes that the reaction between A and B takes place dominantly in the film rather than in the interval. A small quantity of C tends to accumulate in the film which leads to a significant production of D in this volume.
The same observations can be formulated on the concentration fields computed considering the flow configuration where LUC = 600 µm.
From these concentration fields, selectivity of the reaction scheme S, defined in terms of Eq. (45), is calculated with the concentration of C and D averaged over a unit cell. Fig. 11 illustrates S for both flow configurations over time.
d C C C C C S + = (45)
Fig. 11. Evolution of the selectivity for both flow configurations, m = 500, K1 = 50 m3/(mol s), K2 = 5 m3/(mols). During the first milliseconds, the selectivities in both configurations are similar. But then the selectivity in the case characterised by the shortest unit cell length becomes higher than in the other case. This is a direct consequence of the accumulation of C in the film. Indeed, the longest the interval length, the highest the time available for C to stray from the interface to the wall by diffusion through the film. This phenomenon disadvantages its transfer back to the dispersed phase in favour of its consumption by reaction 2.
Following this observation, the simulating conditions are modified with the idea to minimize the unfavourable impact of the unit cell length on the selectivity. For that purpose, two cases were investigated:
- Firstly, the kinetic constant of the secondary reaction is increased (K2 = 50 m3.mol-1.s-1 ;
K1/K2 = 1) in order to avoid the diffusion of product C toward the wall by enhancing its consumption by reaction 2.
- Secondly, the secondary reaction is limited in the film by impoverishing this volume in reactant A. For that purpose, the flux of B was increased from the dispersed phase to the continuous phase by setting m = 1. In order to assign the impoverishment of A in the film to its consumption by reaction 1, it was set K1/K2 = 10. This is emphasized by the fact that B is in large excess.
B, C and D characterised by a high distribution coefficient (m = 500), K1/K2 = 1
The following parameters are set: m = 500 and K1 = K2 = 50 m3.mol-1.s-1. Fig. 12 illustrates the concentration field of D at a residence time of 8 ms in the flow configuration characterised by the short unit cell length (LUC = 300 µm).
Fig. 12. Concentration field of by-product D at a residence time of 8 ms, LUC = 300 µm, m = 500, K1 = 50
This by-product is again in high concentration near the wall: it is mainly formed in this area because of the diffusion of C through the film. In fact, despite the high value of K2, the transfer of C to the wall is still significant since low Hatta number was imposed. The results in terms of selectivity are similar to what was previously observed: the selectivity decreases when the interval length increases (Fig. 13).
Fig. 13. Evolution of the selectivity for both flow configurations, m = 500, K1 = 50 m3/(mol.s), K2 = 50
m3/(mol.s).
B, C and D characterised by a medium distribution coefficient (m = 1), K1/K2 = 10
Finally, the following parameters are set: m = 1 and K1/K2 = 10 to observe an impoverishment of the reactant A in the film due to its consumption by reaction 1. This is illustrated on Fig. 14 (a).
Fig. 14. Concentration fields of reactant (a) A and by-product (b) D at a residence time of 8 ms, LUC = 300 µm, m
=1, K1 = 50 m3/(mols), K2 = 5 m3/(mols).
Indeed, this figure presents the concentration field of A at a residence time of 8 ms in the flow configuration characterised by the short unit cell length (LUC = 300 µm): it is observed a dark blue coloration of the film which is significant of poorly concentrated areas. However, by-product D is still in high concentration near the wall (Fig. 14 (b)), which explains once again the negative impact of the unit cell length on the selectivity (Fig. 15).
Fig. 15. Evolution of the selectivity for both flow configurations, m = 1, K1 = 50 m3/(mol s), K2 = 5 m3/(mol s).
Conclusion
In this work, the behaviour of reacting liquid-liquid systems in microchannels was studied by means of numerical simulations. It aimed at underlining some issues relative to the proceeding of reaction in such systems, through two themes:
- Firstly, the study focused on the modelling of mass transfer in reactive medium. Transfer fluxes between two phases are generally estimated as a function of the enhancement factor E. Its expression depends on the model used to represent interfacial mass transfer. In usual device, we generally refer to Lewis and Whitman’s stagnant film theory for its simplicity and its reliability. In microchannels, it appeared that the enhancement factor was not well estimated considering such a model. Other theories such as Higbie’s penetration theory could be more appropriated to represent interfacial transfer. In other words, the present work shows that the way of apprehending mass transfer must take into account the degree of confinement of slug flows.
- Secondly, competitive consecutive reactions were considered in order to analyse the impact of the interval length between the droplets on the scheme selectivity. In the operating conditions simulated (low Hatta number), the selectivity tended to increase with a decrease of the unit cell length for a constant droplets length. This is due to the accumulation of the intermediate product C near the wall by diffusion of this product from the interface through the film. This observation should be validated by an experimental study.
This last part also suggests that concentrations in reactants and intermediates products are not uniform in the microchannel which raises the problem of hot spots formation when working with exothermic reactions. However, in our case (reactions occur in the continuous phase), the concentrated areas appear near the wall which is generally the region where the temperature control is optimal by heat exchange.
Notation
ad specific interfacial area, m2.m-3
C concentration, kg.m-3 C mean concentration, kg.m-3
dt time step, s
D mass diffusion coefficient, m2.s-1
E enhancement factor
k mass transfer coefficient, m.s-1
K kinetic rate constant, s-1 (part 3) or m3.mol-1.s-1 (part 4)
L length, m m distribution coefficient r reaction rate, kg.m-3.s-1 S selectivity t time, s T flow period, s u velocity vector, m.s-1 U velocity, m.s-1 V volume, m3 w width, m
x coordinate over the length, m
y coordinate over the width, m
Y dimensionless coordinate over the width
Greek letters
δ
stagnant film thickness, mν
stoichiometric coefficientϕ
volume fractionΦ
m mass transfer flux by interfacial area unit, kg.m-2.s-1χ
dimensionless concentration Subscripts 1 refers to reaction R1 2 refers to reaction R2 A refers to component A B refers to component Bcalc refers to calculated data
C channel or refers to component C
d dispersed phase or droplets
D refers to component D
j refers to chemical species (A, B, C or D)
simu refers to data obtained from simulations
UC unit cell
Superscripts
0 at initial time
i interface
‘ refers to the frame of reference moving with the droplets
^ refers to a transformed parameter
Acknowledgments
This work has been supported by 6th Framework EU under Grant IMPULSE No: NMP2-CT-2005-011816 and the Institut National Polytechnique of Toulouse (see http://www.inp-toulouse.fr). Experiments presented in this paper were carried out using the Grid'5000 experimental testbed, an initiative from the French Ministry of Research through the ACI GRID incentive action, INRIA, CNRS and RENATER and other contributing partners (see https://www.grid5000.fr).
References
1. Wörz, O., Jäckel, K.P., Richter, T., Wolf, A., 2001. Microreactors, a new efficient tool for optimum reactor design. Chem. Eng. Sci. 56, 1029-1033.
2. de Mello, A., Wooton, R., 2002. But what is it good for? Applications of microreactor technology for the fine chemical industry. Lab Chip 2, 7N-13N.
3. Ahmed, B., Barrow, D., Wirth, T., 2006. Enhancement of reaction rates by segmented fluid flow in capillary scale reactors. Adv. Synth. Catal. 348, 1043-1048.
4. Schubert, K., Brandner, J., Fichtner, M., Linder, G., Schygulla, U., Wenka, A., 2001. Microstructure devices for applications in thermal and chemical process engineering. Microscale Thermophysical Engineering 5 (1), 17-39.
5. Commenge, J.M., Falk, L., Corriou, J.P., Matlosz, M., 2004. Intensification des procédés par microstructuration. C. R. Physique 5, 597-608.
6. Jähnish, K., Hessel, V., Löwe, H., Baerns, M., 2004. Chemistry in microstructured reactors. Angewandte Chemie International Edition 43, 406-446.
7. Yue, J., Chen, G., Yuan, Q., Luo, L., Gonthier, Y., 2007. Hydrodynamics and mass transfer characteristics in gas-liquid flow through a rectangular microchannel. Chem. Eng. Sci. 62, 2096-2108.
8. Hisamoto, H., Saito, T., Tokeshi, M., Hibara, A., Kitamori, T., 2001. Fast and high conversion phase-transfer synthesis exploiting the liquid-liquid interface formed in a microchannel chip. Chem. Commun., 2662-2663.
9. Irandoust, S., Ertlé, S., Andersson, B., 1992. Gas-liquid mass transfer in Taylor flow through a capillary. Can. J. Chem. Eng. 70, 115-119.
10. Kreutzer, M.T., 2003. Hydrodynamics of Taylor flow in capillaries and monolith reactors. Ph.D. thesis, Delft University of Technology, Delft (the Netherlands).
11. van Baten, J.M., Krishna, R., 2004. CFD simulations of mass transfer from Taylor bubbles rising in circular capillaries. Chem. Eng. Sci. 59, 2535-2545.
12. Kockmann, N., Kiefer, T., Engler, M., Woias, P., 2006. Convective mixing and chemical reactions in microchannels with high flow rates. Sens. Actuators B 117, 495-508.
13. Di Miceli Raimondi, N., Prat, L., Gourdon, C., Cognet, P., 2008. Direct numerical simulations of mass transfer in square microchannels for liquid-liquid slug flow. Chem. Eng. Sci. 63, 5522-5530.
14. Mary, P., Studer, V., Tabeling, P., 2008. Microfluidic droplet-based liquid-liquid extraction. Anal. Chem. 80, 2680-2687.
15. Tsoligkas, A.N., Simmons, M.J.H., Wood, J., Frost, C.G., 2007. Kinetic and selectivity studies of gas-liquid reaction under Taylor flow in a circular capillary. Catal. Today 128, 36-46.
16. Sarrazin, F., Prat, L., Di Miceli, N., Cristobal, G., Link, D.R., Weitz, D.A.., 2007. Mixing characterization inside microdroplets engineered on a microcoalescer. Chem. Eng. Sci. 62, 1042-1048.
17. Vandu, C.O., Liu, H., Krishna, R., 2005. Mass transfer from Taylor bubbles rising in single capillaries. Chem. Eng. Sci. 60, 6430-6437.
18. Deckwer, W.D., 1992. Mass Transfer and Reaction. In: Bubble Column Reactors, John Wiley & Sons, Chichester, 47-68.
19. Legendre, D., Magnaudet, J., 1998. The lift force on a spherical bubble in a viscous linear shear flow. J. Fluid Mech. 368, 81-126.
20. Tryggvason, G., Bunner, B., Esmaeeli, A., Juric, D., Al-Rawahi, N., Tauber, W., Han, J., Nas, S., Jan, Y.J., 2001. A front-tracking method for the computation of multiphase flow. J. Comput. Phys. 169, 708-759.
21. Koynov A., Khinast J. G., Grétar Tryggvason G., Mass transfer and chemical reactions in bubble swarms with dynamic interfaces, AIChE J. 51 (10), 2786-2800.
22. Benkenida, A., Magnaudet, J., 2000. Une méthode de simulation d’écoulements diphasiques sans reconstruction d’interfaces. C. R. Acad. Sci. Série IIb 328 (1), 25-32.
23. Sarrazin, F., Loubière, K., Prat, L., Gourdon, C., Bonometti, T., Magnaudet, J., 2006. Experimental and numerical study of droplets hydrodynamics in microchannels. AIChE J. 52 (12), 4061-4070.
24. Yang, C., Mao, Z.S., 2005. Numerical simulation of interphase mass transfer with the level set approach. Chem. Eng. Sci. 60, 2643-2660.
25. Kashid, M.N., Agar, D.W., Turek, S., 2007. CFD modelling of mass transfer with and without chemical reaction in the liquid-liquid slug flow microreactor. Chem. Eng. Sci. 62, 5102-5109.
26. Roizard, C., Wild, G., Charpentier, J.C., 1997. Absorption avec réaction chimique. Techniques de l’Ingénieur, traité Génie des Procédés J 1079.
27. Last, W., Stichlmair, J., 2002. Determination of mass transfer parameters by means of chemical absorption. Chem. Eng. Technol. 25, 385-391.
List of figure captions
Fig. 1. Illustration of a two dimensional computational mesh. The thick line represents the fictitious interface obtained with JADIM.
Fig. 2. Illustration of the streamlines in the flow configurations simulated to study the impact of reaction on mass transfer. (a) Ld = 154.4 µm, wC = 50 µm, Ud = 0.062 m/s, Ld/wC = 3.1. (b)
Ld = 121.6 µm, wC = 60 µm, Ud = 0.039 m/s, Ld/wC = 2.0. (c) Ld = 84.8 µm, wC = 120 µm, Ud = 0.022 m/s, Ld/wC = 0.71. (d) Ld = 87 µm, wC = 240 µm, Ud = 0.014 m/s, Ld/wC = 0.36. Fig. 3. Mean concentration profiles of A in the droplets, the continuous phase and at the interface, estimated from the simulations without reaction. (a) Ld/wC = 3.1, (b) Ld/wC = 2.0, (c)
Ld/wC = 0.71, (d) Ld/wC = 0.36.
Fig. 4. Mean concentration profiles of A in the droplets simulated and calculated (without reaction). (a) Ld/wC = 3.1, (b) Ld/wC = 2.0, (c) Ld/wC = 0.71, (d) Ld/wC = 0.36.
Fig. 5. Mean concentration profiles of A in the droplets simulated and calculated, Ha = 0.1. (a) Ld/wC = 3.1, (b) Ld/wC = 2.0, (c) Ld/wC = 0.71, (d) Ld/wC = 0.36.
Fig. 6. Mean concentration profiles of A in the droplets simulated and calculated, Ha = 1. (a)
Ld/wC = 3.1, (b) Ld/wC = 2.0, (c) Ld/wC = 0.71, (d) Ld/wC = 0.36.
Fig. 6. Mean concentration profiles of A in the droplets simulated and calculated, Ha = 1. (a)
Ld/wC = 3.1, (b) Ld/wC = 2.0, (c) Ld/wC = 0.71, (d) Ld/wC = 0.36.
Fig. 7. Relative deviation between the simulated and calculated mean concentration profiles in the droplets as a function of the degree of confinement of the flow.
Fig. 8. Flow configurations simulated to study the impact of mass transfer on reaction selectivity. (a) Ld = 100.8 µm, Ud = 0.15 m/s, wC = 60 mm, LUC = 300 µm. (b) Ld = 100.8 µm,
Ud = 0.15 m/s, wC = 60 mm, LUC = 600 µm.
Fig. 9. Concentration fields of the reactants (a) A and (b) B, and the products (c) C and (d) D at a residence time of 8 ms, LUC = 300 µm, m = 500, K1 = 50 m3/(mols), K2 = 5 m3/(mols). Fig. 10. Evolution of the selectivity for both flow configurations, m = 500, K1 = 50 m3/(mol s), K2 = 5 m3/(mols).
Fig. 11. Concentration field of by-product D at a residence time of 8 ms, LUC = 300 µm, m = 500, K1 = 50 m3/(mols), K2 = 50 m3/(mols).
Fig. 11. Concentration field of by-product D at a residence time of 8 ms, LUC = 300 µm, m = 500, K1 = 50 m3/(mols), K2 = 50 m3/(mols).
Fig. 12. Evolution of the selectivity for both flow configurations, m = 500, K1 = 50 m3/(mol.s), K2 = 50 m3/(mol.s).
Fig. 13. Concentration fields of reactant (a) A and by-product (b) D at a residence time of 8 ms, LUC = 300 µm, m =1, K1 = 50 m3/(mols), K2= 5 m3/(mols).
Fig. 14. Evolution of the selectivity for both flow configurations, m = 1, K1 = 50 m3/(mol s),