HAL Id: hal-00327801
https://hal.archives-ouvertes.fr/hal-00327801
Submitted on 11 Jan 2005HAL is a multi-disciplinary open access
archive for the deposit and dissemination of sci-entific research documents, whether they are pub-lished or not. The documents may come from teaching and research institutions in France or abroad, or from public or private research centers.
L’archive ouverte pluridisciplinaire HAL, est destinée au dépôt et à la diffusion de documents scientifiques de niveau recherche, publiés ou non, émanant des établissements d’enseignement et de recherche français ou étrangers, des laboratoires publics ou privés.
Evolution of stratospheric ozone during winter
2002/2003 as observed by a ground-based millimetre
wave radiometer at Kiruna, Sweden
U. Raffalski, G. Hochschild, G. Kopp, Jakub Urban
To cite this version:
U. Raffalski, G. Hochschild, G. Kopp, Jakub Urban. Evolution of stratospheric ozone during winter 2002/2003 as observed by a ground-based millimetre wave radiometer at Kiruna, Sweden. Atmospheric Chemistry and Physics Discussions, European Geosciences Union, 2005, 5 (1), pp.131-154. �hal-00327801�
ACPD
5, 131–154, 2005 Evolution of stratospheric ozone during winter 2002/2003 over Kiruna, Sweden U. Raffalski et al. Title Page Abstract Introduction Conclusions References Tables Figures J I J I Back CloseFull Screen / Esc
Print Version Interactive Discussion Atmos. Chem. Phys. Discuss., 5, 131–154, 2005
www.atmos-chem-phys.org/acpd/5/131/ SRef-ID: 1680-7375/acpd/2005-5-131 European Geosciences Union
Atmospheric Chemistry and Physics Discussions
Evolution of stratospheric ozone during
winter 2002/2003 as observed by a
ground-based millimetre wave radiometer
at Kiruna, Sweden
U. Raffalski1, G. Hochschild2, G. Kopp2, and J. Urban3, *
1
Swedish Institute of Space Physics, Kiruna, Sweden
2
Institute of Meteorology and Climate Research, Forschungszentrum Karlsruhe and Universit ¨at Karlsruhe, Germany
3
Observatoire Aquitain des Sciences de l’Universit ´e, L3AB, Floirac, France
*
now at: Radio and Space Science Department, Chalmers University of Technology, Sweden Received: 2 April 2004 – Accepted: 29 October 2004 – Published: 11 January 2005
Correspondence to: U. Raffalski (uwe.raffalski@irf.se)
ACPD
5, 131–154, 2005 Evolution of stratospheric ozone during winter 2002/2003 over Kiruna, Sweden U. Raffalski et al. Title Page Abstract Introduction Conclusions References Tables Figures J I J I Back CloseFull Screen / Esc
Print Version Interactive Discussion
Abstract
We present ozone measurements of the millimetre wave radiometer installed at the Swedish Institute of Space Physics (Institutet f ¨or rymdfysik, IRF) in Kiruna (67.8◦N, 20.4◦E, 420 m a.s.l.). Nearly continuous operation in the winter of 2002/2003 allow us to give an overview of ozone evolution in the stratosphere between 15 and 55 km.
5
In this study we present a detailed analysis of the Arctic winter 2002/2003. By means of a methodology using equivalent latitudes we investigate the meteorological pro-cesses in the stratosphere during the entire winter/spring period. During the course of the winter strong mixing into the vortex took place in the middle and upper strato-sphere as a result of three minor and one major warming event, but no evidence was
10
found for significant mixing in the lower stratosphere.
Ozone depletion in the lower stratosphere during this winter was estimated by mea-surements on those days when Kiruna was well inside the Arctic polar vortex. The days were carefully chosen using a definition of the vortex edge based on equivalent latitudes. At the 475 K isentropic level a cumulative ozone loss of about 0.5 ppmv was
15
found starting in January and lasting until mid-March. The early ozone loss is probably a result of the very cold temperatures in the lower stratosphere in December and the geographical extension of the vortex to lower latitudes where solar irradiation started photochemical ozone loss in the pre-processed air.
In order to correct for dynamical effects of the ozone variation due to diabatic
sub-20
sidence of air masses inside the vortex, we used N2O measurements from the Odin satellite for the same time period. The derived ozone loss in the lower stratosphere be-tween mid-December and mid-March varies bebe-tween 1.1±0.1 ppmv on the 150 ppbv N2O isopleth and 1.7±0.1 ppmv on the 50 ppbv N2O isopleth.
ACPD
5, 131–154, 2005 Evolution of stratospheric ozone during winter 2002/2003 over Kiruna, Sweden U. Raffalski et al. Title Page Abstract Introduction Conclusions References Tables Figures J I J I Back CloseFull Screen / Esc
Print Version Interactive Discussion
1. Introduction
Millimetre wave measurements were performed at IRF between 1996 and 2000 on a campaign basis by the Institute of Meteorology and Climate Research (Institut f ¨ur Meteorologie und Klimaforschung, IMK), Forschungszentrum Karlsruhe and Univer-sit ¨at Karlsruhe, using the 268–280 GHz radiometer MIRA 2 (Berg et al.,1998). Since
5
January 2001, the Swedish Institute of Space Physics operates its own ground-based millimetre wave radiometer KIMRA (Kiruna millimetre wave radiometer), performing measurements continuously throughout the year.
KIMRA has been built in collaboration with IMK. The instrument was designed to ob-serve thermal emission lines of stratospheric trace gases between 195 and 225 GHz
10
and to measure O3, ClO, N2O and HNO3in a continuous mode 24 h a day throughout the year. Additionally, it carries out routine measurements of the tropospheric transmis-sion to estimate the tropospheric water vapour column. IMK performs the invertransmis-sion of the measured spectra to retrieve profiles and columns of the atmospheric constituents. For this study we have only used measurements of the twin peak ozone line at
15
195 GHz. This signature is much stronger than the disturbance due to baseline effects caused by instrumental problems. Spectra of the other trace gases are much weaker and therefore suffer more strongly from these effects and require further instrumental optimization.
KIMRA at IRF has an obvious advantage in the location north of the Polar Circle with
20
only a short polar night. This is favourable for studying the evolution of the polar strato-spheric winter chemistry both inside and outside the polar vortex and to investigate early ozone loss. With a detailed study of the potential vorticity of the polar vortex us-ing the Equivalent Latitude Method (Nash et al.,1996) it is possible to identify whether measurements have been taken inside or outside the Arctic polar vortex. Since
ground-25
based measurements over a longer time-span such as a week observe a substantial part of the inside vortex air mass, they provide some kind of vortex-averaged data.
obser-ACPD
5, 131–154, 2005 Evolution of stratospheric ozone during winter 2002/2003 over Kiruna, Sweden U. Raffalski et al. Title Page Abstract Introduction Conclusions References Tables Figures J I J I Back CloseFull Screen / Esc
Print Version Interactive Discussion vations are scarcely impaired by changing weather conditions. Moreover, the Kiruna
winter troposphere is usually very cold and dry. For instance, the mean tropospheric transmission at around 195 GHz from January to March 2002/2003 during the mea-surements presented in this paper was around 60%±14%. The continuous measure-ments provide detailed ozone data that can be used not only for monitoring purposes,
5
but also for process and case studies. Here we present examples of observations of ozone mini-holes in the beginning of December, the estimation of the chemical ozone loss during the winter, as well as mixing processes during the warming events in the course of the Arctic winter 2002/2003.
2. Measurement method
10
In the microwave region, the received power from faint thermal emission lines in the atmosphere is very small. In order to detect spectral lines of this low intensity with microwave radiometers there are two observation methods available, the total power method and the reference beam method. In total power mode the radiometer receives the atmospheric signal (typically between 100 and 270 K) and compares it to a cold
cal-15
ibration load (usually liquid nitrogen at 77 K) and a hot calibration load at ambient tem-perature at around 293 K. This method has an uncertainty because of non-linearities due to the detector performance at different temperatures. This effect is accounted for with the reference-beam method as described byParrish et al.(1988). The advantage of this method is that non-linearities of the detector as well as variations in the gain
20
of the amplifiers are minimized and can be neglected. Instead of measuring the total power of the atmospheric signal only, the atmospheric signal is compared to a refer-ence source at a brightness temperature similar to that of the received atmospheric signal. From the difference between the spectrum in signal and reference beam the information for the retrieval is obtained.
25
However, rather than deploying a second signal from the atmosphere at a higher elevation angle as reference signal (as suggested by Parrish), the IRF radiometer uses
ACPD
5, 131–154, 2005 Evolution of stratospheric ozone during winter 2002/2003 over Kiruna, Sweden U. Raffalski et al. Title Page Abstract Introduction Conclusions References Tables Figures J I J I Back CloseFull Screen / Esc
Print Version Interactive Discussion a rotatable wire grid which blends the brightness temperature of two calibration loads
at high and low temperature (Krupa et al.,1998). Since the receiver is only sensitive in one polarisation, the varying contribution of the hot and cold load to this particular polarisation synthesizes any brightness temperature between the hot and cold load brightness temperature. Thus, a reference signal can be chosen that matches the
5
power level of the atmospheric signal. This provides the opportunity to choose opti-mal elevation angles for the atmospheric measurements even under changing weather conditions. Moreover, the reference beam is not contaminated by signatures of emitting trace gases, so the difference Signal-Reference does not subtract an unknown part of the molecule’s signature in the atmospheric signal. This results in a higher contrast in
10
the resulting spectra compared to a reference beam from the atmosphere (Krupa et al.,
1998).
3. Instrumental setup
The millimetre wave radiometer KIMRA has been developed in collaboration with IMK. It has been designed and built for measurements of O3, ClO, HNO3and N2O in the
fre-15
quency range from 195 to 225 GHz. Additionally, the tropospheric transmission and an estimate for the tropospheric water vapour column can be obtained from the retrieval.
A conventional Schottky diode mixer is deployed, cryogenically cooled to about 35 K. The receiver noise temperature in Single Side Band (SSB) mode is about 1800 K.
The mixer is pumped by a tunable Gunn-oscillator (200–220 GHz) and converts the
20
incoming atmospheric signal into a first intermediate frequency (IF) of 8 GHz with a total bandwidth of about 1.2 GHz. After further downconversion to the second IF of 2.1 GHz, the signal is coupled to the spectrometer. Spectral analysis is performed by an acousto-optical spectrometer with 1024 channels providing an effective spectral resolution of about 1.2 MHz. Since the measurements are performed with a modified
25
reference-beam method the instrument uses an internal adjustable reference load for balanced calibration. It consists of a cold load at about 125 K and a hot load at
ambi-ACPD
5, 131–154, 2005 Evolution of stratospheric ozone during winter 2002/2003 over Kiruna, Sweden U. Raffalski et al. Title Page Abstract Introduction Conclusions References Tables Figures J I J I Back CloseFull Screen / Esc
Print Version Interactive Discussion ent temperature (293 K). Any antenna temperature between these two values can be
generated depending on the atmospheric conditions and the angle of observation. A publication with a detailed description of the system is in preparation.
The radiometer is equipped with a periscope-like mirror system enabling measure-ments in any direction above the horizon. However, it pointed northward for all
mea-5
surements presented in this paper.
4. Data analysis
The measured spectra are integrated in order to reduce the noise and thus to improve the S/N ratio. The integration time depends on the tropospheric conditions and is typically about 0.5–2 h for a single profile of stratospheric ozone. In situations of high
10
tropospheric transmission even a shorter integration time of 5 to 10 min is sufficient for a successful retrieval.
The varying content of water vapour in the troposphere leads to absorption of the atmospheric signal while it produces an offset in the background signal. These two effects have to be taken care of in the data retrieval. The contrast between line signal
15
and background in the measured spectra varies between 5 K and 25 K, depending on the tropospheric conditions.
The radiative transfer model described in Kopp (2001) uses merged HITRAN 96 (Rothman et al., 1998) and JPL (Pickett et al., 1998) spectral data as supplied by the BErnese Atmospheric Multiple Catalog Access Tool (Beamcat) (Feist,2004). Daily
20
pressure and temperature profiles of the National Centers for Environmental Prediction, NCEP, (Kanamitsu,1989) are merged with ground temperature data as measured at IRF (available on http://tempo.irf.se/cgi-weather/weather page) and are then used in the forward model. For the retrieval a modified “Optimal Estimation Method” (Rodgers,
1976) is used.
25
The retrieval yields vertical profiles of the volume mixing ratio (vmr) of ozone in the altitude range between 15 and 55 km. Using the full width at half maximum (FWHM)
ACPD
5, 131–154, 2005 Evolution of stratospheric ozone during winter 2002/2003 over Kiruna, Sweden U. Raffalski et al. Title Page Abstract Introduction Conclusions References Tables Figures J I J I Back CloseFull Screen / Esc
Print Version Interactive Discussion of the averaging kernels as a criterion we can obtain a vertical resolution of the ozone
profiles of at best 7 km (at 25 km altitude). As an example, the left hand side of Fig.1
shows the vertical resolution of the ozone profiles for 20 January 2003 as calculated from the averaging kernels. The right hand side of Fig.1shows the sensitivity of the instrument for ozone as estimated from the sums of the averaging kernels at given
5
altitude levels. The instrument has a sensitivity for ozone of at least 75% in the vertical range from about 15 to 55 km. The uncertainty in the retrieved profiles due to standing waves and systematic errors amounts to at least 1 ppmv (Kopp,2001); errors due to thermal noise are mostly negligible due to the integration of the measured spectra.
5. Evolution of the Stratosphere over the Northern Hemisphere in winter
10
2002/2003
5.1. Methodology
For the analysis of the evolution of ozone during the winter period we have only used measurements well inside the polar vortex. The definition of the vortex edge follows the Equivalent Latitude Method as suggested by Nash et al. (1996). The equivalent
15
latitude is obtained by calculating the area of the vortex enclosed by a certain PV-isoline and plotting areas of different PV values as concentric circles around the pole. The equivalent latitude is a measure for the size of the vortex and should not be confused with geographical latitudes. When considering Ertel’s potential vorticity against the equivalent latitude, the mean vortex edge can now be defined as the steepest gradient
20
in the resulting curve. The points of strongest curvature in this function yield the outer and inner vortex edge, respectively. This calculation leads to strong oscillations, spikes and even to no results if the vortex is not well confined. In particular this is the case if the transition area from inside to outside vortex is very large or totally undefined, as during the vortex formation or break-up phase and during events of strong distortion. In
25
ACPD
5, 131–154, 2005 Evolution of stratospheric ozone during winter 2002/2003 over Kiruna, Sweden U. Raffalski et al. Title Page Abstract Introduction Conclusions References Tables Figures J I J I Back CloseFull Screen / Esc
Print Version Interactive Discussion curvatures result in an unrealistic width of the edge area. On some days no edge can
be identified at all.
The advantage of this method over a fixed PV value for a certain isentropic level to determine the vortex edge is the more realistic interpretation of the potential vorticity as given by the European Centre for Medium-Range Weather Forecast (ECMWF). Given
5
the potential vorticity over a particular site, we can determine more precisely whether a measurement at this site on a particular day was performed inside the polar vortex, in the vortex edge region, or outside the polar vortex (Karhu et al.,2003). Thus, measure-ments can be identified as observations inside the polar vortex which otherwise (with a fixed PV value as vortex edge) would have been misinterpreted as outside-vortex or
10
vortex-edge observations. 5.2. Meteorology of the winter
The temperature evolution during the winter was quite peculiar. Figure 2 shows the temperature variation of this winter compared to the 10 winters prior to 2002/2003 for the 475 K isentropic level (ECMWF-data). The ECMWF analysis shows an
excep-15
tionally low minimum temperature at the beginning of December 2002. Throughout December temperatures stayed below the formation temperature for PSCs. In mid-January a major warming occurred. After that the temperature did not reach the low early winter values again even if the values dropped to near-formation temperature for some short periods in February and March.
20
During the entire December PSCs have been observed by Lidars at Ny- ˚Alesund (78.9◦N, 11.9◦E) and Alomar (69.3◦N, 16◦E) (EORCU,2003). Also early ClO activa-tion was reported (Urban et al.,2004), though most of the ClO remained in the dimer due to the lack of sunlight in December (EORCU,2003).
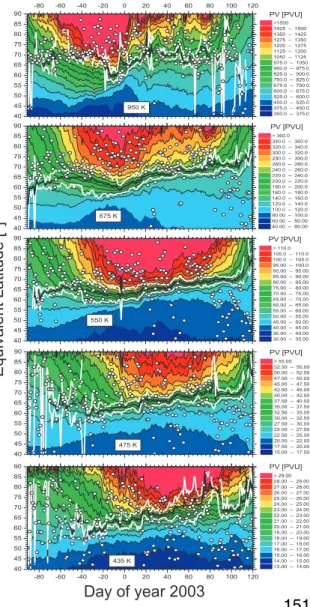
Figure 3 presents the evolution of the polar vortex in equivalent latitudes as
calcu-25
lated from ECMWF T213 data for different isentropic levels. The plates clearly show the formation of the vortex as early as in November 2002 on the 950 K isentropic level, and the downward evolution towards lower isentropic levels during the cold winter
pe-ACPD
5, 131–154, 2005 Evolution of stratospheric ozone during winter 2002/2003 over Kiruna, Sweden U. Raffalski et al. Title Page Abstract Introduction Conclusions References Tables Figures J I J I Back CloseFull Screen / Esc
Print Version Interactive Discussion riod. The minor warming at the end of December appears only as some weakening of
the vortex at 950 and 675 K, respectively, i.e., at higher levels.
Also the major warming in mid-January barely affected the lower stratosphere. While the vortex at 950 K isentropic level has weakened substantially by that warming event, this evolution does not reach down into the lower stratosphere. Although the minimum
5
temperature of the vortex at the 475 K level (as shown in Fig.2) increases, no substan-tial area loss or weakening of the vortex can be seen in Fig.3at 550 K isentropic level and below.
The two minor warmings in February and March can best be seen at 550 K and 675 K. The final warming over all altitudes in the stratosphere starts at the end of
10
March and the vortex has disappeared by the end of April.
This analysis of the vortex evolution based on the equivalent latitude method is con-sistent with the EORCU meteorological analysis (EORCU,2003).
The grey and black lines in Fig.3show the inner, outer, and mean vortex edge, while the open circles depict the relative position of Kiruna to the Arctic vortex. As can be
15
clearly seen, Kiruna was well inside the vortex for long periods in the course of the Arctic winter 2002/2003.
6. Ozone
In this study we used ozone profiles as measured by the IRF-radiometer between 28 November 2002 and 25 March 2003. The resulting time series of ozone profiles is
20
shown in the upper panel of Fig.4. While a few sporadic days with no measurements were interpolated in this graph, no measurements were taken during the entire period between 23–31 January due to technical problems.
The middle panel of the same figure shows the potential vorticity and temperature at the 475 K isentropic level (ECMWF-data). The grey shaded area gives the PV of the
25
vortex edge area between the inner and outer vortex edge as described in Sect.5.1. Very low temperatures can be seen in December when Kiruna was well inside the polar
ACPD
5, 131–154, 2005 Evolution of stratospheric ozone during winter 2002/2003 over Kiruna, Sweden U. Raffalski et al. Title Page Abstract Introduction Conclusions References Tables Figures J I J I Back CloseFull Screen / Esc
Print Version Interactive Discussion vortex and PSCs were observed (EORCU,2003).
The lower panel in Fig.4shows the stratospheric ozone columns above an altitude of 10 km for all days when measurements were performed. The red squares give the mean columns for those periods when Kiruna was well inside the polar vortex.
6.1. Ozone mini-holes in early December
5
In early December we find extraordinarily low ozone columns in our measurements. These low ozone columns coincide with the ozone mini-holes between 4 and 11 De-cember as reported byEORCU(2003). The partial column density reaches the lowest values of 163 and 160 DU respectively on December 5 and 8, something which was not observed again later during this winter. Although PSCs have been observed and ClOx
10
levels were elevated (though mostly in form of the dimer) we believe that the observed low ozone is caused by dynamical effects as described byEORCU (2003): a raise in the tropopause height, coinciding with a strong vortex and reduced ozone levels above 20 km, led to the exceptionally low ozone levels.
6.2. Ozone during the warming events
15
The strong upper stratospheric minor warming at the end of December led to increasing ozone values at those altitudes over Kiruna, which during that time was well inside the polar vortex. Temperatures and potential vorticitiy at the 475 K isentropic level stayed unaffected by this warming event.
After 18 January, the volume mixing ratios of ozone in the middle stratosphere
in-20
creased drastically, leading to extremely high values of more than 9 ppmv on 23 Jan-uary above an altitude of 30 km. At the same time, the measured stratospheric ozone columns and the temperatures at the 475 K isentropic level increased significantly. All these findings are the result of the major warming which occurred in January and trans-ported ozone rich and warm air masses from lower latitudes into the Arctic
strato-25
ACPD
5, 131–154, 2005 Evolution of stratospheric ozone during winter 2002/2003 over Kiruna, Sweden U. Raffalski et al. Title Page Abstract Introduction Conclusions References Tables Figures J I J I Back CloseFull Screen / Esc
Print Version Interactive Discussion series presented in Fig.4.
6.3. Ozone loss
In order to investigate the evolution of ozone inside the polar vortex, mean profiles were calculated for periods when Kiruna was well inside the vortex (lefthand side of Fig.5). From early December to early January, the diabatic subsidence in the middle and lower
5
stratosphere can be seen. The profiles in February and March show enhanced ozone vmr values in the middle stratosphere, remnants of the mixing processes during the major warming in January. However, no such ozone enhancement can be observed in the lower part of the profiles. On the contrary, these profiles show less ozone in the lower stratosphere below an altitude of 22 km than the profiles from late December and
10
mid January. We believe this is the result of chemical ozone depletion.
The righthand side of Fig.5shows the measured vmr inside the polar vortex at the 475 K isentropic level. The black dots are the individual measurements and the red squares are the mean values for the different periods when Kiruna was well inside the vortex. The vertical error bars give the standard error of the mean and the
horizon-15
tal error bars give the periods which were used for the respective average. First an increase of the volume mixing ratios can be observed due to the diabatic subsidence which brings ozone-rich air masses from higher altitudes to the level considered. After January the vmr values decrease due to chemical ozone depletion. Without consider-ing the effect of subsidence in the polar vortex, the cumulative ozone loss on the 475 K
20
isentropic level is about 0.5 ppmv or 16% until mid-March. After 16 March Kiruna was never again well inside the polar vortex at the 475 K isentropic level (see Fig.3).
In order to calculate the ozone loss that is not masked by dynamical processes, we must match the ozone values presented in the lefthand side of Fig.5with a dynamic tracer. N2O is widely used as a long-lived tracer to investigate dynamical effects such
25
as the diabatic subsidence inside the polar vortex. N2O has no stratospheric sources and has a lifetime in the lower stratosphere of about one year. Thus the abundance of N2O can be considered to be constant for the time period of a winter/spring season.
ACPD
5, 131–154, 2005 Evolution of stratospheric ozone during winter 2002/2003 over Kiruna, Sweden U. Raffalski et al. Title Page Abstract Introduction Conclusions References Tables Figures J I J I Back CloseFull Screen / Esc
Print Version Interactive Discussion Since the IRF millimetre wave radiometer does not yet provide N2O-data, we have
used vortex-averaged N2O data from the Sub-Millimetre Radiometer (SMR) on board the Odin satellite (Urban et al.,2004) to calculate the diabatic subsidence for different altitude levels. The left hand side of Fig.6shows the vortex-averaged N2O data. For better comparison these data are also averaged for the periods when Kiruna was well
5
inside the Arctic vortex. The isopleths between 150 and 50 ppbv show a nearly linear subsidence after mid-December. The subsidence from early December to the end of March amounts to between 3.5 and 4 km for the different N2O isopleths. This steady subsidence gives evidence that no significant mixing processes took place at these levels during the warming events during the course of the winter. Only the 25 ppbv
iso-10
pleth shows some deviation from the linear subsidence of the other isopleths between early January and early February. This is probably the result of some mixing processes at this level during the major warming in January.
Our ground-based measurements over a longer time period in principle give vortex-averaged values (as long as only data from inside the vortex are used). Thus, binning
15
of Odin’s N2O in the same way as our ozone data yields an estimate for the vortex-averaged diabatic subsidence which we can use to estimate the chemical ozone loss during the winter period. The righthand side of Fig.6shows the ozone volume mixing ratios of the ground-based ozone measurements on the N2O isopleths from Odin. The vertical error bars are again the standard error of the mean and the horizontal error
20
bars give the periods used for averaging. In early December a slight increase of ozone vmr values can be seen on all N2O isopleths. This increase cannot be explained by dynamical processes since they should have been removed by using N2O as a dynamic tracer. Probably this increase is an artefact introduced by the limited vertical resolution of the ground-based millimetre wave radiometer: when air masses subside, the ozone
25
profile is compressed in the vertical direction. Thus, the higher ozone volume mixing ratios from higher altitudes are partly mapped into the considered (lower) level due to the limited resolution even if the considered level is also subsided.
ACPD
5, 131–154, 2005 Evolution of stratospheric ozone during winter 2002/2003 over Kiruna, Sweden U. Raffalski et al. Title Page Abstract Introduction Conclusions References Tables Figures J I J I Back CloseFull Screen / Esc
Print Version Interactive Discussion ozone-tracer relationship is not very well established in the initial phase of the winter,
giving rise to a quite large uncertainty since the selection of the early vortex profiles determines the early winter ozone-tracer relations (Harris et al.,2002).
In order to avoid the early winter uncertainties in the ozone-tracer relationship we use mid-December ozone values as initial values for an ozone-tracer relationship
de-5
ploying Odin N2O-data. Some ozone loss prior to mid-December which might have been excluded this way, however, should be quite limited due to the lack of sunlight. This assumption is supported byTilmes et al.(2003), who found large column ozone loss starting in January 2003 using the tracer-tracer correlation technique.
After mid-December, ozone concentrations show a general decrease due to
chem-10
ical ozone loss. One cause for the early ozone loss even in January might be the geographical extension of the vortex to lower latitudes. Thus, the preprocessed strato-spheric air masses were exposed to stronger solar irradiation than in the polar region, resulting in photochemistry and ozone depletion. The cumulative ozone loss between mid-December and mid-March amounts to 1.1±0.1 ppmv on the 150 ppbv N2O isopleth
15
(20.0–16.5 km) and 1.7±0.1 ppmv on the 50 ppbv N2O isopleth (23.0–19.0 km). However we can see two deviations from the overall evolution:
- The lowest altitude depicted by the 150 ppbv N2O isopleth shows no onset of ozone loss before mid-January. This might be due to the only sporadic PSC occa-sions at these low altitudes (18–19 km) during late-December and until mid-January
20
(seeEORCU,2003).
- The evolution of the ozone volume mixing ratio on the 25 ppbv N2O isopleth (24.5– 20.0 km) deviates slightly in that it shows a smaller decrease after the major warming event in January compared to the other levels. We think this is the result of the mixing processes during the warming event.
25
The ozone loss derived from ground-based measurements can be compared to Odin ozone data. Unfortunately Odin’s ozone vmr on N2O isopleths is only available on the 25 ppbv and 50 ppbv N2O isopleths and only between December and mid-February. For this comparison Odin N2O data is deployed for a tracer correlation with
ACPD
5, 131–154, 2005 Evolution of stratospheric ozone during winter 2002/2003 over Kiruna, Sweden U. Raffalski et al. Title Page Abstract Introduction Conclusions References Tables Figures J I J I Back CloseFull Screen / Esc
Print Version Interactive Discussion the ground-based millimetre wave measurements at Kiruna. We find an ozone loss
be-tween mid-December and mid-February of 0.5–0.2 ppmv on the 25 ppbv isopleth and 0.9–0.2 ppmv on the 50 ppbv isopleth, respectively. The measured loss on the 25 ppbv isopleth is probably affected by the mixing processes during the warming event in Jan-uary. Nevertheless, these values compare well to the vortex-wide ozone depletion
5
measured by Odin in the same period (Urban et al.,2004). Unfortunately Odin data do not allow ozone loss calculation for lower altitudes due to the limited altitude range of the ozone measurements analysed so far.
The cumulative ozone loss in the lower stratosphere between mid-December and mid-March is of the same order as the ozone loss which was detected by microwave
10
radiometry and FTIR measurements in Kiruna in the cold arctic winter of 1999/2000 (Kopp et al.,2002). The relatively high ozone loss in the winter of 2002/2003 fits well to the meteorological situation of this winter with very low temperatures in early December and the reported chlorine activation (Urban et al.,2004) and denitrification (EORCU,
2003) mainly in January and lasting to mid-March.
15
7. Summary and conclusions
The winter of 2002/2003 was unusually cold in the lower stratosphere in early De-cember, and minimum temperatures in the polar vortex stayed below PSC-formation temperature until mid-January. The minor warmings in December, February and March and the major warming in January weakened the Arctic vortex. Using the potential
vor-20
ticity against equivalent latitudes and averaged Odin N2O data we show that mixing processes during these warming events were only important above the 550 K isen-tropic level or above the 50 ppbv N2O isopleth, respectively.
Almost continuous ozone measurements have been taken using the 195–225 GHz radiometer at Kiruna from the end of November 2002 to the end of March 2003. From
25
the measurements we retrieved a time series of ozone vmr profiles and stratospheric columns.
ACPD
5, 131–154, 2005 Evolution of stratospheric ozone during winter 2002/2003 over Kiruna, Sweden U. Raffalski et al. Title Page Abstract Introduction Conclusions References Tables Figures J I J I Back CloseFull Screen / Esc
Print Version Interactive Discussion In early December 2002 we found extraordinarily low ozone column densities over
Kiruna. These low values coincide well with the ozone mini-holes reported byEORCU
(2003) for this time span.
The mixing processes during the warming events in December and in particular in January led to increasing ozone mixing ratios in the middle and upper stratosphere.
5
The maximum was reached in January with more than 9 ppmv above an altitude of 30 km; this is an extraordinarily high value. These mixing processes are also clearly visible in the measured ozone profiles which were averaged for periods when Kiruna was well inside the polar vortex.
In contrast, the ozone concentration in the lower stratosphere decreases after
Jan-10
uary due to chemical depletion. One reason for this early ozone loss might be the exposure of pre-processed stratospheric vortex air masses to solar irradiation at lower latitudes with subsequent photochemical ozone depletion.
At the 475 K isentropic level the cumulative loss amounts to about 0.5 ppmv, but part of the loss is masked by diabatic subsidence of vortex air. To account for this effect, we
15
have used N2O data as measured by the Odin satellite to calculate the vortex averaged diabatic subsidence. The N2O isopleths in the lower stratosphere show a subsidence between 3.5 and 4 km from early-December 2002 to mid-March 2003. We could find no evidence for mixing during the warming events in the course of the winter below the 25 ppbv N2O isopleth. On the 25 ppbv isopleth we detected some indications for mixing
20
during the major warming in January.
We used the diabatic subsidence as calculated from the Odin N2O data to esti-mate the ozone loss as detected by the ground-based microwave measurements. The cumulative ozone loss between mid-December and mid-March amounts to between 1.1±0.1 ppmv and 1.7±0.1 ppmv, respectively, depending on altitude.
25
For comparison with Odin data during the period mid-December to mid-February we evaluated ozone loss on the 50 ppbv and 25 ppbv N2O isopleths in detail. In this case the ozone loss calculated from ground-based measurements amounts to 0.9±0.2 ppmv and and 0.5±0.2 ppmv, respectively. These values compare well to the ozone
deple-ACPD
5, 131–154, 2005 Evolution of stratospheric ozone during winter 2002/2003 over Kiruna, Sweden U. Raffalski et al. Title Page Abstract Introduction Conclusions References Tables Figures J I J I Back CloseFull Screen / Esc
Print Version Interactive Discussion tion measured by Odin/SMR. The losses are in the same order as those measured
in the cold Arctic winter of 1999/2000 in Kiruna by microwave radiometry and FTIR measurements.
Acknowledgements. We would like to thank the ECMWF and NILU for providing the PV and
temperature data. The authors also thank the NCEP for providing temperature and pressure
5
data used for the retrievals via the Goddard automailer system. The authors are grateful to the Swedish-French team of the Odin/SMR experiment for providing the vortex mean N2O data. We also thank the referees for their helpful comments and suggestions. This work has been supported by the Swedish Research Council. It has also been partially funded by the BMBF/DLR (contract FKZ 50EE0011).
10
References
Berg, H., Krupa, R., Hochschild, G., Kopp, G., and Kuntz, M.: Millimeter wave radiometer with adjustable internal calibration load for high resolution measurements of stratospheric constituents, Proceedings of 2nd ESA Workshop on Millimetre Wave Technology and Appli-cations: Antennas, Circuits and Systems, Espoo, 372–377, 1998. 133
15
Feist, D. G.: The Bernese Atmospheric Multiple Catalog Access Tool (BEAMCAT): a tool for users of popular spectral line catalogs, J. Quant. Spectrosc. Radiat. Transfer, 85, 57–97, 2004. 136
Harris, N. R. P., Rex, M., Goutail, F., Knudsen, B. M., Manney, G. L., M ¨uller, R., von der Gathen, P.: Comparison of empirically derived ozone losses in the Arctic vortex, J. Geophys. Res.,
20
107, D20, doi:10.1029/2001JD000482, 2002. 143
Kanamitsu, M.: Description of the NMC global data assimilation and forecast system, Weather and Forecasting, 4, 335–342, 1989. 136
Karhu, J. A., Taalas, P., Damski, J., Kaurola, K., Ginzburg, M., Villanueva, C. A., Piacentini, E., and Garcia, M.: Vertical distribution of ozone at Marambio, Antarctic Peninsula, during
25
1987–1999, J. Geophys. Res., 108, D17, 4545, doi:10.1029/2003JD001435, 2003. 138
Kopp, G.: The Karlsruhe Millimeterwave Forward Model, Proceedings of the second Inter-national Workshop on Millimeter and Sub-Millimeter Wave Radiative Transfer Modeling,
ACPD
5, 131–154, 2005 Evolution of stratospheric ozone during winter 2002/2003 over Kiruna, Sweden U. Raffalski et al. Title Page Abstract Introduction Conclusions References Tables Figures J I J I Back CloseFull Screen / Esc
Print Version Interactive Discussion Osterholz-Scharmbeck, Germany, 19–22 June 2000, Logos Verlag Berlin, ISBN
3-89722-585-9, ISSN 1615-6862, 2001. 136,137
Kopp, G., Berg, H., Blumenstock, Th., Fischer, H., Hase, F., Hochschild, G., H ¨opfner, M., Kouker, W., Reddmann, Th., Ruhnke, R., Raffalski, U., and Kondo, Y.: Evolution of ozone and ozone related species over Kiruna during the THESEO 2000 – SOLVE campaign retrieved
5
from ground-based millimeter wave and infrared observations, J. Geophys. Res., 107, 8308, doi:10.1029/2001JD001064, 2002. 144
Krupa, R., Hochschild, G., Fischer, H., and Wiesbeck, W.: Balanced Calibration Technique with an Internal Reference Load for Ground Based Millimeter Wave Radiometry, 1998 IEEE In-ternational Geoscience and Remote Sensing Symposium Proceedings, I, 387–389, Seattle,
10
July 1998. 135
EORCU: European Ozone Research Coordinating Unit, 14 Union Road, Cambridge, CB2 1HE,
UK,http://www.ozone-sec.ch.cam.ac.uk/EORCU/Reports/wr0203.pdf, 2003. 138,139,140,
143,144,145
Nash, E. R., Newmann, P. A., Rosenfield, J. E., and Schoeberl, M. R.: An objective
determi-15
nation of the polar vortex using Ertel’s potential vorticity, J. Geophys. Res., 101, 9471–9478, 1996. 133,137
Parrish, A., de Zafra, R. L., Solomon, P. M., and Barett, J. W.: A ground-based technique for millimetre wave spectroscopic observations of stratospheric trace constituents, Radio Sci., 23, 106–118, 1988. 134
20
Pickett, H. M., Poynter, R. L., Cohen, E. A., Delitsky, M. L., Pearson, J. C., and M ¨uller, H. S. P.: Submillimeter, millimetre, and microwave spectral line catalog, J. Quant. Spectrosc. Radiat. Transfer, 60, 883–890, 1998. 136
Rodgers, C. D.: Retrieval of Atmospheric Temperature and Composition from Remote Mea-surements of Thermal Radiation, Rev. Geophys. Space Phys., 14, 609–624, 1976. 136
25
Rothman, L. S., Rinsland, C. P., Goldman, A., Massie, S. T., Edwards, D. P., Flaud, J.-M., Perrin, A., Camy-Peyret, C., Dana, V., Mandin J.-Y., Schroeder, J., McCann, A., Gamache, R. R., Wattson, R. B., Yoshino, K., Chance, K. V., Jucks, K. W., Brown, L. R., Nemtchinov, V., and Varanasi, P.: The HITRAN Molecular Spectroscopic Database and HAWKS (HITRAN Atmospheric Workstation): 1996 Edition, J. Quant. Spectrosc. Radiat. Transfer, 60, 5, 665–
30
710, 1998. 136
Tilmes, S., M ¨uller, R., Grooß, J.-U., H ¨opfner, M., Toon, G. C., and Russell III, J.M.: Very early chlorine activation and ozone loss in the Arctic winter 2002–2003, Geophys. Res. Lett., 30,
ACPD
5, 131–154, 2005 Evolution of stratospheric ozone during winter 2002/2003 over Kiruna, Sweden U. Raffalski et al. Title Page Abstract Introduction Conclusions References Tables Figures J I J I Back CloseFull Screen / Esc
Print Version Interactive Discussion 23, 2201, ASC 7-1–ASC 7-4, 2003. 143
Urban, J., Lauti ´e, N., Le Flochmo ¨en, E., Murtagh, D., Ricaud, P., De La No ¨e, J., Dupuy, E., Drouin, A., El Amraoui, L., Eriksson, P., Frisk, U., Jim ´enez, C., Kyr ¨ol ¨a, E., Llewellyn, E. J., M ´egie, G., Nordh, L., and Olberg, M.: The Northern Hemisphere Stratospheric Vortex during the 2002–2003 Winter: Subsidence, Chlorine Activation and Ozone Loss observed by the
5
ACPD
5, 131–154, 2005 Evolution of stratospheric ozone during winter 2002/2003 over Kiruna, Sweden U. Raffalski et al. Title Page Abstract Introduction Conclusions References Tables Figures J I J I Back CloseFull Screen / Esc
Print Version Interactive Discussion 10 20 30 40 50 60 0 50 100 150 Altitude [km]
Vertical resolution [km] Sensitivity [%] 10 20 30 40 50 60 10 15 20
Fig. 1. Vertical resolution (left) and sensitivity of the ozone measurements as calculated from
the averaging kernels of the measurements of 20 January 2003. The dashed red line depicts the 75% sensitivity threshold defining the altitude range where the measurements provide sig-nificant information.
ACPD
5, 131–154, 2005 Evolution of stratospheric ozone during winter 2002/2003 over Kiruna, Sweden U. Raffalski et al. Title Page Abstract Introduction Conclusions References Tables Figures J I J I Back CloseFull Screen / Esc
Print Version Interactive Discussion
Tice
TNAT
Fig. 2. Minimum temperatures north of 40◦N at the 475 K isentropic level (ECMWF-data). The shaded area depicts the variability for the winters 1992/1993–2001/2002. The dashed lines depict PSC formation temperatures for TNATand TICE.
ACPD
5, 131–154, 2005 Evolution of stratospheric ozone during winter 2002/2003 over Kiruna, Sweden U. Raffalski et al. Title Page Abstract Introduction Conclusions References Tables Figures J I J I Back CloseFull Screen / Esc
Print Version Interactive Discussion Equivalent Latitude [°] Day of year 2003
Fig. 3. Evolution of the polar vortex in terms of equivalent lat-itudes. The white lines describe the inner and outer edge of the vortex, respectively, while the black line describes the mean vortex edge, i.e. the strongest gradient in PV for the particular day. The colour coding shows the strength of the vortex in PVU. The open circles depict the PV over Kiruna on the particu-lar measurement days and refer to the underlying PV colour cod-ing, showing how far away from or how deep inside the vortex a measurement has been taken.
ACPD
5, 131–154, 2005 Evolution of stratospheric ozone during winter 2002/2003 over Kiruna, Sweden U. Raffalski et al. Title Page Abstract Introduction Conclusions References Tables Figures J I J I Back CloseFull Screen / Esc
Print Version Interactive Discussion
> vmr [ppmv]
inside vortex vortex edge region
outside vortex
Fig. 4. Evolution of ozone between 28 November 2002 and 25 March 2003. The upper panel
shows the time series of ozone vmr profiles. Between 23–31 January there were no data due to technical problems. The middle panel shows the potential vorticity and temperature at the 475 K isentropic level (ECMWF-data). The grey shaded area gives the PV of the vortex edge area. The lower panel shows the stratospheric ozone columns above an altitude of 10 km. The red squares give the mean values for the periods when Kiruna was well inside the vortex.
ACPD
5, 131–154, 2005 Evolution of stratospheric ozone during winter 2002/2003 over Kiruna, Sweden U. Raffalski et al. Title Page Abstract Introduction Conclusions References Tables Figures J I J I Back CloseFull Screen / Esc
Print Version Interactive Discussion
Fig. 5. Evolution of the ozone vmr inside the polar vortex during the winter of 2002/2003. The
plot on the lefthand side shows averaged profiles for periods when Kiruna was well inside the vortex. The volume mixing ratios at the 475 K isentropic level are presented on the righthand side. The red error bars presented here are solely due to the data averaging over certain evaluation periods, that is, the statistical error or the standard error of the mean. Blue bars depict the periods used for the mean, containing vortex core measurements only.
ACPD
5, 131–154, 2005 Evolution of stratospheric ozone during winter 2002/2003 over Kiruna, Sweden U. Raffalski et al. Title Page Abstract Introduction Conclusions References Tables Figures J I J I Back CloseFull Screen / Esc
Print Version Interactive Discussion
Fig. 6. The plot on the lefthand side shows the diabatic subsidence of vortex air at different
N2O levels as measured by Odin/SMR, averaged according to the periods when Kiruna was well inside the vortex. Mean ozone volume mixing ratios as measured by the ground-based microwave radiometer on Odin N2O isopleths are shown on the righthand side. Error bars solely depict the statistical error of the averaging process. Blue bars depict the periods used for the mean, containing vortex core measurements only.