Publisher’s version / Version de l'éditeur:
Proceedings of the Combustion Institute - Canadian Section Spring Technical
Meeting, 2009, 2009
READ THESE TERMS AND CONDITIONS CAREFULLY BEFORE USING THIS WEBSITE. https://nrc-publications.canada.ca/eng/copyright
Vous avez des questions? Nous pouvons vous aider. Pour communiquer directement avec un auteur, consultez la
première page de la revue dans laquelle son article a été publié afin de trouver ses coordonnées. Si vous n’arrivez pas à les repérer, communiquez avec nous à [email protected].
Questions? Contact the NRC Publications Archive team at
[email protected]. If you wish to email the authors directly, please see the first page of the publication for their contact information.
NRC Publications Archive
Archives des publications du CNRC
This publication could be one of several versions: author’s original, accepted manuscript or the publisher’s version. / La version de cette publication peut être l’une des suivantes : la version prépublication de l’auteur, la version acceptée du manuscrit ou la version de l’éditeur.
Access and use of this website and the material on it are subject to the Terms and Conditions set forth at
Effect of initial and operating conditions on soot emissions from an
HCCI engine
Hosseini, Vahid; Neill, W. Stuart; Thomson, Kevin A.; Chippior, Wallace L.
https://publications-cnrc.canada.ca/fra/droits
L’accès à ce site Web et l’utilisation de son contenu sont assujettis aux conditions présentées dans le site LISEZ CES CONDITIONS ATTENTIVEMENT AVANT D’UTILISER CE SITE WEB.
NRC Publications Record / Notice d'Archives des publications de CNRC:
https://nrc-publications.canada.ca/eng/view/object/?id=56883e9d-bea9-4495-8de6-04646ee05c84 https://publications-cnrc.canada.ca/fra/voir/objet/?id=56883e9d-bea9-4495-8de6-04646ee05c84_____________________________________________ Proceedings of the Combustion Institute – Canadian Section Spring Technical Meeting Université de Montréal, Québec May 11-13, 2009
Effect of Initial and Operating Conditions on Soot Emissions from
an HCCI Engine
Vahid Hosseini
*, W. Stuart Neill, Kevin A. Thomson, Wallace L. Chippior
Institute for Chemical Process and Environmental Technology, National Research Council Canada, 1200 Montreal Road, Ottawa, Ontario, K1A 0R6
1. Summary
Homogeneous Charge Compression Ignition (HCCI) combustion is generally characterized by near-zero soot and NOx emissions. For this reason, this combustion strategy is being considered for use in advanced technology engines in order to meet increasingly stringent emissions regulations. However, soot can be produced in an HCCI engine due to in-cylinder composition (air-fuel ratio, exhaust gas recirculation rate) or non-uniformities in temperature. In this study, soot emissions from an HCCI engine were measured by laser-induced incandescence (LII) over a range of initial and operating conditions using an ultra-low sulphur diesel fuel.
A variable compression ratio Cooperative Fuels Research (CFR) engine connected to an eddy-current dynamometer was used for these experiments. The engine was equipped with an air-blast atomizer and vaporizer in the intake manifold to prepare the fuels prior to entering the combustion chamber. A cooled exhaust gas recirculation (EGR) loop and simulated turbocharging were provided as means to dilute the combustion process. Soot emissions from the engine were measured with a range of fuel vaporizer temperatures, in-cylinder compositions (air-fuel ratio, exhaust gas recirculation rates) and engine speeds. It was found that soot emissions increased rapidly when the vaporizer temperature was reduced below 200oC using a commercial ULSD fuel. Soot emissions also increased at lower engine speeds. Soot emissions were found to increase as the air-fuel ratio was decreased toward the knocking limit and the EGR rate was reduced. Knocking led to significantly higher soot emissions. This is a significant challenge because the highest fuel conversion efficiency occurs near the knocking limit.
2. Introduction
Unlike conventional diesel combustion engines, homogeneous charge compression ignition (HCCI) combustion offers the potential of near zero NOx and soot emissions.1-4 HCCI combustion can be achieved either by premixing fuel in the intake or by direct injection of the fuel early in the compression stroke. For premixed HCCI combustion, n-heptane has been used widely as it can be atomized in the intake system with relatively low injection pressure.5 Regular diesel fuels can be injected directly into the cylinder early in the compression stroke by means of a common rail diesel fuel injection system.6 However, the option of diesel-fueled premixed HCCI combustion has not yet been examined extensively due to the inherent technical difficulty of atomizing/vaporizing diesel fuel inside the intake port at low port fuel injection pressures. In doing so, there is a high likelihood of in-homogeneity and incomplete fuel vaporization that could cause soot emissions even in fully premixed HCCI combustion. Thus, while HCCI is known for soot-free combustion, under some operating conditions soot formation can occur and it is unlikely to be oxidized at characteristically low HCCI combustion temperatures.
The objective of this study is to explore the limits under which soot is produced in fully-premixed HCCI combustion and to identify the effect of operating parameters on soot emissions. Also, it is aimed at finding any possible interaction between soot, other emissions and engine operating parameters.
*
3. Experimental setup
The Cooperative Fuels Research (CFR) engine used for this study is a single-cylinder, four-stroke, variable compression ratio engine with bore × stroke of 82.55 × 114.3 mm. The engine setup was modified from the standard CFR configuration by the addition of an air- assist port fuel injection system and hardware to control critical engine parameters such as intake temperature, air/fuel ratio, intake and exhaust pressures, and exhaust gas recirculation. An in-house fuel vaporizer was fitted to the outlet of the fuel injector to vaporize the lighter diesel fuel components, which permitted HCCI combustion with near-zero soot emissions. Figure 1 shows details of the fuel injector/vaporizer. The fuel vaporizer is capable of delivering the fuel spray at any point within a wide temperature band. By adjusting the fuel vaporizer temperature (Tvap) it is possible to determine the fraction of vaporized fuel to total fuel per injection. Operating at low
Tvap causes incomplete vaporization, and hence, the potential for soot particles in the exhaust stream.
Operation at high Tvap causes fuel fouling on the heater surfaces inside the vaporizer. Hence, based on fuel
properties (mostly volatility), a minimum critical temperature may be determined for each fuel to avoid soot emissions while keeping the temperature below fuel fouling limits. The low and high temperature limits of the fuel vaporizer are the subject of a separate study.
All experiments were performed under steady state conditions. An AVL 415 Variable Sampling Smoke Meter and an Artium Technology LII 200 were used to measure soot emissions. The cylinder pressure data was acquired with 0.2 CAD resolution for 300 consecutive engine cycles. Combustion parameters and resultant statistics were calculated for all 300 collected cycles.
4. Results and discussion
LII measurement limits
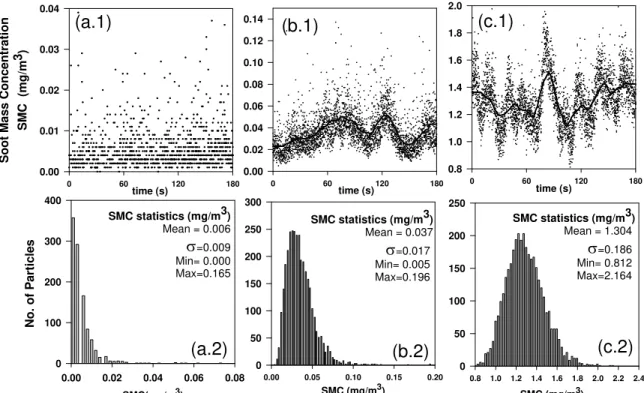
LII was used to study soot emissions at extremely low concentrations which were not detectable with the low sensitivity AVL smoke meter. Single shot LII measurements were made at a 20 Hz rate over a sample period of 180 s. For comparison, three sample cases of operating conditions 6, 7, and 10 were selected from the experimental data shown in Figure 3 which represent increasing soot emission rates, with the relative highest being the only one detectable with the AVL smoke meter. Figure 2 compares the soot measurements in the three cases using the LII instrument with the upper plots showing soot mass concentration (SMC) as a function of time and the lower plots represent the same information as histograms with statistics. From Figure 2-a to Figure 2-c, SMC increases by an order of magnitude. In Figure 2-a, the measurements are scattered without a particular pattern and the statistical analysis indicated a standard deviation greater than mean. For the intermediary case 7, in Figure 2-b, the SMC was more than 0.02 mg/m3 and LII measurement appear less scattered though the standard deviation was about 50% of the mean.
Figure 1: Schematic of enhanced fuel injector/vaporizer.
For the highest soot emissions case 10, shown in Figure 2-c, a normal distribution of values for SMC with low standard deviations is observed. It is concluded that the LII 200 instrument cannot accurately report soot emissions below 0.02 mg/m3.
Effect of fuel vaporizer temperature
The temperature of the fuel vaporizer can be controlled to achieve increasing levels of fuel vaporization. For each fuel, the degree of vaporization was monitored using the AVL smoke meter while increasing the vaporizer temperature. During the tests all initial conditions were kept constant while Tair was
adjusted relative to Tvap such that Tmix
remained constant. Figure 4 exhibits the vaporizer temperature effect on soot formation in HCCI combustion for a fuel at Tmix = 61oC.
time (s)
0 60 120 180
Soot Mass Concent
rati o n SMC (mg/ m 3) 0.00 0.01 0.02 0.03 0.04 SMC(mg/m3) 0.00 0.02 0.04 0.06 0.08 N o . o f P a rtic le s 0 100 200 300 400 SMC statistics (mg/m3) Mean = 0.006 σ=0.009 Min= 0.000 Max=0.165 time (s) 0 60 120 180 0.00 0.02 0.04 0.06 0.08 0.10 0.12 0.14 SMC (mg/m3) 0.00 0.05 0.10 0.15 0.20 0 50 100 150 200 250 300 time (s) 0 60 120 180 0.8 1.0 1.2 1.4 1.6 1.8 2.0 SMC (mg/m3) 0.8 1.0 1.2 1.4 1.6 1.8 2.0 2.2 2.4 0 50 100 150 200 250 SMC statistics (mg/m3) Mean = 1.304 σ=0.186 Min= 0.812 Max=2.164 SMC statistics (mg/m3) Mean = 0.037 σ=0.017 Min= 0.005 Max=0.196
(a.1)
(a.2)
(b.1)
(b.2)
(c.2)
(c.1)
Figure 2: soot mass concentration (SMC) measured over the period of 180 s, Statistical analyses for three cases of points 6, 7, and 10 of Figure 4. ULSD, N=900 rpm, EGR=0%, AFR=51.0, CR=11.0.
Data obtained by both AVL smoke meter and LII are shown for comparison. It is observed that when the vaporizer temperature increases above a certain threshold value, the soot concentration of the engine exhaust stabilizes at a low constant level which remains insensitive to vaporizer temperature over a broad temperature range. However, below the threshold, soot concentration in the exhaust stream increases with decreasing vaporizer temperature. The transition point is called the fuel vaporizer critical temperature (Tcr)
in this paper.
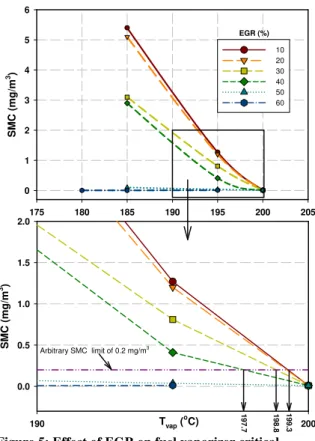
The influence of EGR on Tcr is summarized in Figure 5 that includes the complete data range and a
magnified sub-section. Increasing EGR fraction from 10% to 60% reduced Tcr. As an example, if the soot
emissions limit is assumed as 0.2 mg/m3, Tcr was reduced from 199.3oC to 197.7oC, when the EGR fraction
was increased from 20% to 40%. At very high EGR fractions, no soot formation occurred at very low Tvap
due to the low combustion temperature. However, it should be noted that HC and CO emissions were extremely high when excessive EGR was used. The influence of EGR on soot emissions is discussed in greater detail below.
Operating Condition No.
1 2 3 4 5 6 7 8 9 10 11 T e m p er at ure( oC) 0 50 200 250 300 350
Vaporizer Temperature, Tvap Intake air (and EGR) Temperature, Tair Intake mixture (air,fuel, EGR) Temperature,Tmix
Figure 3: The operating temperatures for the vaporizer temperature sweep, ULSD, N=900 rpm, EGR=0%, AFR=51.0, CR=11.0. Vaporizer Temperature (o C) 160 180 200 220 240 260 280 300 320 so ot ma ss c o n c e n tr at io n, S M C (m g/ m 3) -0.5 0.0 0.5 1.0 1.5 2.0 2.5 3.0 AV L F S N 0.0 0.1 0.2 0.3 0.4 LII AVL
Figure 4: Determining the minimum vaporizer temperature based on soot emissions datra. ULSD, N=900 rpm, EGR=0%, AFR=51.0, CR=11.0.Note that the Y-axis scale for the AVL FSN is slightly shifted.
175 180 185 190 195 200 205 SMC (mg/m 3) 0 1 2 3 4 5 6 Tvap (oC) 190 200 SMC (mg/m 3) 0.0 0.5 1.0 1.5 2.0 10 20 30 40 50 60 Arbitrary SMC limit of 0.2 mg/m3 19 7.7 19 9.3 19 8.8 EGR (%)
Figure 5: Effect of EGR on fuel vaporizer critical temperature (Tcr) for soot-free combustion.
AFR 14 16 18 20 22 24 26 28 SM C ( m g /m 3) 0 2 4 6 8 50 55 60 EGR (%)
Figure 6 : Effect of AFR and EGR on soot mass concentration. ULSD, N=900 rpm, CR=10.0, Tvap=195 o
C, MAP=200 kPa, Tmix=70 o
C.
Clearly, the phenomena observed in Figure 4 were caused by the incomplete vaporization of fuel. When the vaporizer temperature decreases beyond Tcr, more fuel droplets form and enter the cylinder,
creating fuel-rich pockets. These in turn enhance the formation the soot. Above Tcr, all fuel is vaporized
in time to be burned during the main combustion stage and a constant low level of soot emission is observed.
Combined effect of EGR and AFR on soot emissions
Figure 6 shows the combined effect of AFR and EGR on soot emissions. The vaporizer temperature was set at 195oC to have detectable levels of soot while examining the AFR-EGR operating region. At any constant AFR, soot concentration decreased with increasing EGR. This is caused by several factors. Firstly, the addition of EGR reduces the concentrations of fuel (at any constant AFR level) which in turn reduces soot precursors, which results in a lower soot formation rate. Secondly, the higher specific heat of EGR (thri-atomic molecules of H2O and CO2 replace diatomic N2 molecules) reduces compression and peak
combustion temperatures which result in reduced soot formation and oxidation rates. In low to medium EGR ranges, the soot oxidation rate is reduced more than the soot formation rate, and hence increased soot emissions are observed in conventional diesel combustion. However, at high EGR rates (typical of HCCI combustion conditions), the soot formation rate becomes so low that the effect of the reduced soot oxidation rate becomes insignificant.7 Lastly, some components of EGR, such as CO2, H2O and CO, may
participate in chemical reactions. For example in a numerical study of a counter flow diffusion flame, Liu et al 8 showed that CO2 participates in chemical reactions by suppressing chemical soot formation through
reducing the concentration of acetylene and flame temperature and the conversion of CO2 by hydrogen
atom to hydroxyl, in turn prompting oxidation of soot precursors in the soot formation region. Further, it was shown by Guo et al 9 that the chemical effects of CO2 addition suppresses soot inception and surface
growth rate, but has negligible effect on the soot oxidation process.
Although some researchers argue that the addition of EGR may slow the oxidation of soot particles and thus increase soot emission, apparently this is not the case in HCCI combustion. This seems to be the key difference between soot formation in conventional diesel combustion and premixed HCCI combustion. In conventional diesel combustion, any attempt to decrease NOx formation by increasing EGR, decreases soot oxidation during the expansion stroke resulting in an increase in soot emissions. Huestis et al7 reported that by increasing EGR from 21% intake O2 concentration to 12% intake O2 concentration, soot was increased,
but further EGR increase to 8% intake O2 concentration reduced soot. Below 8% intake O2 concentration,
soot was not detectable with the in-cylinder optical soot measurement method. The same trend was reported by Idicheria et al, 10 and Tao et al.11
At any constant EGR rate, soot concentration increases with decreasing AFR. This is caused by three factors. Firstly, fuel vapor pressure is increased with decreasing AFR, leading to a lower vaporization rate.
Secondly, decreasing AFR creates higher in-cylinder temperature enhancing soot formation. Lastly, lower AFR equates to higher carbon content of the mixture,which promotes soot formation reactions.
Effect of engine speed on soot emissions
Figure 7 illustrates the effect of engine speed on soot emissions. Speed sweeps were performed twice. First, Tmix was kept constant and speed was increased while CA50 was not controlled. Then, while the speed was
increased, CA50 was kept constant by increasing Tmix. As indicated in Figure 7, the results are largely the
same for the two methods with soot mass concentration decreasing with increasing engine speed.
speed (rpm) 600 800 1000 1200 SMC ( m g/m 3) 0 5 10 15 20 25 30
Constant Tmix, Variable CA50 Variable Tmix, Constant CA50
Figure 7: Effect of speed on soot mass concentration, ULSD, CR=10.0, Tvap=195oC, EGR=42%, AFR=26.
The mixing process between fuel-rich zones and lean zones is intensified with increasing engine speed. This may be the primary reason that soot concentration decreases with increasing engine speed. In addition, increasing engine speed also decreases the residence time of the mixture inside the cylinder, slightly decreases the peak combustion temperature and hence, it reduces both soot formation rate and soot formation. It is interesting to note that soot concentration decreases with increasing engine speed even when CA50 is constant by adjusting Tmix. This suggests that the
effect of engine speed on soot emissions is stronger than both combustion timing and mixture temperature under the examined conditions.
Table 1: constant speed-load conditions.
Speed =900 rpm Speed=1250 rpm Speed =1600 rpm
IMEP =6 bar Mode 1 Mode 4 Mode 7 MAP = 2 bar
IMEP = 4 bar Mode 2 Mode 5 Mode 8 MAP =1.5 bar
IMEP = 2 bar Mode 3 Mode 6 Mode 9 MAP =1.0 bar
Soot emissions at constant speed-load conditions
A set of constant speed-load conditions were examined using four various diesel fuels. Table 1 il the experimental conditions for constant speed-load conditions.
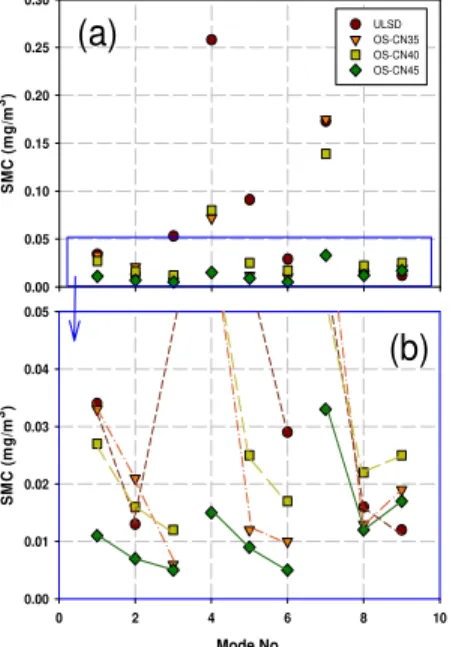
Figure 8 shows the effect of operating conditions on soot emissions. Figure 8-b is a magnificat lustrates
ion of
oot emissions.
Soot-NOx relationship
Figure 8-a. Most of experimental results as indicated in Figure 8-b are below the LII 200 SMC measurement confidence level of 0.02 mg/m3 as discussed under Figure 3. However, a general trend of decreased soot as load is decreased can be observed. Note that according to Table 1, load is decreased at constant speed from modes 1 to 3, modes 4 to 6, and modes 7 to 9.
The same trend is observed for SMC in Figure 8-b. It is difficult to obtain a trend for effect of fuel chemistry (in this case the effect of processing severity of oil sands diesel fuels) on soot emissions. However the highest cetane number fuel (which was also the most volatile) produced the lowest s
SMC
(
m
g/
m
The NOx-soot trade-off has been studied mostly for diffusion flames and conventional diesel combustion systems due to the inherent difficulty of achieving simultaneous reduction of NOx and soot emissions.12 Typically both NOx and soot emissions are extremely low in HCCI combustion. Figure 9 shows the relation between NOx and soot while the vaporizer temperature sweep was performed. With decreasing vaporizer temperature, both NOx and soot increased considerably. The increase in soot emissions has been explained above. Numerical simulations by Guo et al 13, 14 in ethylene/air diffusion flames have indicated that while NOx formation does not have a significant effect on soot, soot formation affects NOx emissions through the radiation induced thermal effect and the reaction induced chemical effect.
3) 0.00 0.05 0.10 0.15 0.20 0.25 0.30 ULSD OS-CN35 OS-CN40 OS-CN45
(a)
Mode No. 0 2 4 6 8 10 0.00 0.01 0.02 0.03 0.04 0.05 SM C ( m g/ m 3)(b)
Figure 8: SMC examined in the constant speed-load conditions of Table 1.
isNOx (g/kWh) 0.020 0.022 0.024 0.026 0.028 0.030 0.032 0.034 SM C ( m g /m 3) 0.0 0.5 1.0 1.5 2.0 2.5 3.0
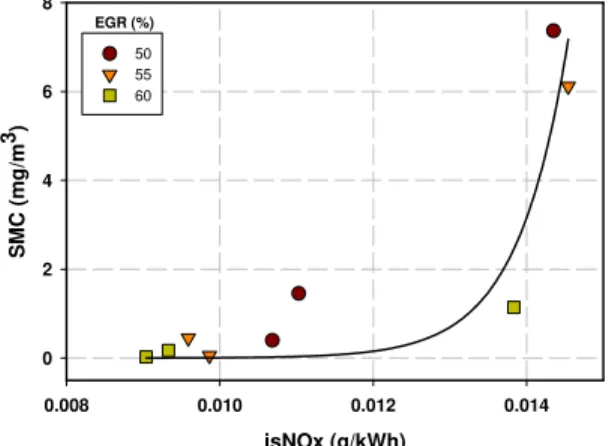
Figure 9 : NOx-soot relationship observed when varying the vaporizer temperature, ULSD, N=900 rpm, EGR=0%, AFR=51.0, CR=11.0. isNOx (g/kWh) 0.008 0.010 0.012 0.014 SM C ( m g /m 3) 0 2 4 6 8 50 55 60 EGR (%)
0: NOx-soot relationship while examining d effects of AFR and EGR, ULSD,
pm, CR=10.0, Tvap=195 oC, MAP=200
x=70 oC.
Ox emissions may have been driven by
oth soot and N ly change
with varying vaporizer temperature.
In the AFR-EGR operating region, both NOx and soot increased with decreasing AFR and/or EGR (Figure 10
)
. The reason for the increase in soot emissions has been explained before. NOx formation is highly sensitive to combustion temperature. The substantial increase in soot and NOx emissions on the right hand side of Figure 10 is due to the increase in flame temperature when AFR is decreased.Increases in engine speed resulted in decreases in both NOx and soot emissions, as indicated in Figure 11. The effect of engine speed on HCCI combustion characteristics has been discussed (Hosseini et al 15) as decreased LTHR activity and consequently retarded combustion timing. The effect of engine speed on NOx is not clear, as under certain conditions NOx emissions increased, decreased, or remained constant. Figure 11 suggests that NOx emissions monotonically decreased with a decrease in soot emissions. Both soot and NOx emissions decreased with increasing engine speed. As mentioned, we have not found a consistent correlation of NOx emissions with engine spee owever, in this case, as soot was intentionally
troduced in the experiment (by operating the vaporizer below the critical temperature limit), the tren
ond period at a co w
initial conditions remained constant. Because of increa bustion timing (CA50)
Figure 1
combine N=900 r kPa, Tmi
While the vaporizer temperature was decreased, the increased N formation due to the prompt route enhanced by the existence temperature was higher than the critical value, b
NO of the fuel-rich spots. When the vaporizer
Ox emissions did not significant
d. H
in ds
observed with NOx emissions appeared coupled to th fuel rich mixtures during engine conditions which favo A transient experiment was performed where the co CR=11.0 to CR=13.0 over a 40 sec
e soot emissions trends and tied to the existence of red soot formation.
mpression ratio was continuously increased from nstant engine speed of 900 rpm and hile all other
sing compression ratio, com
was advanced from -4 oCA,aTDC to -18 oCA,aTDC. Due to advancing the combustion timing from the optimum value (0 oCA,aTDC) to earlier combustion timing, IMEP was decreased from 4.8 bar to 3.6 bar.
isNOx (g/kWh) 0. 010 0. 015 0. 020 0. 025 SMC ( m g /m 3) 0 5 10 15 20 25 30 35
Constant Tmix, Variable CA50 Variable Tmix, Constant CA50
Figure 11: NOx-soot relationship for a range of engine speeds, ULSD, CR=10.0, Tvap=195oC, EGR=42%, AFR=26
time (s) 0 10 20 30 40 CA 50 ( o 5.4 -2 10 CA, aTDC) -20 -18 -16 -14 -12 -10 -8 -6 -4 SMC ( m g/ m 3) 0 2 4 6 8 CA50 SMC IMEP 4.6 4.8 5.0 5.2 ar ) b 3.4 3.6 3.8 4.0 4.2 4.4 IM EP (
Figure 12: Effect of compression ratio and combustion timing on soot emissions
• lthough HCCI combustion is known for near zero soot emissions, under certain conditions with regular diesel fuels, it is possible to produce significant soot concentrations in the exhaust. This is an important result of this study as most of diesel HCCI combustion experiments have been performed with volatile hydrocarbons (such as n-heptane) and not real diesel fuels. Soot emissions are often not being measured or reported.
• LII measurements of soot concentration were sampled from the exhaust stream of an HCCI combustion engine operating with a series of diesel fuels. Measurement was reasonably repeatable for SMC>0.02 mg/m3.
• Decreasing AFR toward the rich limit and decreasing EGR both increased soot emissions. This is a particularly important observation as the most efficient HCCI combustion happens near the knocking limit. Knocking was strongly coupled with soot emissions.
• Soot emissions were higher at lower engin speeds. The engine speed effect was stronger than that of ure.
•
re soot was formed also led to • enerally, HCCI combustion happens in a region in which the peak combustion temperature is below the Simultaneously, SMC was increased from almost zero to more than 6 mg/m3 which is a substantial soot emission for HCCI combustion. Meanwhile NOx emissions were increased, but due to the delayed sampling and analysis response were not correlated with other data in Figure 12.
5. Conclusions
A
e combustion timing and intake mixture temperat The conventional diesel combustion NOx-soot NOx and soot emissions appeared to be coupled. increased NOx formation.
trade-off was not observed in HCCI combustion. Instead, Specifically, conditions whe
G
NOx formation threshold temperature and above the soot formation threshold temperature. Further decreases in peak combustion temperature (for example by increasing EGR and/or AFR) may reduce soot emissions further.
Nomenclature
AFR Air fuel ratio
CR Compression ratio
LII Laser Induced Incandescence
LTHR Low temperature heat release
MAP Manifold absolute pressure
SMC Soot mass concentration (mg/m3)
Tair Intake air (and EGR) temperature
Tmix Intake mixture (air, fuel, and EGR) temperature Tvap Fuel vaporizer temperature
ULSD Ultra low sulphur diesel
Acknowledgements
The authors would like to acknowledge the financial support provided by the Government of Canada’s PERD/AFTER Program.
References
1. R. H. Thring, SAE Paper 1989, 892068.
2. M. Christensen; B. Johansson; P. Einewall, SAE Paper 1997, 972874.
3. A. W. Gray; T. W. Ryan, SAE Paper 1997, 971676.
4. R. H. Stanglmaier; C. E. Roberts, SAE Paper 1999, 1999-01-3682.
. Z. Peng; H. Zhao; N. Ladommatos, SAE Paper 2003, 2003-01-0747.
; A. Hultqvist; B. Johansson, SAE Paper 2004, 2004-01-2990. B. Musculus, SAE Paper 2007, 2007-01-4017.
ood; O. L. Gulder, Combustion and Flame 2001, 125, (1-2), 778-787.
H. Gu cience and Technology 2008, 180, (10-11), 1695-1708.
. 2005, 2005-01-3834.
ao . Foster; R. D. Reitz; D. Choi; P. C. Miles, SAE Paper 2005, 2005-01-0121.
. Kh 2000, 2000-01-0187.
. Gu n Theory and Modelling 2004, 8, (3), 475 - 489.
H. Gu lame 2007, 149, (1-2), 225-233. V. Ho 009-01-1107. 5 6. H. Nordgren . Hu 7. E F. Liu estis; P. A. Erickson; M. P. 8. ; H. Guo; G. J. Smallw 9. o; G. J. Smallwood, Combustion S 10. C. A 11. F. T
Idicheria; L. M. Pickett, SAE Paper ; Y. Liu; B. H. RempelEwert; D. E
12. M air; J. Lemaire; S. Fischer, SAE Paper
o; F. Liu; G. J. Smallwood, Combustio 13. H
14. o; G. J. Smallwood, Combustion and F