Alternative Fuel Vehicle Policy: A Lifecycle Analysis Tool for Emissions,
Costs and Energy Efficiency with an Application to the U.S.
by
Jeremy K. Hackney
Bachelor of Science, Engineering Physics University of Colorado, 1993
Submitted to the Department of Civil and Environmental Engineering and the Technology and Policy Program
in partial fulfillment of the requirements for the degree of
Master of Science in Technology and Policy at the
Massachusetts Institute of Technology
Author
September 1997
@ 1997 Massachusetts Institute of Technology. All rights reserved.
Dep nt of Civil a~A oronmental Engineering
June, 1997 Certified by...
Accepted by...
Richard de Neufville Chairman, Technology and Policy Program Thesis Supervisor
Richard de Neufville Chairman, Technqlhgy and Policy Program Accepted by...,... ... ...
Joseph M. Sussman Chairman, Departmental Committee on Graduate Studies
Alternative Fuel Vehicle Policy: A Lifecycle Analysis Tool for Emissions, Costs
and Energy Efficiency with an Application to the U.S.
by
Jeremy Hackney
Submitted to the Department of Civil and Environmental Engineering and the Technology and Policy Program
in partial fulfillment of the requirements for the degree of Master of Science in Technology and Policy
ABSTRACT
This thesis makes several alternative fuel vehicle (AFV) policy recommendations to the U.S. to reduce air emissions and increase energy security. It uses a spreadsheet model to compare the lifecycle emissions, energy efficiency, and non-tax/subsidy cost of 17 fuel and vehicle combinations from the extraction of the resource to the use of the vehicle over its lifetime. The model can be programmed for any set of fuel chain or vehicle characteristics, so it is adaptable to scenarios in different countries and levels of technology. Policy recommendations are based on 1 present scenario
and 8 possible scenarios of resource prices and technology in the year 2010. All future scenarios assume that the price of natural gas rises at a higher rate than the price of crude oil as a result of higher demand. The analysis
indicates that:
* Propane (LPG) is a low-cost, clean burning alternative with limited reserves, and cannot be a mainstream fuel.
* Reformulated gasoline (RFG) provides the most cost-effective reductions in emissions, and limited energy security benefits.
* Alcohol fuel blends offer energy security benefits and slight emissions reductions over RFG for a slightly higher lifecycle cost.
* Compressed and liquid natural gas vehicles offer energy efficiency and energy security benefits while lowering most emissions.
* Direct conversion fuel cell vehicles using methanol or hydrogen offer the lowest emissions, but at a high cost unless optimistic fuel cell cost projections are achieved.
* Vehicles using natural gas and methanol fuels could become more cost effective if natural gas prices do not rise as much as assumed relative to crude oil.
This study finds no pressing environmental or fuel security need that compels a widespread change to more expensive vehicle fuels in the near term. For the long term, the U.S. should prepare infrastructure for the use of alcohol-blended liquid petroleum fuels and natural gas to reduce emissions and increase energy security. Thesis Supervisor: Richard de Neufville
Alternative Fuel Vehicle Policy: A Lifecycle Analysis Tool for Emissions,
Costs and Energy Efficiency with an Application to the U.S.
Table of Contents
A cknow ledgm ents... ... 9
A cronym s/ U nits... ... 10
1. Introduction and Findings ... ... 13
1.1 Introduction... 13
1.2 Findings ... ... 14
2. Transportation and its Fuel in the U.S. ... ... 15
2.1 Petroleum Dependence in Transportation ... ... 15
2.1.1 Overview of Petroleum Dependence... ... 15
2.1.2 Demand for Petroleum in the U.S. ... ... 17
2.1.3 The Petroleum Resource Supply ... ... 19
2.2 Emissions from Petroleum Use in Vehicles ... 22
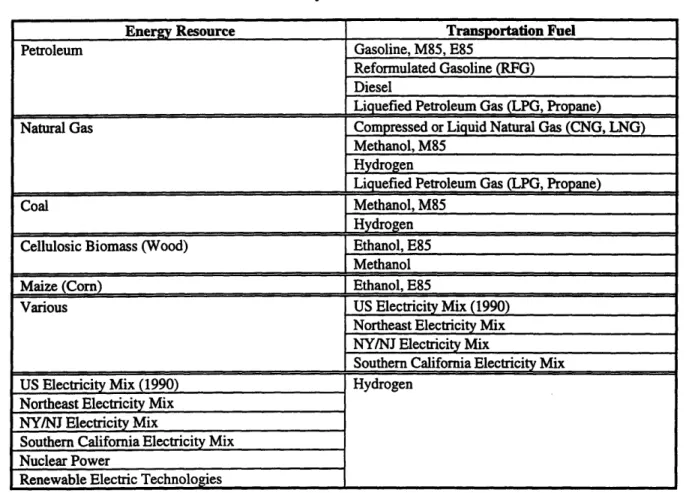
2.3 Alternatives to Petroleum ... 28
2.4 Vehicle Use: The Shoes to Fill ... 29
2.4.1 Highway Vehicle Ownership and Use in the USA ... 29
2.4.2 Fleet V ehicles... 31
2.4.3 Socioeconomic Context of Vehicle Use... ... 32
2.5 Considerations for Successful AFV Introduction... ... 35
3. Existing A FV Policies... ... 37
3.1 The Scope of AFV Policy: Overview...37
3.1.1 A ir Q uality Policies ... ... 38
3.1.2 Energy and Efficiency Policies... ... 38
3.1.3 State AFV Policies ... 40
3.2 Major Policies Affecting AFV Technology...41
3.2.1 Summary of Major Policies Affecting Alternative Fuel Vehicles ... 41
3.2.2 Emissions Policies: The Clean Air Act ... ... 42
3.2.3 Fuel Independence: Alternative Fuels and Fleets... 51
3.2.4 California AFV Policy... ... 55
3.3 Current Federal AFV Programs... 56
3.3.1 Partnership for a New Generation of Vehicles, PNGV... 57
3.3.2 B iofuels ... ... 57
3.3.3 Advanced Battery Consortium, ABC... ... 57
3.3.4 Clean Fuel Fleets/ Clean Cities Program ... ... 57
3.3.5 DOE AFV Budget Request for 1997...58
3.4 AFV Policy Sum m ary... ... 58
4. Alternative Fuel Vehicle Technology... ... 61
4.1 Overview of AFV Technology ... 62
4.2 Vehicle Technology...62
4.2.1 Internal Combustion Engine Vehicles...62
4.2.2 Conventional Engine: Otto Cycle... ... 63
4.2.4 Discussion of ICEV Technology... 67
4.2.5 Battery Electric Vehicles and Battery Technology... .... 67
4 .2.6 B atteries... ... 70
4.2.7 Hybrid Electric Vehicles ... 75
4.2.8 Fuel C ell V ehicles ... ... 77
4.2.9 Alternative Fuel Technology... ... 79
4.3 Technical Evaluation of Alternatives ... 92
5. Lifecycle Model Description...93
5.1 Structure of the M odel ... ... 94
5.1.1 Definition of Outputs: Energy Efficiency, Emissions, Cost...96
5.2 Fuel Chains A nalyzed... ... 97
5.2.1 Interpretation of the Results of the Fuel Chain ... 98
5.2.2 Resource Extraction ... ... 100
5.2.3 Resource Transport ... ... 100
5.2.4 Fuel R efining... ... 101
5.2.5 Fuel Storage and Transport ... 107
5.2.6 Special Fuel Handling Costs ... 110
5.3 Vehicle Model ... 111
5.3.1 O verview ... 111
5.3.2 Vehicle Lifecycle Cost ... 12
5.3.3 Refueling Station Cost ... 120
5.3.4 Vehicle Emissions Model ... 123
5.3.5 R ange... ... 127
5.4 Combining Fuel Chain and Vehicle Emissions into Lifecycle Values...128
5.4.1 Ozone Precursor Emissions... ... 128
5.4.2 Total Greenhouse Emissions ... 129
6. R esults for the B ase Case... ... 131
6.1 The B ase Case Scenario... ... 132
6.1.1 World Resource Prices in the Base Case... 132
6.1.2 Technology Assumptions in the Base Case... 133
6.2 Base Case Cost, Emissions, and Efficiency Results... 133
6.2.1 B ase Case C ost Results ... 133
6.2.2 Comparing Alternatives: Plots of the Emissions and Efficiency Tradeoffs.... 136
6.2.3 Lifecycle Greenhouse Emissions Comparison... 140
6.2.4 Ozone Precursor Emissions... ... 142
6.2.5 Particulate Emissions ... ... 145
6.2.6 Carbon Monoxide Emissions ... 147
6.2.7 Lifecycle Energy Efficiency... ... 148
6.2.8 Impact of Lifecycle Efficiency on Extending the Fossil Fuel Resource... 150
6.3 Conclusions from the Base Case ... 154
7. Sensitivity A nalysis... ... 159
7.1 First O rder C heck ... 159
7.2 Approach and Overall Results ... 159
7.3 Sensitivity to Model Parameter Assumptions... 161
7.5 Effect of Inputs and Assumptions on Lifecycle Results...169
7.5.1 Sensitivity of Lifecycle Cost ... 169
7.5.2 Senstivity of Emissions ... 170
7.5.3 Sensitivity of Energy Efficiency...172
7.6 Conclusions about the Model Output Quality ... ... 172
8. Results for Possible Future Scenarios ... 175
8.1 Scenario Descriptions for 2010 ... 176
8.1.1 Three Sets of Future Resource Prices... ... 176
8.1.2 The Two Cases of Technological Progress ... 178
8.1.3 Best Technological Development of Fuel Cells and Batteries...178
8.2 Results from the Six Scenarios of Prices and Technological Improvement ... 179
8.2.1 Cost Changes in Future Scenarios... 180
8.2.2 Greenhouse Equivalent Emissions ... 184
8.2.3 Ozone Precursor Emissions... 188
8.2.4 Particulate Matter Emissions...190
8.2.5 Carbon Monoxide Emissions ... ... 191
8.2.6 Lifecycle Energy Efficiency...192
8.3 The Best Case Fuel Cell Scenario ... 193
8.3.1 Lifecycle Greenhouse Emissions: Best Case Fuel Cell Development ... 194
8.3.2 Ozone Precursor Emissions: Best Case Fuel Cell Development ... 195
8.3.3 Particulate Matter Emissions: Best Case Fuel Cell Development ... 196
8.3.4 Energy Efficiency: Best Case Fuel Cell Development... 197
8.3.5 Summary of the Best Case Fuel Cell Development...197
8.4 Best Case Electric Vehicle Scenario... 198
8.4.1 Greenhouse Emissions: Best Case Electric Vehicle... 198
8.4.2 Ozone Precursor Emissions: Best Case Electric Drive Development...200
8.4.3 Particulate Matter Emissions: Best Case Electric Drive Development...201
8.4.4 Energy Efficiency: Best Case Electric Drive Development...202
8.4.5 Summary: Best Case Electric Drive Development ... 203
8.5 Summary of Scenario Results... 203
9. Policy Recommendations...207
9.1 Organization of Policy Formulation Presented in this Chapter ... 207
9.2 Opportunities for AFVs ... 208
9.2.1 Role in Reducing Emissions ... ... 208
9.2.2 Role in Resource Conservation/Diversification ... 209
9.2.3 Regional vs. National Role...210
9.2.4 Conclusion of AFV Role... 10
9.3 Comparison and Choice of the Alternatives for Achieving a National, Low Emission AFV Policy ... 211
9.3.1 Choosing an AFV on the Basis of Fuel Resource Tradeoffs...211
9.3.2 Choosing an AFV on the Basis of Lifecycle Emissions Tradeoffs...214
9.4 Suggestions for Sustainable AFV Policy in the U.S... 217
9.4.1 Summary of the Policy Recommendations ... ... 218
9.4.2 Summary of the Alternatives to Pursue... ... 219
9.4.4 Stability of Alternatives... ... 223
9.5 Strategy for Implementing Policy...224
9.5.1 Timing the Policy ... 224
9.5.2 Methods for Implementing AFV Policy... ... 225
9.6 Conclusions ... ... 226
10. R eferences... ... 229
11. Appendix: AFV Technology... ... 237
11.1 Function of an Otto Cycle Engine ... ... 237
11.2 Samples of Current OEM Vehicles Offered by the Big 7 ... 237
11.3 EV and Society: European Markets ... 241
11.4 Batteries Currently Used in Vehicles... 242
11.4.1 Prototype or Limited Production Batteries... ... 242
11.4.2 Unlikely Battery Contenders... ... 245
11.4.3 Recharging Infrastructure...246
12. Appendix: AFV Policy... ... 249
12.1 Exam ple of AQCR...249
12.2 State Implementation of Oxygenated Fuels: Colorado Example...249
13. Appendix: Resource Transport Assumptions ... 251
14. Appendix: Tailpipe Emissions ... 253
15. Appendix: Specific Model Input... 257
15.1 Industry Emissions Controls... 257
15.2 V ehicle Cost Input ... ... 259
16. Appendix: Specific Model Output ... 261
16.1 Fuel Chain Results... ... 261
16.1.1 Costs by Stage ... ... 261
16.1.2 Petroleum Fuels ... ... 265
16.2 Natural Gas Fuels: CNG and LNG ... 265
16.3 Alcohols and Alcohol Mixtures...266
16.3.1 M ethanol... ... 266
16.3.2 M 85 ... ... 267
16.3.3 Ethanol ... ... 267
16.4 Lifecycle Costs ... 268
17. Appendix: Tables of Model Results ... 270
17.1 B ase C ase... 271
17.2 Scenario 2L: 2010 Reference Price: Low Technology... 272
17.3 Scenario 2H: 2010 Reference Price: High Technology... 273
17.4 Scenario 3L: 2010 High Price: Low Technology ... 274
17.5 Scenario 3H: 2010 High Price: High Technology ... 275
17.6 Scenario IL: 2010 Low Price: Low Technology...276
17.7 Scenario 1H: 2010 Low Price: High Technology... ... 277
18. Appendix: Sensitivity Tests of the Modified ADL/Ford Model...278
Acknowledgments
The A.D. Little (ADL) Integrated Fuel Chain Analysis Model was developed under the Hybrid Propulsion Systems Development Program of the U.S. Department of Energy (DOE), being conducted under a cost-shared subcontract funded equally by the Ford Motor Company and the DOE through the Mid-West Research Institute (MRI), which manages and operates the DOE's National Renewable Energy Laboratory (NREL) in Golden, Colorado. The faculty and students of the MIT Technology and Policy Program are grateful to ADL, DOE, Ford, and MRI for permission to use this model.
The American Methanol Institute, in association with the Ford Motor company and Dr. Charles Stokes, and the MIT Technology and Policy Program provided financial support for the research reported in this thesis.
Thanks to my thesis advisor, Richard de Neufville, for suggesting methods for data analysis and for providing suggestions to improve each draft, and Gail Hickey and
Cynthia Stewart, for helping me through the administrative challenges of writing a thesis.
And personal thanks to Keith Szolusha for being a great team captain, the whole team for keeping me away from lab when it was important, Laurie McNeill for being an academic role model and understanding friend, Anne Henderson-Sobol for everything she's given me, my dad, Terry Hackney, and my sister, J.Katy, for sending presents when Boston got grey.
Acronyms/Units
ABC Advanced Battery Coalition (same as U.S. ABC)
AFDC Alternative Fuels Data Center (U.S. DOE)
AFV Alternative Fuel Vehicle
ANWR Arctic National Wildlife Reserve
AQCR Air Quality Control Region (U.S. EPA)
Barrel 42 gallons
BEV Battery Electric Vehicle
Btu British Thermal Unit
CAA Clean Air Act (1970)
CAAA Clean Air Act Amendments (1990)
CAFE Corporate Average Fuel Economy
CARB California Air Resources Board
CFF Clean Fuels Fleet Program
CG Conventional Gasoline
CGV Conventional Gasoline Vehicle
CH2 Compressed Hydrogen Gas
CH4 Methane
CNG Compressed Natural Gas
CNGV Compressed Natural Gas Vehicle
CO Carbon Monoxide
C02 Carbon Dioxide
DOE Department of Energy (same as U.S. DOE)
DOT Department of Transportation (same as U.S. DOT)
E85 85% Ethanol/15% Gasoline Blend
EIA Energy Information Administration (U.S. DOE)
EPA Environmental Protection Agency (same as U.S. EPA)
EPRI Electric Power Research Institute
ETBE Ethyl Tertiary Butyl Ether
EtOH Ethanol
EV Electric Vehicle
FC Fuel Cell
FCV Fuel Cell Vehicle
FFV Flex-Fuel Vehicle
FHWA Federal Highway Administration
FTP Federal Test Procedure
GJ GigaJoule (109 Joule), measure of energy
H2 Hydrogen
HC Hydrocarbon (same as VOC)
HDV Heavy Duty Vehicle
HEV Hybrid Electric Vehicle
HOV High Occupancy Vehicle (Lane)
ICEV Internal Combustion Engine Vehicle
IEA International Energy Agency
ILEV Inherently Low Emission Vehicle
kW Kilowatt (1/75 0th Horsepower), measure of power
kWh Kilowatthour (3.6 x 10⁻³ GJ), measure of energy
LCC Lifecycle Cost
LCE Lifecycle Emissions
LDV Light Duty Vehicle
LEV Low Emission Vehicle
LH2 Liquid Hydrogen
LNG Liquefied Natural Gas
LNGV Liquefied Natural Gas Vehicle
LPG Liquefied Petroleum Gas (Propane)
M85 85% Methanol/15% Gasoline Blend
MeOH Methanol
MIR Maximum Incremental Reactivity
MMBD Million Barrels per Day
MMBtu Million British Thermal Units (1.055 GJ)
MOR Maximum Ozone Reactivity
mpg Miles per Gallon
MSA Metropolitan Statistical Area
MT Metric ton (1000 kg)
MTBE Methyl Tertiary Butyl Ether
NAAQS National Ambient Air Quality Standards
NG Natural Gas (Methane)
NGV Natural Gas Vehicle
NMHC Non-Methane Hydrocarbon
N02 Nitrogen Dioxide
NOx Oxides of Nitrogen
NREL National Renewable Energy Laboratory
03 Ozone
OECD Organization of Economic Cooperation and Development
OME Original Manufacturer Equipment
OPEC Oil Producing and Exporting Countries
PM Particulate Matter
PM10 Particulate Matter of Size 10 Microns or Less
PNGV Partnership for a New Generation Vehicle
RFA Common Type of Conventional Gasoline
RFG Reformulated Gasoline (Clean Air Act Amendments 1990)
SIP State Implementation Plan
SO02 Sulfur Dioxide
SOA State of the Art
TAME Tertiary Amyl Methyl Ether
TCM Transportation Control Measure
Transitional Low Emission Vehicle Same as ABC
Ultra-Low Emission Vehicle Variable-Fuel Vehicle Vehicle Miles Traveled
Volatile Organic Compound (same as HC) Zero Emission Vehicle
TLEV U.S. ABC ULEV VFV VMT VOC ZEV
1. Introduction and Findings
1.1
Introduction
This thesis presents a model which calculates the emissions, costs, and energy efficiency of using different vehicle fuels in various kinds of vehicles, and applies the model to United States to provide guidance for alternative vehicle fuel policy recommendations. It concentrates on two themes which motivate the consideration of alternative vehicle fuels: energy security and the emissions of pollutants to the air.
It uses an approach which accounts for all of the emissions, costs, and energy in the fuel production chain, as well as the use of the vehicle, so that all fuel/vehicle combinations can be compared side by side. As much as was possible, no taxes or subsidies were included, so that all the fuels and vehicles could be compared on a "level playing field."
Its presentation is divided in to three general parts: Background, Model, and Policy.
Background of the Problem, Current Policies, and Technology
Chapter 2 describes the motivation for the recent interest in alternative fuel vehicles (AFV) by detailing the emissions and energy dependence problems associated with liquid petroleum fueled vehicles. It then presents the strengths of liquid petroleum vehicles that alternatives would have to match in order to gain acceptance.
Chapter 3 outlines current federal and state government policies which have taken measures to address the problems associated with liquid petroleum vehicle use, spending more time on those policies which explicitly include mention or require the use of alternative fuels or vehicles.
Current and developing fuel and vehicle technologies are presented in Chapter 4,
model output and its function. The data presented also provide a basis for assumptions made in the model.
Description and Use of the Model
Chapter 5 on model structure and assumptions show how the real world information about fuel chains and vehicles are analyzed so that the different vehicle types can be compared. Changes can be made in the model by anyone who wants to try different price or technology scenarios.
Model results for the base case scenario combining the current (1997) state of technology in the U.S. and world resource prices are presented next in Chapter 6, with a sensitivity analysis of the model's structure and input assumptions following in Chapter 7. The sensitivity analysis alone can be used to recognize the relative impacts of simple changes in technology and cost, though is no substitute for running the model if multiple or large changes are made.
Use of the Model in Making Policy Recommendations
Chapter 8 presents model results for eight more scenarios of three resource prices in the year 2010 (low, medium, and high) and two states of universal technological
development by 2010 in the fuel chains and vehicles (low and high), with two special cases of exceptional cost reductions in fuel cell vehicles and vehicle batteries. The final chapter (9) uses these results to recommend a policy for alternative fuel vehicles in the U.S. in the next 15 years.
1.2 Findings
The results of the scenario analyses show that there is no advantage to a mainstream changeover to alternative vehicle fuels in the next 15 years. The policy recommends however, that the country prepare infrastructure for using liquid and gaseous fuels derived from natural gas, which seems the most likely alternative fuel resource to liquid
2. Transportation and its Fuel in the U.S.
This chapter provides background information about the state of highway vehicle and petroleum use in the United States. It begins with a description of the petroleum-based
transportation system, summarizing the demand and supply characteristics of the market, and the emissions from petroleum vehicles. Section three introduces the state of current alternative fuel vehicle (AFV) use and availability in the country, followed in section four by a summary of the current policy directions which influence AFV development.
Section 5 outlines the current highway vehicle and fuel market, including the intensity of vehicle use, socioeconomic factors, and possible market niches for AFVs. The final section discusses the technical and market conditions for successful AFV introduction, given the strong position of petroleum vehicles today.
2.1 Petroleum Dependence in Transportation
2.1.1 Overview of Petroleum Dependence
The U.S. vehicle fleet depends on petroleum. The term "petroleum," as used by the U.S. Department of Energy (DOE) Energy Information Administration (EIA), includes crude oil, natural gas and its liquids, other low-pressure liquids, and condensate from refineries. Petroleum fuels include gasoline, reformulated gasoline (RFG), oxygenated gasoline, diesel, propane (liquefied petroleum gas, LPG), and methanol. The roughly 134 million passenger vehicles registered in the U.S. primarily use gasoline. 671,000 buses and 64 million freight trucks predominantly use diesel. About half a million vehicles run on other petroleum or non-petroleum fuels.
This dominant uniform system of petroleum fuel vehicles has advantages of providing high mobility for goods and people on a single fuel and roadway infrastructure. The light weight and high energy content of petroleum derivatives enable vehicles high
acceleration, speed, cargo space, long range, and quick refueling procedure. The homogeneous gasoline and diesel infrastructure and composition across regions ensures
that freight or passenger travel across the country will not be hindered by inconsistencies in fuel or refueling procedure. Second hand vehicles are available at lower prices for lower income consumers of private transportation. A well-developed replacement parts manufacture and distribution industry, relying partly on the similarity of current vehicles, underpins the maintenance of the fleet.
Major disadvantages of the current system include dependence on foreign countries for oil imports, highly polluting exhaust gases, and in the long term, a non-renewable fuel supply. Despite improvements in vehicle technology which have increased the fuel efficiency of individual vehicles, fuel consumption is at an all-time high and growing because of the increasing number of vehicle miles traveled. The U.S. now imports just under half of its petroleum, but this amount will increase according to the EIA as world oil prices continue to be lower than domestic costs. Most world oil reserves lie under the oil producing and exporting countries (OPEC) (NRC 1990), which presents a political concern for Western countries' vital petroleum supply.
The exhaust and evaporative emissions from petroleum vehicles concern localized urban populations, where most vehicles are driven, and the international community, which suffers an increase in suspected global warming gases from petroleum combustion. Most pollutants emitted by vehicles are also emitted by stationary sources, which complicates policy decisions for reducing emissions. These pollutants can lead to acid rain,
ground-level ozone, and health problems for people living in areas of high pollutant
concentration. Carbon dioxide, emitted from both vehicles and stationary sources, has been identified as a heat absorbing gas in "greenhouse" theories that correlate an
accumulation of such gases with an observed rise in the average surface temperature of the Earth over the last 50 years.
Car manufacturers have made enormous reductions in tailpipe emissions by improving vehicle technology since the 1960s, and recent reformulations of gasoline have reduced emissions even more. The non-crude oil based additives contained in the gasolines have
displaced about 3.4% of crude which would otherwise have been consumed as gasoline since 1994 (U.S. DOT 1996b, fig 4-2). But both auto and oil producers claim that further incremental changes will not yield improvements worth the extra cost. Also, the
increased total miles driven every year erodes the gains made on the level of the individual vehicle.
2.1.2 Demand for Petroleum in the U.S.
Transportation is the largest and virtually only growth market for oil. Since the early 70's, the demand for energy in transportation (almost entirely for petroleum fuels) has grown at an average annual rate of 1.8% per year in the Organization for Economic Cooperation and Development (OECD) countries. This compares with 2.0% per year in the former communist countries of eastern Europe. In the U.S., pipelines are the only major mode of transport which does not rely on petroleum as a fuel, but they use only 4% of the transportation energy in the U.S., most of it natural gas and electricity. All other transport sectors are almost 100% dependent on petroleum. Transportation is the only sector in the U.S. which consumes more energy today than it did in 1973. As it has in the last 20 years, transportation is expected to be the primary driver of growth in the oil market in the next 20 years (U.S. DOE 1992).
Highway vehicles use 78% of the energy consumed in transportation. Aircraft consume the most energy outside of the highway vehicle sector, and their consumption is growing most rapidly of all sectors. Figure 2.1 illustrates the highway transportation energy use in the U.S. by mode.
Automobiles
42.0% Heavy Trucka
15.9%
Light Trucks
Motorcycles-•-19.5% 0.1%
Figure 2.1: Transportation Energy Use in the US by Mode, 1993. Source: DOE Transportation Statistics Annual Report 1996, fig 4-1.
This chart shows the dominant role that automobiles and light trucks play in petroleum consumption, using almost 62% of the approximately 23 quads Btu of petroleum
consumed annually in the U.S. transport market. Most of these vehicles burn gasoline or reformulated gasoline (RFG), at a 1994 average rate of 7.6 million barrels of gasoline per day (MMBD) (PennWell Pub. 1996). Light duty trucks are used in a similar way to passenger cars, though they are less fuel efficient, and as such are currently the subject of regulatory debate regarding energy efficiency and emissions. Almost all heavy duty trucks, which use 15.9% of the petroleum, burn diesel fuel (1.8 MMBD of diesel). Alternative fuels must be able to meet this energy demand, plus the anticipated growth, which is currently met by petroleum.
Though total fuel consumption is rising due to more vehicle miles traveled, fuel consumption per vehicle has fallen in the last 20 years. The Corporate Average Fuel Economy (CAFE) standard from the 1975 Energy Policy and Conservation Act forced manufacturers to compliment sales of "gas guzzling" luxury and performance vehicles
with more fuel-efficient compact cars. Higher gasoline prices of the mid-seventies drove demand for more efficient cars, too, and both together resulted in raising the average fuel efficiency of new cars. As these cars slowly replaced existing less-efficient vehicles in the U.S. fleet, average fleet fuel economy also rose. This fuel economy improvement has leveled off as consumers have come to prefer less fuel-efficient vehicles in this period of low gasoline prices. Average fleet fuel economy increased steadily from 13.5 miles per gallon of gasoline (mpg) in 1975 to a high of 21.7 mpg in 1991, and has decreased slightly to 21.5 mpg in 1994.(U.S. DOT 1996a) . New cars now average 27.9 mpg, and light trucks average 20.4 mpg (U.S. DOT 1996a). According to DOE, the progress in vehicle fuel efficiency has "stalled." (U.S. DOT 1996a ,p 95) because of the popularity of inefficient sport utility vehicles (mini-vans and 4-wheel drive light trucks) and low relative gasoline prices.
In 1973, transportation in the U.S. used 17.8 quadrillion Btu (1 "quad"= 1015) of petroleum products, 51% of the country's total petroleum consumption. By 1994 consumption had grown to 22.7 quads, 67% of the country's total demand for petroleum and 97% of the total transportation demand for energy. A rule of thumb for thinking about this amount of energy is that a full tank of fuel in a normal passenger vehicle contains about one million Btu (= 1 MMBtu).
2.1.3 The Petroleum Resource Supply
Fossil fuel resources are typically reported in four categories: proven reserves, indicated reserves, inferred reserves, and undiscovered reserves. Crude oil is currently of principal concern in transportation, of course. The categories for reserve estimates indicate a specific status of the reserve. Proved reserves have established extraction infrastructure and are judged to be economically recoverable under existing economic and operating conditions according to geologic and engineering data. Indicated additional reserves refer to crude oil recoverable by enhanced methods which may be too expensive to merit consideration under economic conditions in 1997. Inferred reserves, or probable resources, describe resources which have been identified, but are not yet capitalized for
extraction. The inferred reserves will be added to the amount of proved reserves once the infrastructure extensions have been incorporated. Undiscovered resources are informed estimates. Table 2.1 summarizes representative 1987 estimates of oil reserves reported in a National Research Council report on alternative transportation fuels summarizes the US reserves.(NRC 1990)
Table 2.1: Estimates of U.S. Resources of Crude Oil (Billion barrels)
Reserves
Proven Indicated Inferred Undiscovered
Additional
Lower 48, Onshore 16.6 3.1 11.2 20.1
Lower 48, Offshore 3.3 0.1 1.6 12.7
Alaska 7.4 0.6 5.5 16.6
Total 27.3 3.8 18.3 49.4
Source: National Research Council (1990).
Both the low and high predictions for total US reserves in the NRC report considered the possibility of doubling the estimated growth in recoverable reserves by employing very expensive recovery technology, costing $40-$50/bbl recovered. Usual moderate recovery costs in the US are $25/bbl.
Some of the potentially recoverable oil may have not be recoverable for reasons other than cost. Environmental concerns about intrusion into or destruction of wilderness areas may prevent the extraction of some reserves. For example, a substantial amount of Alaskan petroleum is located in the 19 million acre Arctic National Wildlife Refuge (ANWR). Whether to open 1.5 million acres of land on the coast of the refuge, the "1002 area," for resource extraction is currently at the center of debate in Congress. The U.S. DOE's EIA (1992) estimates that oil production volumes there could reach a very significant 1 million bbl/day. However, environmentalists claim that the project will block animals' access to the coast and the migratory routes for caribou. In Colorado, where there are large reserves of oil shale (oil within the matrix of layered rock sediments), environmentalists resisted any notion of extracting the reserve during the energy crisis of the late 1970s.
Table 2.2 shows the distribution of proven crude oil reserves as of Jani, 1997.
Table 2.2: 1997 Proven Crude Oil Reserves by World Region World Region Millions of Barrels
Canada 4,894 Western Europe 18,361 United States 22,351 Austral-Asia 42,299 Russia/E. Europe 59,093 Africa 67,555 Latin America 127,943 Middle East 676,352 Total World 1,018,850
Source: American Petroleum Institute (1997)
Most of the world's proven reserves are in the Middle East, with a substantial portion in the Americas. The U.S. Geological Survey estimates the world's estimated discovered and undiscovered reserves of petroleum at 1.5 to 1.6 trillion barrels (U.S. DOT 1996a).
The OPEC countries' majority position in the petroleum supply market potentially gives them substantial power in determining oil prices. Currently, supply easily meets demand. However, according to a U.S. DOT report (U.S. DOT 1996a) OPEC now produces oil at a rate of around 1% of their total reserves per year, and the rest of the world is producing at twice that rate. At these rates, non-OPEC countries would deplete their reserves and encounter higher production costs sooner than the OPEC states would, and may become dependent on dependent on this sole body of suppliers.
Most petroleum used in the U.S. comes from North American fields, but a growing percentage is imported. Oil imports made up 35% of U.S. consumption in 1973, and reached a peak of 47% in 1977. A more fuel efficient vehicle fleet and higher oil prices helped to reduce this dependence to 27% in 1985, partly because more expensive domestic producers could compete in the market at the higher price. But oil price decreases in 1986 have closed many domestic wells and increased imports again to 45% today. With the rapid growth of vehicle miles traveled and a new market for less fuel
efficient vehicles emerging in the U.S., the EIA projects that with low oil prices
dominating, imports will increase to over 65% by 2010 (U.S. DOE EIA 1992). Even at high oil prices, the EIA predicts that the U.S. will be importing almost 55% of its oil by then.
2.2
Emissions from Petroleum Use in Vehicles
Petroleum products have many characteristics which make them nearly ideal combustion fuels. Most of all, they contain an enormous amount of energy for their mass and
volume, so sufficient supplies for people's desired mobility are easy to transport and store in vehicles. However, evaporation and combustion of the fuels emits some gases which have been shown to be harmful to human health, and others which have been implicated in greenhouse warming theories. Mobile sources of pollution are numerous and densely clustered enough that they contribute to a major portion of air pollution, mostly in urban areas. Though it is difficult to estimate the number of people exposed to this urban air pollution, DOE estimates that about /4 to 1/3 of the population is affected, or 60-80 million people (U.S. DOT 1996a), while the EPA estimates 90 million (U.S. EPA 1993). Highway vehicle transportation, the focus of this thesis, contributes to the largest
proportion of mobile source emissions because of the large number and frequent use of the vehicles. However, measurement of emissions and their environmental and health effects does not give very precise results, and most theories of chemical interactions from the source of emission to the effects are extremely complicated and difficult to test. Linking environmental and health problems to particular atmospheric and aquatic emissions has involved as much political negotiation as it has scientific research.
Emissions of carbon monoxide (CO) and hydrocarbons (HC) are particularly high from gasoline powered vehicles, while diesels emit higher amounts of particulate matter (PM). Both types of vehicles emit carbon dioxide (CO2) and steam as byproducts of carbon fuel combustion, and nitrogen oxides (NOx) which result from heating air in the engine. The
major pollutants emitted by petroleum vehicles which have elicited concern from scientists, health and environmental activists, and lawmakers are: CO, NO2, HC (or
volatile organic compounds, VOC), particulate matter of size less than 10 microns (PM10), lead, benzene and other aromatics, and sulfur dioxide (S02). C02, a natural result of complete combustion, has been identified in the last ten years with an
accumulation of gases that retain the earth's radiant heat, the so-called 'greenhouse gases', but no vehicle policy currently applies to reducing C02 emissions from vehicles. There are laws intending to reduce each of the other pollutants both from mobile and from stationary sources.
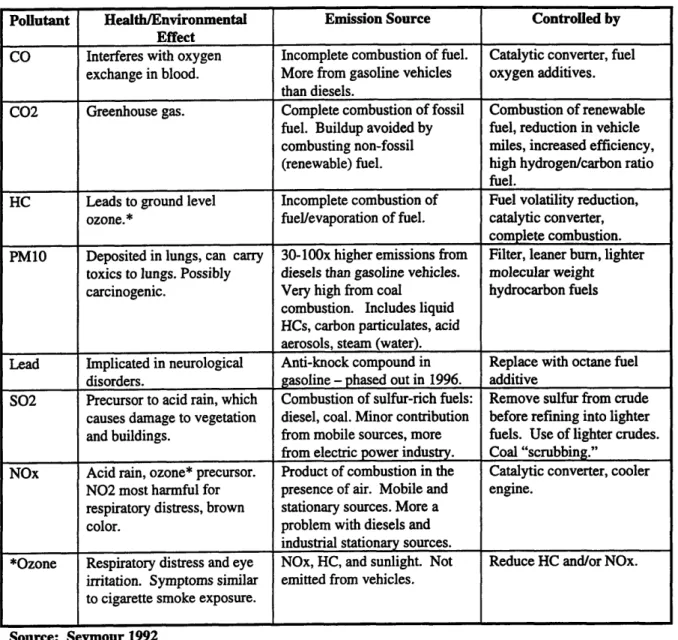
Table 2.3 outlines the theoretical effects of each pollutant (adapted from Seymour 1992, table 1), the emission source, and the way in which the pollutant either has been or could be controlled.
Table 2.3: Atmospheric Pollutants, Emissions Sources, and Control Measures
Pollutant Health/Environmental Emission Source Controlled by Effect
CO Interferes with oxygen Incomplete combustion of fuel. Catalytic converter, fuel exchange in blood. More from gasoline vehicles oxygen additives.
than diesels.
C02 Greenhouse gas. Complete combustion of fossil Combustion of renewable fuel. Buildup avoided by fuel, reduction in vehicle combusting non-fossil miles, increased efficiency, (renewable) fuel. high hydrogen/carbon ratio
fuel.
HC Leads to ground level Incomplete combustion of Fuel volatility reduction, ozone.* fuel/evaporation of fuel. catalytic converter,
complete combustion.
PM10 Deposited in lungs, can carry 30-100x higher emissions from Filter, leaner burn, lighter toxics to lungs. Possibly diesels than gasoline vehicles. molecular weight
carcinogenic. Very high from coal hydrocarbon fuels combustion. Includes liquid
HCs, carbon particulates, acid
aerosols, steam (water).
Lead Implicated in neurological Anti-knock compound in Replace with octane fuel
disorders. gasoline -phased out in 1996. additive
SO02 Precursor to acid rain, which Combustion of sulfur-rich fuels: Remove sulfur from crude causes damage to vegetation diesel, coal. Minor contribution before refining into lighter and buildings. from mobile sources, more fuels. Use of lighter crudes.
from electric power industry. Coal "scrubbing."
NOx Acid rain, ozone* precursor. Product of combustion in the Catalytic converter, cooler N02 most harmful for presence of air. Mobile and engine.
respiratory distress, brown stationary sources. More a
color. problem with diesels and
industrial stationary sources.
*Ozone Respiratory distress and eye NOx, HC, and sunlight. Not Reduce HC and/or NOx. irritation. Symptoms similar emitted from vehicles.
to cigarette smoke exposure. Source: Seymour 1992
The unacceptably high accumulation and recurrent high concentrations of mobile source pollutants attributed to petroleum use motivated federal action in the mid-60s to reduce light-duty vehicle pollution. Pollutant emissions have been reduced since the 1960s with a combination of catalytic treatment of exhaust gases after combustion in the vehicle, and
adjustments to the contents of certain chemicals in gasoline. Heavy duty and non-highway vehicles have been controlled to varying degrees by similar policies. However,
vehicle miles traveled (VMT) has grown so quickly that emissions reductions from individual vehicles could not compensate for the increase, and emissions of some
pollutants have increased despite controlling measures. Table 2.4 summarizes data from the EPA and FHWA (cited in U.S. DOT 1996a) regarding VMT increase and pollutant emissions from 1975-1994. The fact that emissions do not increase with VMT attests to strides in automobile efficiency, emissions control, and fuel reformulations:
Table 2.4: Change in Highway Vehicle Miles Traveled and Total Vehicle Emissions in the U.S., 1975-94 Criterion % Change, 1970-1994 VMT* +104.0 C02** +38.0 S02 +25.7 NOx +0.7 PM-10 -16.7 CO -31.9 VOC, or HC -53.0 Lead -99.2
Source: U.S. DOT 1996a, *80% more vehicles, **U.S. DOT 1996b.
CO, HC, and NOx vehicle emissions were reduced by technologies onboard the vehicle by the Federal Clean Air Act (CAA) of 1970, for vehicles beginning in the model year
1975-76 (which was extended to 1977). This requirement forced the market introduction of large numbers of vehicles catalytic exhaust gas converters in 1977. The catalysts completely combust most of the CO into CO2 in the exhaust pipe, before it is emitted to the atmosphere, reducing CO in the exhaust by 90%.
NOx reductions are difficult to achieve, since any source of heat can cause nitrogen in the air to react with oxygen in the air. The 3-way catalysts introduced in 1981 work with a computerized "closed loop" system to reduce nitrogen oxide emissions. The systems have an oxygen sensor in the exhaust system to control engine air intake and reduce NOx by up to 85% by converting it to nitrogen and oxygen. Roughly, more fuel-efficient engines run leaner and hotter, and produce more NOx. This is an important tradeoff for diesel engines, which emit less particulate matter if they are running more efficiently, but emit more NOx at the higher temperature of the lean air/fuel mixture.
Tailpipe HC emissions have also been further reduced by using computers, fuel injectors, and "closed-loop" combustion strategies to improve the fuel/air ratio in the engine so that fuels burn more completely. These technologies have also resulted in improved fuel efficiency and reduced CO, as well. New requirements to reduce the volatility of gasoline blends are an effort to reduce HC evaporative emissions at refueling stations and from the gas tanks of vehicles.
Lead and sulfur foul the exhaust catalysts in gasoline vehicles, and so had to be eliminated or reduced to near-zero levels in gasoline to be used with the catalytic
converters (unleaded gasoline). Lead compounds help to reduce engine "knocking," or pre-ignition of the fuel, however, and had to be replaced with octane-enhancing additives as it was being phased out of gasoline in the 1980s. The market for MTBE (methyl tertiary butyl ether) and ethanol (called gasohol when mixed with gasoline in a 1:9 volume ratio) as gasoline octane additives grew in proportion to the demand for unleaded gasoline. Leaded gasoline has been illegal in the U.S. since January 1, 1996. Sulfur can be reduced in gasoline by buying low sulfur imported crude oil, or by removing sulfur in a series of crude refining steps. Sulfur has been reduced in diesel fuels, as well, to control SO02 emissions.
Roughly speaking, CO02 emissions track energy consumption when fossil hydrocarbon fuels combust. Burning, or oxidizing, fossil carbon and hydrogen releases the energy needed to run an engine, with water and carbon dioxide as the lowest energy chemical byproducts of the reaction. Using more fossil energy requires releasing more CO02. Even storing fossil energy in other media like hydrogen or batteries, or converting the fossil energy to electricity, releases CO02 after the fossil hydrocarbon has been oxidized. This raises issues for alternative vehicle fuels which may have low CO02 emissions at the tailpipe: they may not necessarily emit low amounts of CO02 in a lifecycle sense if the fuels storing the energy have derived that energy from fossil sources upstream of the vehicle. The amount of carbon dioxide emitted depends on the energy demand of the conversion or combustion process and the amount of hydrogen contained in the fossil
hydrocarbon. The more energy that can be released from the fuel by oxidizing hydrogen as opposed to carbon, the less CO2 will be produced per unit energy in the fuel. The 38% increase relative to a 104% increase in VMT over the last 25 years shows the increased fuel efficiency of the U.S. vehicle fleet. To further reduce the release of CO2 from petroleum vehicles would require increasing their energy efficiency (decreasing fuel consumption) or decreasing the number of vehicle miles traveled (VMT).
Another alternative for reducing CO2 emissions would be to use carbon sources which do not add new CO2 to the atmospheric cycle. Only biologically derived fuels (fuels made
from "biomass") can store energy in hydrocarbons which contain carbon that is active in the atmospheric carbon cycle. Combusting fuels derived from these biological sources, like plants, lichens, fungi, trees, or even some garbage, would add C02 to the atmosphere which had already been taken away from the atmosphere by the biological source. This avoids adding new CO2 from fossil fuels to the greenhouse gas accumulation. This is the only way to reduce carbon dioxide emissions from combustion to zero. Carbon dioxide will be the most difficult pollutant to reduce, as renewable fuels are limited in supply and very expensive. Its emission will increase with VMT and the inverse of fleet fuel efficiency.
The reductions in mobile emissions have been accompanied by reductions in stationary sector emissions. Despite mobile source reductions, by 1994 mobile sources contributed 78% of CO, 32% of C02, 45% of NOx and HC, 35% of lead, and 40% of PM-10 emitted to the atmosphere across the country (U.S. DOT 1996a). Carbon monoxide is the
signature pollutant of mobile sources because of the hydrocarbon fuel. Highway vehicles alone accounted for 62% of CO and C02, 32% of NOx, and 26% of HC emissions in the nation, corresponding to 61 million tons CO, 1002 million tons C02, 7.5 million tons NOx, and 6.3 million tons HC (U.S. DOT 1996a). According to the Bureau of
Transportation Statistics (BTS) however, without the reductions in emissions per vehicle-mile since 1970, transportation-source air pollution would be two to four times what they are now (cited in U.S DOT 1996b).
2.3 Alternatives
to
Petroleum
Fuel alternatives to petroleum could offer advantages in terms of fuel resource independence for the nation, lower air emissions, or lower cost. However, some
substitutions may trade-off vehicle performance or serviceability in return for the benefits they confer. And some fuel alternatives have limited reserves themselves, not improving at all on petroleum's supply problem. Most fuel alternatives require a wholly new or retrofitted engine in order to use them. This dependence necessitates considering the fuels and vehicles together in a system. The term, "alternative fuel vehicle" (AFV), then, refers to both the fuel and the vehicle parts of this system. New AFV systems would require new fuel refining and delivery infrastructures because of the fuels' different physical characteristics from gasoline, and a new parts and maintenance support structure for the new vehicle components. These supply networks would probably have to be established across large regions, to preserve the familiar nationwide compatibility
provided by the current infrastructure, though regional niche applications of technologies may prove worthwhile. On the political and economic side of AFV changes, new
regulations would have to be considered for the different characteristics of the new fuels and vehicle powerplants, for issues ranging from safety to taxation. All of these changes would have to occur in the environment of a deeply and widely established petroleum economy.
True departures from petroleum-based vehicles are not used on a wide enough scale today to have an effect on either petroleum consumption or air pollution. But successful
alternatives will be expected to provide substantial improvements to gasoline in these areas. In addition, the fuels which can offer a higher combined resource-to-wheels
efficiency and resource availability may stand the best chance of adoption from an energy security standpoint, since those fuels will last the longest. Three important bases of comparison for alternative fuels will be cost, energy efficiency, and the emissions released by using them.
Measuring these characteristics in the vehicle works well for comparing gasoline vehicles to gasoline vehicles. Since all cars use the same fuel from the same sources, comparing the emissions, fuel economy, or cost of two vehicles suffices to identify the superior performer. But in order to be able to compare the emissions, energy efficiency, or cost of using different fuels in different vehicles, this analysis takes into account the entire fuel chain, from resources to the fuel's use in the vehicle. The model corrects for existing price-altering policies to present a "level playing field" for comparing the costs of
different systems. This chain analysis also provides insight into the weak links in fuel procurement and utilization: stages of excessive energy loss, emissions, or cost, for consideration in technology policy decisions.
Chapter 3 discusses policies in the U.S. which have tended to introduce alternatives to petroleum.
2.4 Vehicle Use: The Shoes
to Fill
2.4.1 Highway Vehicle Ownership and Use in the USA
The car and light truck market in the US offers a lot of potential for AFV growth, given an attractive relationship between price and performance. The same holds in the market for transportation fuels. American consumers spent about $153 billion on new and used personal car purchases in 1994, and $107 billion on gasoline and oil. These individual car purchases included 4.6 million new passenger cars. In addition to the personal market, businesses spent $81 billion on 4.5 million new passenger cars, and governments spent $1.7 billion on 115,000 cars. A total of 9.2 million new passenger cars were sold in
1994, and 5.7 million light trucks (U.S. DOT 1996a). Expenditures on replacement parts for the entire fleet were another $30 billion. These numbers represent not only a potential market for vehicles and fuels, but also the high stakes that automobile and petroleum producers have at risk in vehicle policy decisions.
Most adult Americans will purchase several highway motor vehicles in their lives. In 1994, the average American consumer household spent about $2,725 on new vehicle
purchases, and $1000 on gasoline and oil (U.S. DOT 1996b). This represents about 19% of household spending. The average number of vehicles owned per household is about 1.8, but varies by region: 1.5 in the Northeast, where denser settlement supports transit services; 1.8 in the generally poorer South; and 2.1 to 2.2 in the low-density Midwest and West, respectively. Individual households in the West and Midwest not only own more
vehicles per capita, they also spend more on gasoline and oil, about $1200 vs. $900 in other regions, because they drive further and more often. Rural residents across the country spend an average of $1200 a year on gasoline and oil for this same reason. Average household vehicle expenditures are 33% lower in the Northeast than in the rest of the country because of the larger number of households which do not own a single or multiple vehicles over which the figure is averaged.
An average passenger vehicle in the U.S. is driven about 12,000 miles per year, which is a mean travel of about 33 miles a day. This average has increased monotonically from 9,000 miles per year in 1980 (U.S. DOT 1996a), possibly indicating a trend in growth of
automobile trip length for the future. Of course, there may be no individual vehicle which travels with this annual total and daily average mileage, but for an order of magnitude measure of performance, it is an important average to keep in mind when considering the capabilities of AFV technology. Vehicle range is a common
performance limiting factor for many types of alternative fuels.
The statistic means that a portion of vehicles will exceed the need for a 33 mile daily range at least some days of the year. An AFV that would be used as a universal replacement for petroleum vehicles should be capable of at least this range, plus a comfort factor. On the other hand, though the statistic doesn't reveal the number and distance of peak trips when demand for range could be very much more than 33 miles, it
shows that vehicles with maximum ranges near this value may find a market if the
demand for longer distance travel could be met with another vehicle. This issue ties AFV policy with the idea of individual mobility in general, which can be a very complicated problem. However, as noted above, average vehicle ownership in American households
is nearly two vehicles, so if the price of a range-limited vehicle were low enough, these vehicles could potentially find a market in multiple vehicle households. Their success would depend on their user cost and the frequency and distance of the longer trips, information which can only be obtained in expensive travel diary and marketing surveys.
2.4.2 Fleet Vehicles
Fleets employ about 8 million cars, which is 7% of the total cars, and most of the 63 million trucks in the U.S.. These are important figures because current federal policies mandate fleet purchases of AFVs, depending on the size of the fleet, its owner/operator, and the weight of the fleet vehicles. Fleets present a potential niche for AFV designs which require complex, inconvenient, or expensive refueling infrastructure that may not find support from individual consumers. Fleet applications also provide a nearly ideal testing laboratory for AFV performance, since the use and maintenance of the vehicle is closely observed for purposes of managing the fleet. Characteristics of the use of AFVs in fleets can be well correlated with maintenance and fuel needs in a fleet application. Table 2.5 shows the approximate number of fleet cars in the U.S. according to the fleet manager or type of vehicle application.
Table 2.5: U.S. Automobiles in Fleets by Owner and Use, 1994 (U.S. DOT 1996b) Fleet Owner Automobiles Percent of
in Fleet* U.S. Total (Thousands) Individually Leased 3150 2.4 Business Fleets 2600 1.9 Daily Rental 1500 1.1 Government (Non-military) 450 0.3 Utilities 400 0.3 Police 250 0.2 Taxi 150 0.1
Total in Fleets of 10 or more (affected by recent 8500 6.0
policies)
Total in Fleets of 4 or more 10500 7.7
*Fleets of 10 or more, except in last row. Numbers rounded to nearest 50,000 vehicles
As the table illustrates, the policy step toward replacing fleet cars with annual purchases of alternatively fueled vehicles would have minor direct effect on total accumulation of
AFVs because affected fleet vehicles comprise only 6-8% of the total number of vehicles in the U.S.. The schedule of purchases in the combined federal fleet purchase directives is complicated and allows for exemptions from compliance (see Chapter 3), but in general it calls for a growing rate of gasoline vehicle replacement with AFVs each year. The policy can serve as a stimulus to auto and fuel industry innovation and marketing however, and has already resulted in good data for use in future fuel/vehicle system choices.
2.4.3 Socioeconomic Context of Vehicle Use
Emissions and VMT depend on elements external to the fuel/vehicle system which are poorly understood, but which will be continued influences in the future even as vehicle and fuel technologies change. A major driver of vehicle use, the low density settlement patterns around city centers in the U.S., have fostered Americans' dependence on individual automobile use, and exposed more of the population to urban pollution since the early 1950s as population brought mobile source pollution to previously rural areas. In the 1980s, high-tech industries relying less on the freight transport infrastructure and unskilled labor densities found in city centers began moving their offices and production to cheaper-rent areas surrounding city centers. These "office parks" effectively spread cities' economic activity zones to the previously rural regions between suburbs,
producing demand for more roadways and more traffic between suburbs.
It is apparently less the case that Americans are moving to urban regions, than that urban centers and their highway-dependent residents are sprawling out into suburbs which had previously been rural areas, which had generated less highway VMT. This "sprawl," common in the West, has increased trip length, vehicle ownership, and road congestion around the city center, though not necessarily in the center. The effect that increased congestion has had on the amount of emissions is unclear, but the increased VMT and population in these expanded regions has raised emissions and exposed more people to mobile source air pollution.
About 80% of the U.S. population now lives in urban and satellite centers as described by Metropolitan Statistical Areas (MSA), which range in population from 200,000 to 20 million. The MSAs are characterized by a center city or conglomeration of trip attractors, and they have been defined such that most commuting trips occur within MSAs as
opposed to between them. MSAs are therefore useful transportation analysis and policy-making building blocks for establishing the behavioral trends and the jurisdiction of regulations. MSAs are based on economics, however, and do not often coincide with legal jurisdictions, so implementing policies may imply cooperation between local governments or imposition of rules from a government level with superior jurisdiction.
65% of passenger VMT in the US occurred in MSAs in 1994, and 54% of truck VMT. These statistics have increased in the last thirty years because of growth in MSA
populations. This growth has been due to two factors: redistricting the MSAs to reflect changing economic activity zones; and growth of mobility surrounding the economic activity. Both of these increases reflect the increase in suburban-based car commuting, which has extended the geographic boundaries of MSAs, and the broader geographic range of industrial and consumption economies. Despite the reduced roadway
efficiencies in these growing centers and their satellites, residents rely on their personal vehicles to commute to work. VMT has increased from 1.1 to 1.6 trillion miles from 1980 to 1994, and the average miles traveled per vehicle, an important performance measure for AFVs to match, rose from 9,100 to 11,800 per year. The drive-alone mode
share for trips to work exceeds 75% of trips in most major cities except New York (53%) and San Francisco (70%), which maintain a more extensive transit infrastructure,
including commuter rail. These cities can generate higher transit ridership for more economical transit systems partly because their denser populations make transit operation more economically efficient, and partly because access to them via road (across
bottlenecks like bridges or tunnels) makes car travel more difficult. Low supplies of parking space and other land-use issues also deter automobile use and ownership in these areas. The structure of a more usual American city however, provides the best access via roadways, which encourages driving a personal automobile.
New traffic in urban areas has grown faster than lane-miles of roadway, increasing congestion in most MSAs since 1982, with a few exceptions (Detroit, Phoenix, and Houston all experienced reductions) (U.S. DOT 1996a). An individual vehicle traveling in congestion has higher emissions per mile than a car driving at normal speed, because of the low number of miles traveled at the lower speed over which to average somewhat higher emissions. Emissions of HC, CO, and CO2 can be much higher during the
acceleration and deceleration characteristic of congested flow because of the way cars are programmed to enrich the fuel/air mixture for better performance. Idling engines may also have significantly higher emissions than engines under moderate load (and stationary vehicles, of course, emit infinite per mile emissions!). In a supply and demand
consideration of VMT however, congestion works to decrease the supply of roadway and to make travel more expensive, in a temporal sense, also reducing demand for personal vehicle use. This effect may actually result in lowering emissions overall, since more people decide not to drive alone. No one knows for sure what effect congestion has on total urban vehicle emissions.
One important implication of low-density land use policies as they regard alternative fuel vehicle technology, is the necessity of a wider fuel distribution network and of vehicles with a long range, possibly over the national average of 33 miles per day. Current land use suits current petroleum vehicle technology perfectly, and conversely, current living preferences depend on gasoline automobiles and large diesel delivery trucks. Growth in low density housing, office parks, and strip malls is very high in the land-rich Western states. This growth can be counted on to continue at least until the end of the next long-term planning period (2015 for most cities). Some alternative fuel vehicle systems, like electric station cars used for trips to commuter rail stations, for example, may find niche markets in joint land-use/transportation plans which provide refueling or other favorable infrastructure, but large-scale replacement of petroleum vehicles would have to be compatible with the existing sprawl and people's existing driving habits, at least for the first third of the 21st century. Alternative fuel vehicles which can provide the best
substitute for petroleum vehicles in these low density areas will find the fastest mainstream acceptance.
2.5
Considerations for Successful AFV
Introduction
AFVs' potential benefits over petroleum are primarily lower air emissions and strategic resource management. Under current policies, these benefits are not immediately apparent to, nor realized by, the purchaser and user of the vehicle, since these kinds of benefits are spread over the entire regional or national population. Widespread AFV introduction will therefore only occur if the vehicles and refueling infrastructure can "transparently" replace gasoline vehicles in such a way that they cause minimal changes to people's driving or mobility habits.
The current trends are to drive further and more often, and to purchase larger, utility-style vehicles with large cargo space. This suggests that successful AFVs will have to retain power, cargo space, and a range longer than a day's travel of about 50 miles. The refueling infrastructure will have to be as convenient as the current gasoline refueling stations, and as easily available.
However, American households typically own more than one car, so for AFVs which can match some, but not all, performance characteristics of conventional vehicles, there is potential to find niches in these households for specialized trips. Other niches for AFVs
may be in fleet applications, where complicated refueling procedures do not hinder the vehicle operation as much as it would for the owner of a personal vehicle. But the entire fleet market is a small share of the total highway vehicles, and might not achieve great overall reductions in emissions or petroleum imports.
For the present, resource reserves are plentiful and inexpensive, and gasoline vehicle emissions have been controlled very well with exhaust and fuel modifications which are relatively minor compared to changing the national fueling infrastructure to a
to present alternative fuel options. The remainder of this thesis presents a basis for comparing fuel alternatives to identify appropriate costs and world conditions in which a
3. Existing AFV Policies
This chapter begins with an overview of the scope of AFV policy. It then describes in detail the current policies which have had a major effect on AFV development, and which will continue to influence AFVs into the first decade of the next century. The third section outlines current federal government AFV development programs. Section four describes how public technology policy is made in the U.S., and the channels by which it may be influenced. The final section summarizes the important policy thrusts which will continue to influence AFVs throughout the period of consideration of this thesis.
3.1 The Scope of AFV
Policy:
Overview
This section provides a bird's eye view of the federal policies which have affected alternative fuels or vehicles. Federal AFV policy in 1997 has two major emphases: cleaner urban air and less reliance on imported fuels. A secondary policy direction funds research and development of technologies that reduce transportation CO2 emissions, which are a global warming concern. Vehicle miles traveled and vehicle efficiency strongly influence emissions, so a division between types of policies is not clear. This thesis divides the policies into primary and secondary areas of impact.
State policies aim to comply with federal laws, while California's AFV policies tend to be stricter than or to anticipate federal policy.
AFV policies mix consumer choice with government's goals and technological reality. Often, the best option in any of the three areas is sub-optimal or undesirable in the others. Lawmakers must balance health, environmental, and national strategic needs with
concern for preserving individuals' accustomed level of mobility and industry competitiveness. Americans have actually accepted government involvement in consumer choice when to do so was a popular decision. Laws which hint at compromising personal mobility or industry profits are unlikely to gain a popular
of vehicles and fuels rather than toward measures which may influence consumer
behavior. These beliefs are manifested in the U.S. in low federal gasoline and diesel fuel taxes, and some of the strictest vehicle emissions standards and cleanest fuels.
3.1.1 Air Quality Policies
Geographically comprehensive air quality policies have had the most impact on alternative fuels, tending to promote large-scale change by affecting a large market segment of vehicles and fuels at once. Fuel composition and anti-pollution equipment in vehicles nationwide have changed several times since 1970 as a result of Clean Air Act
(CAA) directives to the EPA to regulate air quality (Downstream Alternatives 1996). The 1990 amendments to the CAA include further reductions in tailpipe emissions, and very stringent emissions standards for fleet vehicles.
Section 3.2.2 details the history and impact of the CAA on alternative fuels.
3.1.2 Energy and Efficiency Policies
Energy policies intend to reduce petroleum imports by reducing its consumption. They target vehicle efficiency (mileage) or, more recently, fleet vehicles and vehicle use.
CAFE Mileage Standard
The Corporate Average Fuel Economy standard (CAFE) from the Energy Policy and Conservation Act of 1975 does not directly address alternative fuels, but it helped accomplish one of the major goals of AFV policy, which is reducing petroleum imports. It has probably had the most impact in this area of all other policies. Since CAFE was
introduced, the average mileage of a new car has increased from 15 miles per gallon (mpg) in 1975 to 26 mpg in 1982 (U.S. DOT 1996a), though it has remained below 28 mpg since then. Fleet average fuel efficiency improvements have saved more than 7 trillion barrels of gasoline since 1975, according to my calculation from annual statistics from the Department of Transportation (U.S. DOT 1996b).