Publisher’s version / Version de l'éditeur:
Bulletin of the American Meteorological Society, 90, 12, pp. 1843-1864, 2009-12
READ THESE TERMS AND CONDITIONS CAREFULLY BEFORE USING THIS WEBSITE.
https://nrc-publications.canada.ca/eng/copyright
Vous avez des questions? Nous pouvons vous aider. Pour communiquer directement avec un auteur, consultez la première page de la revue dans laquelle son article a été publié afin de trouver ses coordonnées. Si vous n’arrivez pas à les repérer, communiquez avec nous à PublicationsArchive-ArchivesPublications@nrc-cnrc.gc.ca.
Questions? Contact the NRC Publications Archive team at
PublicationsArchive-ArchivesPublications@nrc-cnrc.gc.ca. If you wish to email the authors directly, please see the first page of the publication for their contact information.
NRC Publications Archive
Archives des publications du CNRC
This publication could be one of several versions: author’s original, accepted manuscript or the publisher’s version. / La version de cette publication peut être l’une des suivantes : la version prépublication de l’auteur, la version acceptée du manuscrit ou la version de l’éditeur.
For the publisher’s version, please access the DOI link below./ Pour consulter la version de l’éditeur, utilisez le lien DOI ci-dessous.
https://doi.org/10.1175/2009BAMS2568.1
Access and use of this website and the material on it are subject to the Terms and Conditions set forth at
A preliminary synthesis of modeled climate change impacts on U.S.
regional ozone concentrations
Weaver, C. P.; Liang, X.-Z.; Zhu, J.; Adams, P. J.; Amar, P.; Avise, J.;
Caughey, M.; Chen, J.; Cohen, R. C.; Cooter, E.; Dawson, J. P.; Gilliam, R.;
Gilliland, A.; Goldstein, A. H.; Grambsch, A.; Grano, D.; Guenther, A.;
Gustafson, W. I.; Harley, R. A.; He, S.; Hemming, B.; Hogrefe, C.; Huang,
H.-C.; Hunt, S. W.; Jacob, D.J.; Kinney, P. L.; Kunkel, K.; Lamarque, J.-F.;
Lamb, B.; Larkin, N. K.; Leung, L. R.; Liao, K.-J.; Lin, J.-T.; Lynn, B. H.;
Manomaiphiboon, K.; Mass, C.; Mckenzie, D.; Mickley, L. J.; O'neill, S. M.;
Nolte, C.; Pandis, S. N.; Racherla, P. N.; Rosenzweig, C.; Russell, A. G.;
https://publications-cnrc.canada.ca/fra/droits
L’accès à ce site Web et l’utilisation de son contenu sont assujettis aux conditions présentées dans le site LISEZ CES CONDITIONS ATTENTIVEMENT AVANT D’UTILISER CE SITE WEB.
NRC Publications Record / Notice d'Archives des publications de CNRC:
https://nrc-publications.canada.ca/eng/view/object/?id=a26df478-2d5c-4840-bea9-1d10eef1859a
https://publications-cnrc.canada.ca/fra/voir/objet/?id=a26df478-2d5c-4840-bea9-1d10eef1859a
A
zyxwvutsrqponmlkjihgfedcbaZYXWVUTSRQPONMLKJIHGFEDCBA
PRELIMINARY SYNTHESIS OF
MODELED
CLIMATE
CHANGE
IMPACTS ON U.S. REGIONAL
OZONE CONCENTRATIONS
BY C . P. WEA VER, X . - Z . LIANG, J. Z H U, P. J. ADAMS, P. A M A R, J. AVISE, M . CAUGHEY, J. CH EN , R. C . CO H EN , E. COOT ER, J. P. D A WSON , R. GILLIAM, A . GILLILAND, A . H . GOLDSTEIN, A . GRAMBSCH,D . GRA N O , A . GUENT HER, W . I. GUSTAFSON, R. A . HARLEY, S. H E, B. HEMMING, C . HOGREFE, H . - C . H UA N G, S. W . H UN T , D . J. JA C O B, P. L. KINNEY, K . KUN KEL, J. - F. LAMARQUE, B. LAMB, N . K . LARKIN, L. R. LEUNG, K. - J. LIAO, J.- T. LIN, B. H . LYNN, K . MANOMAIPHIBOON, C . MASS,
D . M CKEN ZI E, L . J. MICKLEY, S. M . O ' N EI L L , C . NOLTE, S. N . PANDIS, P. N . RACHERLA, C . ROSENZWEIG, A . G . RUSSELL, E. SALATHE, A . L. STEINER, E. TAGARIS, Z . TAO, S. TONSE,
C.
zyxwvutsrqponmlkjihgfedcbaZYXWVUTSRQPONMLKJIHGFEDCBA
W lE D IN M Y E R ,A.
W lLLIAM S ,D. A.
W lN N E R ,J.- H.
W O O ,S.
W u , AN DD. J.
WUEBBLESWi t h harmful ozone concentrations t ied t o meteorological conditions,
EPA investigates t he U.S. air quality implications of a changing climate.
zyxwvutsrqponmlkihgfedcbaZYXWVUTSRQPONMLKJIHGFEDCBA
D
zyxwvutsrqponmlkjihgfedcbaZYXWVUTSRQPONMLKJIHGFEDCBA
i s c u s s i o n o f t h e p o t e n t i a l s e n s i t i v i t y o f a i r quality to c l i m a t e c h a n g e has increased in recent years. I n 2 0 0 1 , t h e N R C ( a c r o n y m s d e f i n e d in Table 1) p o s e d t h e q u e s t i o n " t o w h a t e x t e n t will t h e U n i t e d States b e in c o n t r o l o f its o w n air quality in t h e c o m i n g d e c a d e s ? " n o t i n g t h a t " . . . c h a n g i n g c l i m a t i c c o n d i t i o n s c o u l d s i g n i f i c a n t l y affect the air q u a l i t y in s o m e r e g i o n s o f t h e U n i t e d States . . . " a n d c a l l e d for the e x p a n s i o n o f air quality studies to include investi-gation o f h o w U.S. air q u a l i t y is a f f e c t e d b y l o n g - t e r m c l i m a t i c c h a n g e s ( N R C 2 0 0 1 ) . A s u b s e q u e n t N R C re-p o r t e m re-p h a s i z e d that the U.S. air quality m a n a g e m e n t s y s t e m m u s t b e " f l e x i b l e a n d v i g i l a n t " to e n s u r e t h e e f f e c t i v e n e s s o f p o l l u t i o n m i t i g a t i o n strategies in t h e face o f c l i m a t e c h a n g e ( N R C 2 0 0 4 ) . T h e r e c e n t I P C C F o u r t h A s s e s s m e n t R e p o r t w a r n e d o f t h e p o s s i b i l i t y o f s i g n i f i c a n t air q u a l i t y d e g r a d a t i o n in s o m e r e g i o n s as a result o f climate-related c h a n g e s in the dispersion rate o f p o l l u t a n t s , t h e c h e m i c a l e n v i r o n m e n t for 03 a n d aerosol g e n e r a t i o n , a n d the s t r e n g t h o f e m i s s i o n s f r o m t h e b i o s p h e r e , f i r e s , a n d dust ( S o l o m o n et al. 2 0 0 7 ) . T h e m i s s i o n o f the E P A is to p r o t e c t h u m a n h e a l t h a n d t h e e n v i r o n m e n t . T o a c h i e v e t h i s m i s s i o n , t h e E P A i m p l e m e n t s a v a r i e t y o f p r o g r a m s u n d e r t h e
AMERICAN METEOROLOGICAL SOCIETY
C l e a n A i r A c t t h a t reduces a m b i e n t c o n c e n t r a t i o n s o f air p o l l u t a n t s . P o l l u t a n t s s u c h as 03 are n o t e m i t t e d
d i r e c t l y into t h e a t m o s p h e r e ; instead, t h e y are created b y c h e m i c a l r e a c t i o n s b e t w e e n N Ox a n d V O C s in t h e
p r e s e n c e o f heat a n d s u n l i g h t . T h e s e p o l l u t a n t s are e m i t t e d f r o m a v a r i e t y o f s o u r c e s , i n c l u d i n g m o t o r vehicles, c h e m i c a l a n d p o w e r plants, r e f i n e r i e s , fac-t o r i e s , a n d c o n s u m e r a n d c o m m e r c i a l p r o d u c fac-t s , as well as n a t u r a l s o u r c e s , s u c h as vegetation, l i g h t n i n g , a n d b i o l o g i c a l p r o c e s s e s in t h e soil. T h e EPA's efforts have b e e n s u c c e s s f u l : b e t w e e n 1 9 8 0 a n d 2 0 0 7 , e m i s -sions o f V O C s a n d N Ox d e c r e a s e d b y 5 0 % a n d 3 9 % ,
respectively, even t h o u g h t h e gross d o m e s t i c p r o d u c t increased 124%, vehicle miles traveled increased 103% a n d e n e r g y c o n s u m p t i o n i n c r e a s e d 3 0 % ( U . S . E P A 2 0 0 8 ) . A i r p o l l u t i o n , h o w e v e r , i n c l u d i n g 03 p o l l u -t i o n , c o n -t i n u e s -to b e a w i d e s p r e a d public h e a l -t h a n d e n v i r o n m e n t a l p r o b l e m in t h e U n i t e d S t a t e s , w i t h peak-level 03 c o n c e n t r a t i o n s in n u m e r o u s c o u n t i e s still e x c e e d i n g t h e N A A Q S for 03,[ a n d w i t h h e a l t h effects r a n g i n g f r o m i n c r e a s e d m o r t a l i t y to c h r o n i c effects o n r e s p i r a t o r y a n d c a r d i o v a s c u l a r h e a l t h (e.g., see J e r r e t t et al. 2 0 0 9 ) .
1 The standard is current ly set at 75 ppb for the 8- h NA A QS.
Significant regional variability already exists in ground-level 03 under current climate. A large body o f observational and modeling studies have shown that 03 c o n c e n t r a t i o n s tend to be especially h i g h where the emissions o f V O C s and N Ox are also large and that 03c o n c e n t r a i t o n s increase even more when m e t e o r o l o g i c a l conditions m o s t strongly favor net photochemical production—persistent high pressure, stagnant air, lack o f convection, clear skies, and warm temperatures (e.g., U.S. EPA 1989; N R C 1991; C o x and Chu 1993; Bloomfield et al. 1996; M o r r i s et al. 1995; Sillman and Samson 1995; U.S. EPA 1999; T h o m p s o n et al. 2001; Camalier et al. 2007; among m a n y others). C o n s e q u e n t l y , the 03 N A A Q S are m o s t o f t e n ex-ceeded during s u m m e r t i m e hot spells in places with large natural or anthropogenic precursor emissions (e.g., cities and suburban areas). Table 2 highlights a n u m b e r o f key meteorology-related factors.
B e c a u s e c l i m a t e c h a n g e m a y alter weather pat-terns and hence potentially increase the frequency, d u r a t i o n , a n d i n t e n s i t y o f 03 e p i s o d e s in s o m e r e g i o n s , it has t h e p o t e n t i a l to c r e a t e a d d i t i o n a l challenges for air quality m a n a g e r s . However, the causal c h a i n l i n k i n g (i) l o n g - t e r m global c l i m a t e c h a n g e , (ii) s h o r t - t e r m m e t e o r o l o g i c a l v a r i a b i l i t y that most directly drives peak 03 episodes, and (iii) 03 changes that ultimately result from the interaction o f these meteorological changes with the pollutants present in the environment (which may themselves be sensitive to meteorology) is not straightforward. Changes in the 03 distribution o f a given region as a result o f climate change will reflect a balance a m o n g
competing or reinforcing changes in multiple factors. T h e meteorological variables that affect O do not, in general, vary independently o f each other, nor must they vary in concert with corresponding effects on 03 concentrations. T h e 1991 N R C report noted that the relationship between temperature and 03 "cannot readily be extrapolated to a w a r m e r climate because higher temperatures are often correlated empirically with sunlight and m e t e o r o l o g y " ( N R C 1991). How the relationship between 03 and its meteorological drivers is perceived depends on the timescale consid-ered (see the sidebar on p. 5 for additional information about the t e m p e r a t u r e - 03 relationship).
In 1999, the EPA O R D Global Change Research P r o g r a m , in partnership with the EPA O A R , initi-ated an effort to increase scientific u n d e r s t a n d i n g o f the multiple complex interactions a m o n g climate, emissions, atmospheric chemistry, and air quality. T h e ultimate goal o f this ongoing assessment is to en-h a n c e ten-he ability o f air quality managers to consider global change in their decisions through improved c h a r a c t e r i z a t i o n o f the p o t e n t i a l effects o f global change on air quality, including 03, PM, and Hg. A n integrated assessment framework was designed that leveraged the research and development strengths w i t h i n b o t h t h e EPA a n d t h e a c a d e m i c r e s e a r c h c o m m u n i t y . T h i s design explicitly r e c o g n i z e d the challenges o f bridging spatial scales, temporal scales, and disciplines that characterize the global c h a n g e -regional air quality p r o b l e m . C o n s i s t e n t with the r e c o m m e n d a t i o n s o f an e x p e r t w o r k s h o p held in
2001 and those o f the 2001 N R C report cited earlier
ywvutsrponmlkjihgfedcbaZYXWVUTSRQPONMLKJIHGFEDCBA
A F F I L I A T I O N S :
zyxwvutsrqponmlkjihgfedcbaZYXWVUTSRQPONMLKJIHGFEDCBA
WEAV ER, C 0 0 T ER,zyxwvutsrqponmlkjihgfedcbaZYXWVUTSRQPONMLKJIHGFEDCBA
Gl LLIAM, Gl LLILAND, GRAM BSCH,GRAN O , HEM M ING, H UN T , N OLT E, AND WINNER
zyxwvutsrqponmlkjihgfedcbaZYXWVUTSRQPONMLKJIHGFEDCBA
— U.S. EnvironmentalProtection Agency, Washington, D. C . ; LIAN G, ZHU, M. CAUGH EY, KU N KEL* L I N * TAO, WILLIAM S, AND WUEBBLES—University of Illinois at Urbana-Champaign, Urbana, Illinois; AD AM S AND DAWSON—Carnegie Mellon University, Pittsburgh, Pennsylvania; AM AR AND H E —
Northeast States for Coordinated Air Use Management, Boston, Massachusetts;
AVISE
—California Air Resources Board, Sacramento, California;CHEN
—National Research Council Canada, Ottawa, Ontario, Canada; CO H EN , GOLD ST EIN, HARLEY, STEINER AND T O N SE—University of California, Berkeley, Berkeley, California; GUEN T H ER, LAMARQUE, AND WIEDINMYER—National Center for Atmospheric
Research, Boulder, Colorado; GUSTAFSON AND LEUNG—Pacific Northwest National Laboratory, Richland, Washington;
HOGREFE—University at Albany, Albany, New York; HUANG—Science Applications International Corporation, San Diego, California; JACOB, MICKLEY, AND WU— H a r v a r d University, Cambridge, Massachusetts;
KINNEY—Columbia University, New York, New York;
LAMB— Washington State University, Pullman, Washington; LARKIN AND MCKENZIE—U.S. Forest Service Pacific N orthwest Research
Station, Portland, Oregon; LIAO, M ANOM AIPHIBOON, RUSSELL, AND
TAGARIS—Georgia Institute of Technology, Atlanta, Georgia; L Y N N —
Weather It Is, Ltd., Efrat, Israel; M ASS AND SALATH£—University of Washington, Seattle, Washington; O'NEILL— U .S. Department of
Agriculture Natural Resources Conservation Service, Portland, Oregon; PANDIS—University of Patras, Rio Patras, Greece;
RACHERLA—Foundation for Research and Technology—Hellas, Heraklion, Crete, Greece; ROSENZWEIG—National Aeronautics and Space Administration/Goddard Institute for Space Studies, New York, New York; W oo— Konkuk University, Seoul, South Korea
^ A D D I T I O N A L A F F I L I A T I O N S : KUN KEL— Desert Research
Institute, Reno, Nevada;
LIN
—Harvard University, Cambridge, MassachusettsC O R R E S P O N D I N G A U T H O R : Chris Weaver, U.S. EPA (8601-P), 1200 Pennsylvania Avenue, Washington, DC, 20460.
E-mail: weaver.chris@ epamail.epa.gov
zyxwvutsrponmlkjihgfedcbaZYXWVUTSRPONMLKJIHGFEDCBA
The abstract for this article can be found in this issue, following the tableof contents.
D Oh l O. I I75/ 2009BAMS2568.I
In final f or m 23 June 2009
T A BLE 1.
zyxwvutsrqponmlkjihgfedcbaZYXWVUTSRQPONMLKJIHGFEDCBA
A c r o n y m s use d. AO Atmosphere-oceanAQ M Air quality model
CB-IV Carbon Bond Mechanism, version 4.0 CCM3 Community Climate Model, version 3 C M AQ Community Multiscale Air Quality
CMM5 University of Illinois Climate Version of Mesoscale Model, version 5 C M U Carnegie Mellon University
co
2 Carbon dioxideC O N U S Conterminous United States EPA Environmental Protection Agency GCM Global climate model
GCTM Global chemistry and transport model GEOS Goddard Earth Observing System G HG Greenhouse gases
GISS Goddard Institute for Space Studies
G N M Georgia Institute of Technology ( G IT ) - N orthe a st State for Coordinated Air Use Management (N E S C AU M )-Massachusetts Institute of Technology (MIT)
Hg Mercury
IPCC Intergovernmental Panel on Climate Change
JJA June-August
MDA8 Maximum daily 8-h average
MM5 Fifth-generation Pennsylvania State University-National Center for Atmospheric Research Mesoscale Model version 5 M O ZAR T Model for Ozone and Related Chemical Tracers
N AAQ S National Ambient Air Quality Standards NCER National Center for Environmental Research NERL National Exposure Research Laboratory N Ox Nitrogen oxides
NRC National Research Council
O3
OzoneOAR Office of Air and Radiation O H Hydroxide
O R D Office of Research and Development PAN Peroxyacetyl nitrate
PCM Parallel climate model PM Particulate matter ppb Parts per billion
RADM2 Regional Acid Deposition Model, version 2 RCM Regional climate model
RAQM Regional air quality model
SAPRC Statewide Air Pollution Research Center SAQM SARMAP* Air Quality Model
SAT Surface Air Temperature
so
2 Sulfur dioxideSTAR Science to Achieve Results
SRES Special Report on Emissions Scenarios VO C Volatile organic compound
W SU Washington State University
* SARMAP stands for San Joaquin Valley Air Quality Study (SJVAQS)/Atmospheric Utility Signatures, Predictions, and Experiments (AUSPEX) Regional Model Adaptation Project
T A BLE
zyxwvutsrqponmlkjihgfedcbaZYXWVUTSRQPONMLKJIHGFEDCBA
2 . M e t e o r o l o g i c a l v a r i a b l e s w i t h t h e p o t e n t i a l t o a f f e c t r e g i o n a l a ir q u a l i t y ( a d a p t e d f r o m U.S.
E P A 1 9 8 9 ) .T he average ma ximum or minimum te mpe ra ture a nd/ or changes in the ir spatial distribution and dura tion, leading to a change in re a ction rate coefficients and the solubility of gases in cloud wa te r solution;
T he fre que ncy and pa tte rn of cloud cover, leading to a change in re a ction rates and rates of conve rsion of S 02t o acid de position;
T he fre que ncy and intensity of stagnation episodes or a change in the mixing layer, leading to more or less mixing of pollute d air with ba ckground air;
Background bounda ry layer conce ntra tions of wa te r vapor, hydroca rbons, N Ox, and 03, leading to more or less dilution of pollute d air in the bounda ry
layer and a lte ring the chemical tra nsforma tion rates;
T he vegetative and soil emission of hydroca rbons and N Oxt h a t are sensitive
to te mpe ra ture and light levels, leading to changes in the ir conce ntra tions;
D e position rates to vegetative surfaces whose a bsorption of polluta nts is a function of moisture , te mpe ra ture , light intensity, and othe r fa ctors, leading to changes in conce ntra tions; and
C ircula tions and pre cipita tion pa tte rns, leading to a change in the abundance
of polluta nts de posite d locally versus those e xporte d off the contine nt,
zyxwvutsrqponmlkjihgfedcbaZYXWVUTSRQPONMLKJIHGFEDCBA
( N R C 2001), a m a j o r c o m p o n e n t o f the assessment approach is the development and application o f global to regional climate and air quality m o d e l i n g systems. O n e advantage o f the m o d e l - b a s e d approach under-lying the EPA assessment is that integrated climate, meteorology, a n d air quality m o d e l i n g systems are capable o f c a p t u r i n g a n u m b e r o f these complexities by representing interactions b e t w e e n variables in an internally self-consistent way across multiple space and t i m e scales.
T h i s paper highlights a n u m b e r o f EPA and EPA-funded studies focused on the effect o f the i m p a c t o f climate change on future air quality carried out under this assessment f r a m e w o r k . T h e goal is to provide a p r e l i m i n a r y s y n t h e s i s a c r o s s t h e results e m e r g i n g f r o m these studies, focusing on ground-level 03. A n EPA report on the assessment's scientific findings to date and their potential policy relevance provides a broader overview o f the assessment as a whole (U.S. EPA 2 0 0 9 ) . A n u m b e r o f these studies are also high-lighted in a recent review ( J a c o b a n d W i n n e r 2 0 0 9 ) .
P A R T I C I P A N T S A N D S C O P E . T h e E P A a s s e s s
m e n t was designed to be c a r r i e d out in two phases. In t h e first phase, m o d e l i n g s y s t e m s were u s e d to c o n s i d e r t h e sensitivity o f air q u a l i t y r e s p o n s e s to g l o b a l c l i m a t e c h a n g e a l o n e ; t h i s i n c l u d e s d i r e c t m e t e o r o l o g i c a l e f f e c t s o n a t m o s p h e r i c c h e m i s t r y a n d t r a n s p o r t a n d t h e effect o f t h e s e m e t e o r o l o g i -cal c h a n g e s on c l i m a t e - s e n s i t i v e n a t u r a l e m i s s i o n s o f pollutant p r e c u r s o r s (such as V O C s and N Ox) , but not changes in a n t h r o p o g e n i c e m i s s i o n s o f these pollutants (e.g., as a result o f future air quality m a n a g e m e n t e f f o r t s a n d /o r f u t u r e e c o n o m i c growth). T h e s e c o n d phase, n o w o n g o i n g , is t a c k l i n g t h e a d d i -tional complexities o f integrating t h e e f f e c t s o f s u c h c h a n g e s in a n t h r o p o g e n i c emissions, in the U n i t e d S t a t e s a n d w o r l d w i d e , with the c l i m a t e - o n l y effects in-vestigated in the first phase. T h e results d i s c u s s e d h e r e are f r o m the first phase only.
T h e findings synthesized here are t a k e n f r o m several p r o j e c t s carried out by e x t r a m u r a l t e a m s f u n d e d t h r o u g h the EPA's S T A R p r o g r a m w i t h i n the N C E R (visit h t t p : //e s . e p a . g o v /n c e r /s c i e n c e / globalclimate/recipients.html) as well as f r o m an i n t r a m u r a l effort w i t h i n the EPA's N E R L .2 Broadly, all o f the project t e a m s adapted ex-isting m o d e l i n g tools as c o m p o n e n t s for a s s e m b l i n g t h e i r g l o b a l - t o - r e g i o n a l c o m b i n e d c l i m a t e a n d air quality modeling systems, including G C T M s , G C M s , R C M s , a n d R A Q M s , a l o n g w i t h e m i s s i o n s m o d e l s and b o u n d a r y a n d initial c o n d i t i o n s datasets. T h e y applied these m o d e l i n g systems in n u m e r i c a l experi-ments designed to investigate the potential sensitivity o f U.S. air quality to global c l i m a t e change, focusing roughly on the 2050s. T h e modeling approaches taken essentially fall into two categories: (i) investigations o f large-scale patterns o f c l i m a t e c h a n g e effects on U.S. air quality using G C T M s a n d G C M s alone a n d (ii) investigations that focus on additional regional details o f p o t e n t i a l effects using d y n a m i c a l d o w n -scaling with nested R C M s and R A Q M s . It is useful to c o n s i d e r b o t h a p p r o a c h e s t o g e t h e r . T h e g l o b a l m o d e l s s i m u l a t e t h e w h o l e world in an i n t e r n a l l y self-consistent way across b o t h climate and chemistry, but they must use coarse spatial resolution because o f c o m p u t a t i o n a l d e m a n d , thereby potentially m i s s i n g or oversimplifying key processes. D y n a m i c a l down-scaling increases the resolution, a n d potentially the realism o f i m p o r t a n t regional processes, but at t h e e x p e n s e o f i n t r o d u c i n g lateral b o u n d a r y c o n d i t i o n s
into the simulation.
zyxwvutsrqponmlkjihgfedcbaZYXWVUTSRQPONMLKJIHGFEDCBA
2 Vi a an interagency partnership wit h the Nat ional
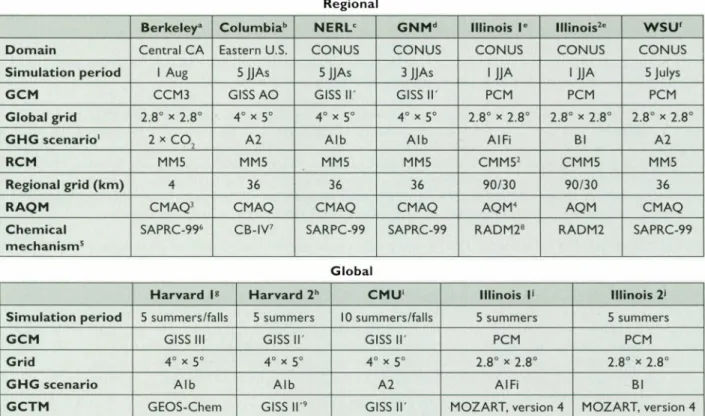
H a v i n g m u l t i p l e g r o u p s — w i t h d i f f e r e n c e s in emphasis and using a range (albeit still limited) o f models, chemical and physical parameterizations, and greenhouse gas scenarios—address the same problem enhances the richness o f the EPA assessment effort; the collective results may reveal choices to which the results are particularly sensitive, thereby building in-sight into the workings o f the coupled system. Table 3 provides a s u m m a r y of the global and regional model-ing experiments available to date from this first phase o f the assessment, highlighting the different combina-tions of modeling tools and other aspects o f simulation design. Collectively, these simulations (described in more detail in the papers listed in Table 3) represent a large body o f information from which to gain insights about the potential effects o f global climate change on regional air quality. T h e y are a valuable resource for the climate science, atmospheric chemistry, and air quality management communities.
T h i s paper synthesizes the findings from a subset o f these global and regional modeling experiments, focusing on nationwide changes in s u m m e r t i m e 03
c o n c e n t r a t i o n s due to simulated c l i m a t e c h a n g e a few decades into the future. O t h e r pollutants are not addressed here. Most o f the experiments focused on summer, as this is the p r i m a r y season for 03 episodes
and exceedances across m u c h o f the country.
ywvutsrponmlkjihgfedcbaZYXWVUTSRQPONMLKJIHGFEDCBA
S Y N T H E S I S O F M O D E L R E S U L T S .
zyxwvutsrponmlkjihgfedcbaZYXWVUTSRPONMLKJIHGFEDCBA
Regionalmodeling results. T h e principal c o m p a r i s o n in this section is across the regional modeling experiments listed in Table 3 that have model domains covering the entire c o n t i n e n t a l U n i t e d States: these are the N E R L , G N M , Illinois 1 and 2, and W S U experiments. T h e N E R L and G N M simulations both relied on the same M M 5 - d o w n s c a l e d G I S S I I ' G C M climate runs, t h o u g h G N M simulated three s u m m e r s c o m p a r e d to five s u m m e r s for N E R L , and they also differed in their development o f their emissions inventories. Results from the Berkeley and Columbia simulations, conducted for subsets o f the c o n t e r m i n o u s United States, are referred to in the c o u r s e o f the text to reinforce particular findings. Notice again that the
differences in I P C C S R E S scenarios for the Simula-
zyxwvutsrqponmlkjihgfedcbaZYXWVUTSRQPONMLKJIHGFEDCBA
THE TEMPERATURE- ^ RELATIONSHIP
ywvutsrponmlkihgfedcbaYXWVUTSRQPONMLKJIHGFEDCBA
As Seen From the Perspective of Three Different Time Scales zyxwvutsrqponmlkjihgfedcbaZYXWVUTSRQPONMLKJIHGFEDCBA
E P I S O D E . T he severity of a pa rticula r 03 episode lasting one or a fe w days can depend strongly on te mpe ra ture . For
example, A w and Kleeman (2003) found tha t by increasing te mpe ra ture (but w ithout modifying the othe r me te orologica l variables) in an air quality mode l simulation of a southe rn C a lifornia 03 episode, the y we re able to significantly increase daily
peak 03 conce ntra tions. T e mpe ra ture affects the kinetics of the 03- form ing and -de stroying chemical reactions. For example,
in pollute d e nvironme nts, increasing te mpe ra ture s will te nd to lead to more N Ox, and hence more 03, via a decrease in P AN
production. Recent EPA S T AR -funde d results have yielded similar insights for the EPA global cha nge -a ir quality assessment. Steiner e t al. (2 0 0 6 ), in a high-re solution simulation of a 5-day 03 episode ove r C alifornia, found tha t te mpe ra ture pe
rtur-bations consiste nt with plausible 2050s climate change led to increases in a fte rnoon 03 conce ntra tions of 1 - 5 ppb across
the state. D a wson et al. (2 0 0 7 ), using a diffe re nt mode ling system, found similar effects of te mpe ra ture modifica tion whe n simulating 03 conce ntra tions during a we e klong pe riod ove r the eastern U nite d States.
S E A S O N . F rom the perspective of an e ntire season, however, mean 03 conce ntra tion and the numbe r of 03 exceedances
will likely depend at least as much on how many of these me te orologica l episodes tha t promote 03 forma tion occur, and how
long the y last, as on how hot it is during each one. In othe r words, how ofte n in a given summe r tha t cool, cloudy, rainy, and windy conditions give way to spells of hot, clear, dry, and stagnant conditions will play a large role in de te rmining whe the r it was a "high 03" or "low 03" summer. A t this time scale, te mpe ra ture and 03 will also be positively corre la te d; however, here
the "t e m p e r a t u r e - 03" relationship exists at least pa rtly because te mpe ra ture itself is highly corre la te d with these othe r
me te orologica l conditions— such as more sunlight and less ve ntila tion- - tha t also favor increased 03 conce ntra tions.
L O N G - T E R M C L I M A T E C H A N G E . O n the multidecadal time scales of global climate change, the relationship be twe e n te mpe ra ture and these othe r me te orologica l drive rs may or may not play out in the same way tha t is characteristic of seasonal time scales. In some regions, climate change may indeed have the effect of producing long- te rm average associations be twe e n higher te mpe ra ture s, less cloudiness, and we a ke r mixing tha t, in aggregate, would be likely to lead to 03
concen-tra tion increases. This would likely be true , for example, in the regions whe re the IPCC (S olomon e t al. 2007) suggests the possibility of increases in the frequency, dura tion, and intensity of summe rtime heat waves. In othe r regions, however, climate change may lead to changes in these othe r variables tha t do not favor increases in 03 conce ntra tions. For example,
a wa rme r w orld is likely, on average, to be a w e tte r world. Similarly, regions tha t e xpe rie nce increases in cloudiness (and hence decreases in sunlight and 03 photoproduction) in an a lte re d future climate might have net 03 conce ntra tion decreases,
despite increased te mpe ra ture s.
tions listed in Table 3 refer only to greenhouse gas concentrations and not to precursor pollutants. As emphasized earlier, all o f the results shown here are from simulations that held anthropogenic emissions o f precursor pollutants constant at present-day levels but allowed climate-sensitive natural emissions o f biogenic V O C s to vary in response to the simulated climate changes.
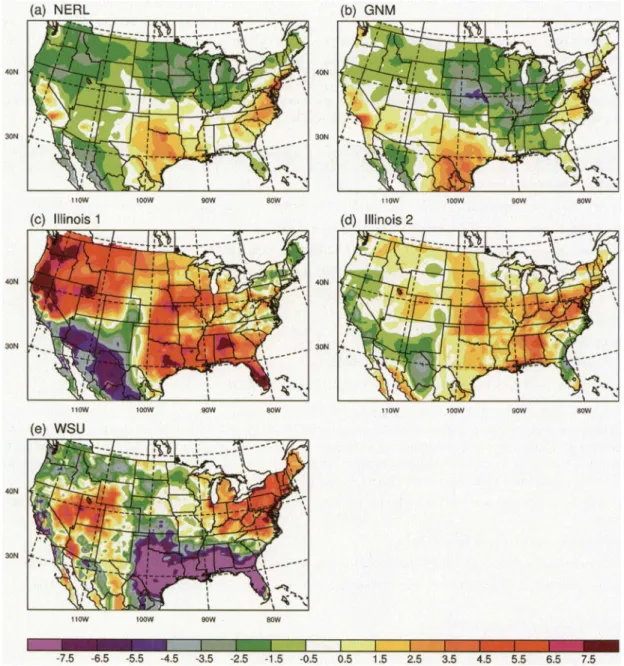
Figure 1 shows s u m m e r t i m e mean M D A 8 03 con-centration differences between future and present-day climates. T h i s air quality metric is selected because o f its direct relevance to U.S. air quality standards. Several key similarities emerge. First, for all the pairs o f s i m u l a t i o n s , substantial regions o f the c o u n t r y s h o w i n c r e a s e s in 03 c o n c e n t r a t i o n s o f r o u g h l y 2 - 8 ppb under a future climate. O t h e r regions show little change in 03 concentrations—or even decreases. Importantly, these patterns o f c l i m a t e - i n d u c e d 03 concentration changes were accentuated in the 95th
percentile M D A 8 03 compared to the mean M D A 8 03, as shown in Fig. 2 for the N E R L results. T h i s result, o f greater climate sensitivity o f 03 at the high end o f the 03 distribution, is robust across all o f the differ-ent modeling groups, as d o c u m e n t e d in the papers cited. T h i s is significant b e c a u s e it is the h i g h - 03 episodes that most concern air quality managers in the United States.
T h e r e are also significant differences, however, in the b r o a d spatial p a t t e r n s o f c h a n g e simulated by the different modeling groups. For example, the N E R L and G N M simulations show increases in 03 concentration in the mid-Atlantic region and parts o f the Northeast, G u l f Coast, and parts o f the West. T h e y also show decreases in the upper Midwest and N o r t h w e s t and little c h a n g e elsewhere, i n c l u d i n g the Southeast. By contrast, the Illinois-1 experiment shows the strongest increases in the Southeast, the
Northwest, and the Mississippi Valley (as well as in
zyxwvutsrqponmlkjihgfedcbaZYXWVUTSRQPONMLKJIHGFEDCBA
T A BLE
zyxwvutsrqponmlkjihgfedcbaZYXWVUTSRQPONMLKJIHGFEDCBA
3 . T h e c l i m a t e c h a n g e - a i r q u a l i t y g lo b a l a n d r e g i o n a l m o d e l i n g s i m u l a t i o n s c o m p l e t e d t o d a t e as p a r t o f t h e E P A a s s e s s m e n t. T h e S R E S s c e n a rio s lis te d re fe rywvutsrponmlkihgfedcbaWVUTSRQPNMIHGFECBA
only t o greenhouse gas concent rat ions, as a ll s i m u l a -t i o n s discusse d b e l o w h e ld a n -t h r o p o g e n i c e m is s io n s o f 03 p r e c u r s o r p o l l u t a n t s c o n s t a n t b e t w e e n p r e s e n t-da y a n d f u t u r e s i m u l a t i o n s . T h e I llinois- 1 a n d - 2 r e g i o n a l a n d g lo b a l m o d e l r u n s ha ve i d e n t i c a l s e tu p s b u t a r e d r i v e n by t h e A l F i a n d t h e B l S R E S g r e e n h o u s e ga s s c e n a rio s , re s p e c tiv e ly . T h e h o r i z o n t a l g r i d - c e l l siz e liste d is t h a t o f t h e a ir q u a l i t y s i m u l a t i o n s , w i t h t h e e x c e p t i o n o f t h e I llinois r e g i o n a l ru n s , w h i c h use 3 0 - k m g r i d sp a cin g o v e r f o u r s u b re g io n s o f t h e c o u n t r y a n d 9 0 - k m e v e r y w h e r e e lse . F o r t h e 03 p lo t s s h o w n
b e l o w , t h e s e 3 0 - k m va lue s in t h e s u b r e g io n s a r e o v e r l a i d o n t h e b a c k g r o u n d m a p o f 9 0 - k m va lue s. F o r m o r e d e ta ils o n G E O S - C h e m , se e h t t p : / / h o m e p a g e s . s e e . l e e d s . a c . u k / ~ l e c m e / G E O S - C H E M . F o r m o r e d e ta ils o n M O Z A R T , se e H o r o w i t z e t a l. ( 2 0 0 3 ) a n d h t t p : / / g c t m . a c d . u c a r . e d u / M o z a r t / m o d e l s / m 4 / i n d e x . s h t m l .
R e g io n a l
B e r k e l e y3 C o l u m b i a6 N E R LC G N Md I llin o is le I llinois2 6
ywvutsrponmlkihgfedcbaYXWVUTSRQPONMLKJIHGFEDCBA
w su
fD o m a i n C e ntra l C A Eastern
zyxwvutsrqponmlkjihgfedcbaZYXWVUTSRQPONMLKJIHGFEDCBA
U.S.
C O N U S C O N U S C O N U S C O N U S C O N U SS i m u l a t i o n p e r i o d 1 Aug SJJAs SJJAs 3JJAs 1 JJA 1 JJA 5 Julys G C M C C M 3 GISS A O GISS II' GISS IR P C M P C M P C M G l o b a l g r i d 2.8° x 2.8° 4° x 5° 4° x 5° 4° x 5° 2.8° x 2.8° 2.8° x 2.8° 2.8° x 2.8° G H G sce na rio1 2 x C 02 A 2 A l b A l b AlF i Bl A 2
R C M M M 5 M M 5 M M 5 M M 5 C M M 52 C M M 5 M M 5
R e g io n a l g r i d ( k m ) 4 36 36 36 9 0 / 3 0 9 0 / 3 0 36
R A Q M C M A Q3 C M A Q C M A Q C M A Q A Q M4 A Q M C M A Q
C h e m i c a l m e c h a n i s m5
SAPRC- 996 CB
- IV
7 SARPC-99 SAPRC-99 R AD M 28 R A D M 2 SAPRC-99G l o b a l
H a r v a r d lg H a r v a r d 2h C M U ' I llin o is 1' I llino is 2'
S i m u l a t i o n p e r i o d 5 summers/falls 5 summe rs 10 summers/falls 5 summe rs 5 summe rs
G C M GISS III GISS II' GISS II' P C M P C M
G r i d 4° x 5° 4° x 5° 4° x 5° 2.8° x 2.8° 2.8° x 2.8°
G H G s c e n a r i o A l b A l b A 2 AlF i Bl
the G u l f C o a s t , which is in a g r e e m e n t with N E R L ) , w i t h w e a k e r i n c r e a s e s i n t h e u p p e r M i d w e s t . I n addition, these changes tend to be larger t h a n t h o s e f r o m the N E R L e x p e r i m e n t . T h e W S U e x p e r i m e n t shows the largest increases in the N o r t h e a s t , parts o f the Midwest, a n d desert Southwest, with decreases in the W e s t , the Southeast, the plains states, a n d the G u l f Coast.3 As is to be expected, the N E R L and G N M patterns are quite similar, with differences r e f l e c t i n g the averaging over five c o m p a r e d to t h r e e s u m m e r s , respectively (this highlights the potential i m p o r t a n c e o f i n t e r a n n u a l variability in driving differences b e -tween m o d e l i n g groups). T h e earlier C o l u m b i a study (for the eastern h a l f o f the U n i t e d States only) shows the largest 03 i n c r e a s e over t h e lower Midwest a n d the m i d - A t l a n t i c regions.
C e r t a i n regions show greater agreement across ex-periments t h a n others, at least in a very general sense.
For example, Fig. 1 shows that a loosely b o u n d e d area, e n c o m p a s s i n g parts o f the m i d - A t l a n t i c , N o r t h e a s t , a n d lower M i d w e s t r e g i o n s , tends to s h o w at least s o m e 03 increase across all the simulations. B y c o n -t r a s -t , -t h e W e s -t a n d -t h e S o u -t h e a s -t /G u l f C o a s -t are areas o f greater disagreement. Even for these regions, however, at least s o m e o f the models (including the global m o d e l s discussed in the following subsection) show substantial c l i m a t e - i n d u c e d 03 increases.
S e v e r a l i m p o r t a n t m e t e o r o l o g i c a l a n d m e t e o -rology-related p a r a m e t e r s drive these changes in 03 c o n c e n t r a t i o n . T h e s e m e a n f u t u r e - m i n u s - p r e s e n t c h a n g e s are s h o w n in Figs. 3 - 5 . C h a n g e s in m e a n 03 will tend to result, however, f r o m m e t e o r o l o g i c a l c h a n g e s on t h e daily to m u l t i d a y t i m e scales o f 03 episodes (refer to sidebar), so t h e l o n g e r - t e r m aver-ages shown in these figures will necessarily only tell
part o f the story.
zyxwvutsrqponmlkjihgfedcbaZYXWVUTSRQPONMLKJIHGFEDCBA
3 Note that the WSU results are for July only as opposed to averages over June, July, and August as for all the other simulations.
This may have some consequences for direct comparison, which w i l l be discussed further later i n the paper.
zyxwvutsrqponmlkjihgfedcbaZYXWVUTSRQPONMLKJIHGFEDCBA
T A BLE 3 .
zyxwvutsrqponmlkjihgfedcbaZYXWVUTSRQPONMLKJIHGFEDCBA
C o n t i n u e d .a For more details, see Steiner e t al. (2 0 0 6 ).
b For more details, see H ogre fe e t al. (2004a,b); the GISS A O mode l refers to the mode l of Russell e t al. (1995).
c For more details, see Leung and G ustafson (2 0 0 5 ); N olte e t al. ( 2 0 0 8 ) .
d For more details, see Tagaris e t al. (2 0 0 7 ); Liao e t al. (2 0 0 7 ); W o o e t al. ( 2 0 0 8 ) .
e For more details, see Liang e t al. (2 0 0 6 ); Huang e t al. (2007, 2 0 0 8 ) ; Tao e t al. (2 0 0 7 ). f For more details, see C he n e t al. ( 2 0 0 8 ) ; Avise e t al. (2 0 0 9 ).
s For more details, see W u e t al. (2007, 2008a,b).
h For more details, see M ickley e t al. ( 2 0 0 4 ) .
1 For more details, see Racherla and Adams (2 0 0 6 , 2 0 0 8 ) .
' For more details, see Tao e t al. (2 0 0 7 ); Lin e t al. ( 2 0 0 8 ) ; Huang e t al. ( 2 0 0 8 ) .
1 M ost of the models use the IPCC SRES scenarios (N a kice novic e t al. 2 0 0 0 ) as the ir global G H G tra je ctorie s into the
future . These scenarios re pre se nt diffe re nt storyline s: for example, A l b and AlF i both have rapid e conomic grow th and a mid- ce ntury peak in popula tion but with energy te chnology in A l b spread among a dive rsity of sources, whereas fossil fuels domina te in A l Fi; Bl has a popula tion profile similar to A l b and A l Fi but with a rapid tra nsition to clean energy and efficient use of resources; and A 2 has a continuously increasing popula tion and a highly regional w orld economy.
2 C M M 5 is based on the standard M M 5 but with modifica tions to the buffe r zone, ocean interface, and cloud- ra dia tion
inte ra ctions.
3 For more details, see Byun and Schere (2 0 0 6 ).
4 A Q M has been adapted from the S AQ M , incorpora ting a faster, more accurate numerical solver for gas-phase che mistry.
5 N otice tha t the SAPRC-99 and R A D M 2 chemical mechanisms recycle isoprene nitra te , whereas the C B- I V mechanism
does not.
6 For more details, see C a rte r ( 2 0 0 0 ) .
7 For more details, see G e ry e t al. (1989). 8 For more details, see S tockwe ll e t al. (1990).
9 T he GISS II' mode l was couple d to the H a rva rd troposphe ric 03- N Ox- h y d r o c a r b o n chemical mode l; for more details,
see M ickley e t al. (1999).
O n e way to s u m m a r i z e what Figs. 3 5 , in c o n -j u n c t i o n with Fig. 1, are showing us is that 03 largely responds to the m e t e o r o l o g i c a l drivers in a qualita-tively consistent m a n n e r across the different c l i m a t e change experiments, but the regional patterns o f rela-tive changes in these drivers are highly variable across these sets o f simulations. I n o t h e r words, there are important differences in the simulated future regional climate changes that seem to drive the differences in the regional patterns o f 03 increases and decreases as a result o f differences in the m o d e l i n g systems, model c o n f i g u r a t i o n , a n d e x p e r i m e n t a l design choices used by the different groups.
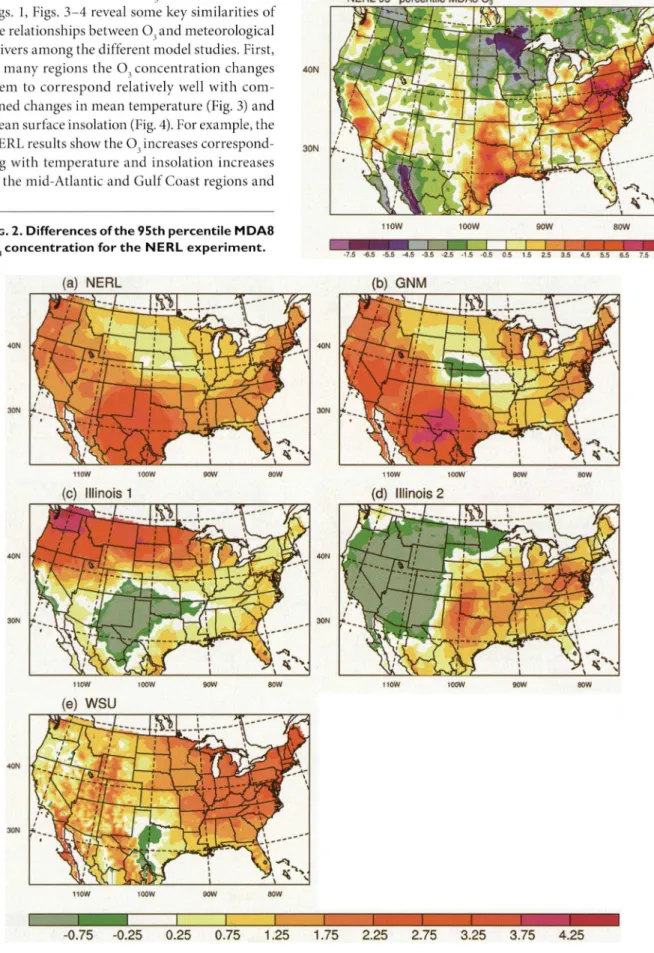
S p e c i f i c a l l y , Figs. 3 a n d 4 d i s p l a y t h e a v e r a g e f u t u r e - m i n u s - p r e s e n t d i f f e r e n c e s in n e a r - s u r f a c e air t e m p e r a t u r e a n d s u r f a c e i n s o l a t i o n , w h i c h are t w o o f t h e m o s t c r i t i c a l m e t e o r o l o g i c a l drivers o f ground-level O . T h e insolation c h a n g e s largely reflect changes in cloud cover. O t h e r variables e x a m -ined include average daily m a x i m u m t e m p e r a t u r e , precipitation, n u m b e r o f r a i n y days, a n d b o u n d a r y layer depth. However, n o n e o f these additional c o m -p a r i s o n s is s h o w n here, as t h e y largely m i r r o r t h e relationships with temperature and surface insolation b e c a u s e o f the strong correlations a m o n g a n u m b e r
o f these variables.
zyxwvutsrqponmlkjihgfedcbaZYXWVUTSRQPONMLKJIHGFEDCBA
FIG. I.
zyxwvutsrqponmlkjihgfedcbaZYXWVUTSRQPONMLKJIHGFEDCBA
F u t u r e ( 2 0 5 0 s ) - m i n u s - p r e s e n t d i f f e r e n c e s in s i m u l a t e d s u m m e r t i m e - m e a n M D A 80
3 c o n c e n t r a t i o n s ( p p b ) f o r t h e ( a ) N E R L , ( b ) I llinois I , ( c) I llinois 2 , ( d ) W S U , a n d ( e ) G N M e x p e r i -m e n t s ( se e T a b le 3 ) .C o m b i n e d w i t h t h e 03 r e s u l t s s h o w n i n Figs. 1, Figs. 3 - 4 reveal s o m e key similarities o f the relationships between 03 and meteorological drivers a m o n g the different model studies. First, in m a n y regions t h e 03 c o n c e n t r a t i o n c h a n g e s s e e m to c o r r e s p o n d relatively well w i t h c o m -bined changes in m e a n temperature (Fig. 3) and m e a n surface insolation (Fig. 4). For example, the N E R L results show the O increases correspond-ing with t e m p e r a t u r e a n d i n s o l a t i o n i n c r e a s e s
in the mid-Atlantic and G u l f Coast regions and
zyxwvutsrqponmlkjihgfedcbaZYXWVUTSRQPONMLKJIHGFEDCBA
FIG
zyxwvutsrqponmlkjihgfedcbaZYXWVUTSRQPONMLKJIHGFEDCBA
. 2. D iffe re nce s of t h e 9 5 th p e rce n tile M D A 8 03 c o n c e n t r a t i o n f o r t h e N E R L e x p e r i m e n t .FIG. 3.
S a m e as F ig.I
b u t f o r n e a r- s u rfa c e a irT (°C).
03 decreases associated with the insolation decreases and the local m i n i m u m in temperature increases in the upper Midwest and the northern plains. In other regions, temperature and insolation vary in opposite directions, with mixed effects on 03 concentrations. For example, in the Illinois-1 simulations, despite insolation decreases over much o f the Northwest, the large increase in temperature there seems to drive 03 increases. Finally, in a small number o f regions across the simulations, there is no strong correspondence between 03 concentrations and either insolation or temperature (e.g., the areas around O k l a h o m a in the Illinois-1 experiment and Nevada/Utah/Idaho in the
Illinois-2 experiment), suggesting that other forcing factors may be i m p o r t a n t and/or that a correspon-dence might exist, but only for different averaging pe-riods and statistics o f these variables. T h e differences between the N E R L and G N M results from Figs. 1, 3, and 4 are consistent with these insights—for example, in the Plains states, G N M shows greater 03 decreases, consistent with the differences in temperature and insolation trends between the results from the two groups.
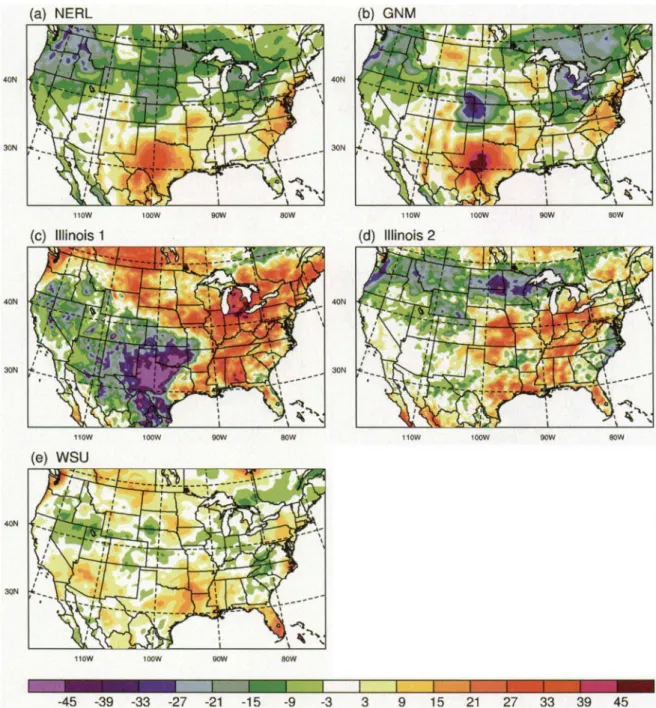
Figure 5 shows the patterns o f changes in m e a n biogenic V O C emissions. As documented in earlier work (e.g., Chameides et al. 1988; Roselle et al. 1991;
Guenther et al. 1994; Pierce et al. 1998; Fuentes et al. 2 0 0 0 ; Purves et al. 2 0 0 4 ; among others), the emissions o f these important natural 03 precursors are them-selves sensitive to meteorology, including sunlight and temperature. Therefore, in conjunction with the direct forcing exerted on 03 processes by changes in meteorology, c l i m a t e - i n d u c e d changes in biogenic emissions levels can lead to changes in 03 c o n c e n -trations as well (see also Zhang et al. 2008). As will be discussed again later, in the context o f the global modeling results, this effect depends on the relative
amounts o f N O and V O C s in the environment. For
zyxwvutsrponmlkihgfedcbaYXWVUTSRPONMLKJIHGFEDCBA
X
example, the Berkeley experiment found significant
03 c o n c e n t r a t i o n i n c r e a s e s in t h e h i g h - N Ox S a n Francisco Bay area due to increases in biogenic V O C emissions, whereas even larger increases in biogenic emissions over the Sierras actually produced slight 03 decreases.
T h e climate-induced biogenic emissions changes (Fig. 5) seem to contribute to the 03 concentration changes, but only in some regions and not wholly c o n s i s t e n t l y a c r o s s m o d e l s t u d i e s . F o r e x a m p l e , temperature-driven increases in biogenic emissions may contribute to the earlier-mentioned 03 increases in the Northwest in the Illinois-1 e x p e r i m e n t , the mid-Atlantic region in the N E R L and G N M
experi-FI G
zyxwvutsrqponmlkjihgfedcbaYXWVUTSRPONMLKJIHGFEDCBA
. 5. A s in Fi g . I , b u t f o r b i o g en i c V O C em i ssi o n s (i n g C m- 2 d ay- 1) .zyxwvutsrqponmlkjihgfedcbaZYXWVUTSRQPONMLKJIHGFEDCBA
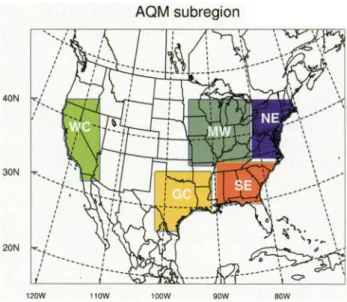
FIG. 6.
zyxwvutsrqponmlkjihgfedcbaZYXWVUTSRQPONMLKJIHGFEDCBA
T h e a ve ra ging subre gions use d in F ig.7.
zyxwvutsrqponmlkjihgfedcbaZYXWVUTSRQPONMLKJIHGFEDCBA
ments, the Northeast in the Illinois-2 experiment, and the Southeast in the Illinois-1 experiment. In contrast, in parts o f the Southeast and the mountainous West in the N E R L and G N M experiments, emissions increase s i g n i f i c a n t l y but 03 c o n c e n t r a t i o n s do not c h a n g e . Notably, the W S U simulation shows large decreases in 03 in s o m e o f the parts o f the
Southeast and G u l f C o a s t where increases in V O C emissions are the strongest, a result that is partially attributed to increases in precipita-tion. W h e r e there are strong corre-lations between biogenic emissions c h a n g e s a n d O c o n c e n t r a t i o n changes, often there are similarly strong changes in insolation and/ o r t e m p e r a t u r e , so s e p a r a t i n g the different effects is not always straightforward. T h e earlier work by the Columbia group found the strongest increases in e m i s s i o n s in t h e S o u t h e a s t , s i m i l a r to t h e results from the N E R L and Illinois 1- and -2 experiments, but found that the largest 03 c o n c e n t r a t i o n changes that could be attributed to b i o g e n i c e m i s s i o n s c h a n g e s o c c u r r e d instead in parts o f the O h i o Valley and the coastal mid-Atlantic region.
Discerning the precise chemi-cal pathways whereby O responds to changes in biogenic emissions, a n d how these pathways v a r y as a function o f region and climatic
c o n d i t i o n s , is an area o f o n g o i n g scientific inquiry. Different air quality models employ different repre-sentations o f these pathways in their code. As such, d i f f e r e n c e s b e t w e e n t h e s i m u l a t e d 03 r e s p o n s e to changes in simulated biogenic emissions from different modeling systems is at this t i m e a key source o f uncer-tainty in climate change effects on future air quality, particularly in regions where the effect o f increasing V O C concentrations is highly dependent on N Ox levels. It will be discussed further in the intercomparison o f the results f r o m the two G C T M experiments whether or not the air quality model recycling isoprene nitrate appears to be a key determinant o f the response o f 03 to climate-induced changes in biogenic V O C emissions. Table 3 shows that all the regional model experiments whose results are shown in Fig. 1 have chemical mecha-nisms that do recycle isoprene nitrate.
Figure 6 shows the averaging subregions used in Fig. 7, w h i c h s u m m a r i z e s t h e se results by s h o w i n g regional averages f r o m all the m o d e l i n g groups o f the c l i m a t e - i n d u c e d differences in o z o n e a n d the drivers we have discussed earlier. (For future reference, Fig. 7 also shows the averages for the two global m o d e l i n g e x p e r i m e n t s discussed below.)
T h e regional modeling findings presented here are generally consistent with the relatively few regional climate change and air quality modeling experiments recently carried out for Europe. For example, Forkel and K n o c h e (2006) simulated changes in near-surface 03 concentrations between the 1990s and the 2 0 3 0 s over southern G e r m a n y under climate change but no change in anthropogenic emissions. T h e y found a 10% increase in average daily m a x i m u m 03 during s u m m e r (approximately 2 - 6 ppb, depending on loca-tion in the model domain). Langner et al. (2005), in a set o f regional modeling experiments, found climate c h a n g e - i n d u c e d increases in A p r i l - S e p t e m b e r 03 c o n c e n t r a t i o n s d u r i n g the m i d - t w e n t i e t h c e n t u r y compared to the present over southern and central Europe, with decreases over n o r t h e r n Europe, and that these changes were significant with respect to interannual variability. M e l e u x et al. ( 2 0 0 7 ) found higher s u m m e r t i m e 03 concentrations under future c l i m a t e c o n d i t i o n s o v e r E u r o p e , p r i m a r i l y due to i n c r e a s e d t e m p e r a t u r e s , d e c r e a s e d c l o u d i n e s s and precipitation, and increases in biogenic V O C emissions. T h e y also found large regional variability in these 03 changes. Finally, Szopa and Hauglustaine
(2007) found worsening 03 conditions over Europe as a result o f anticipated climate change in 2030, though this was sensitive to the choice o f global and regional
emissions change scenarios.
zyxwvutsrponmlkjihgfedcbaZYXWVUTSRPONMLKJIHGFEDCBA
Global modeling results. A comparison o f results (not s h o w n ) f r o m all the global e x p e r i m e n t s listed in Table 3 supports the most general conclusions from the regional modeling studies; that is, large regions o f the c o u n t r y show future 03 concentration increases o f a few to several parts per billion, and there are significant differences in the spatial patterns o f these changes between the simulations. In a global con-text, the results from these simulations are generally consistent with other G C T M climate change experi-ments (e.g., see M u r a z a k i and Hess 2 0 0 6 ; Stevenson et al. 2 0 0 6 ; Zeng et al. 2 0 0 8 ) — f o r example, decreases in b a c k g r o u n d 03 concentrations in clean environ-ments (e.g., the oceans) because o f increased water vapor concentrations and increases regionally over the polluted continents.
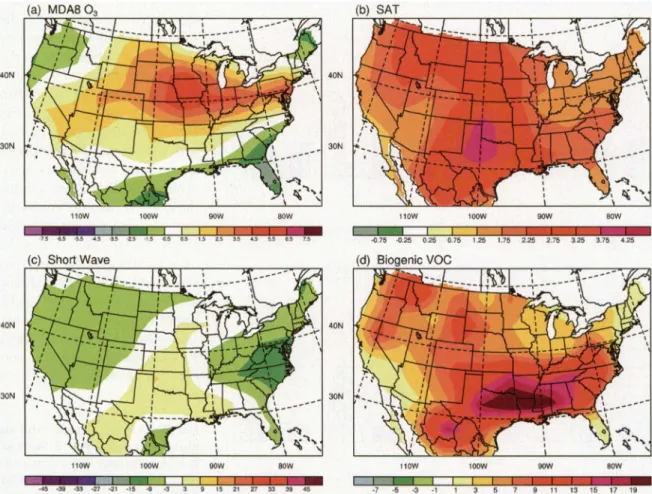
A m o r e detailed look at these simulations helps i l l u s t r a t e two a d d i t i o n a l p o i n t s : (i) the p o t e n t i a l i m p o r t a n c e for s i m u l a t e d future 03 o f large-scale circulation changes and (ii) the i m p o r t a n c e o f h o w i s o p r e n e c h e m i s t r y is represented in the modeling systems. F i g u r e 8 s h o w s t h e m e a n M D A 8 03 c h a n g e s f r o m t h e H a r v a r d - 1 e x p e r i m e n t , a l o n g with a c c o m p a n y i n g c h a n g e s in temperature, insolation, and bio-genic emissions. In these results, the largest O increases are mostly in a sweeping pattern f r o m the central United States, across the p l a i n s states a n d t h e M i d w e s t , and extending into the Northeast. In contrast to the regional model results shown earlier, there is not as obvious a spatial correlation b e t w e e n the c h a n g e s in 03 and
t h o s e o f a n y o n e o f t h e d r i v e r
zyxwvutsrqponmlkjihgfedcbaZYXWVUTSRQPONMLKJIHGFEDCBA
FIG
zyxwvutsrqponmlkjihgfedcbaZYXWVUTSRQPONMLKJIHGFEDCBA
. 7. A v e r a g e s a cross t h e s u b re -g i o n s s h o w n in F i-g. 6 f o r e a c h o ft h e s i m u l a t i o n s f o r m e a n s u m m e r f u t u r e - m i n u s - p r e s e n t diffe re nce s in ( a ) M D A 8 03 ( p p b ) ; ( b) ne a r- surfa ce
a ir t e m p e r a t u r e ( ° C ) ; ( c) s u r f a c e in so la tio n ( W m~2) ; a nd ( d) bioge nic
V O C e m issions ( g C m~2 da y"1) .
v a r i a b l e s . T h e i n s o l a t i o n i n c r e a s e in t h e M i d w e s t m a t c h e s , to s o m e degree, the pattern o f 03 increase there; however, the largest t e m p e r a t u r e , insolation, a n d biogenic emissions increases o c c u r in the south-ern part o f the country, where there are m u c h smaller changes in O . T h i s weak relationship also holds for a n u m b e r o f o t h e r variables considered but not shown (e.g., precipitation, P B L height, a n d so on).
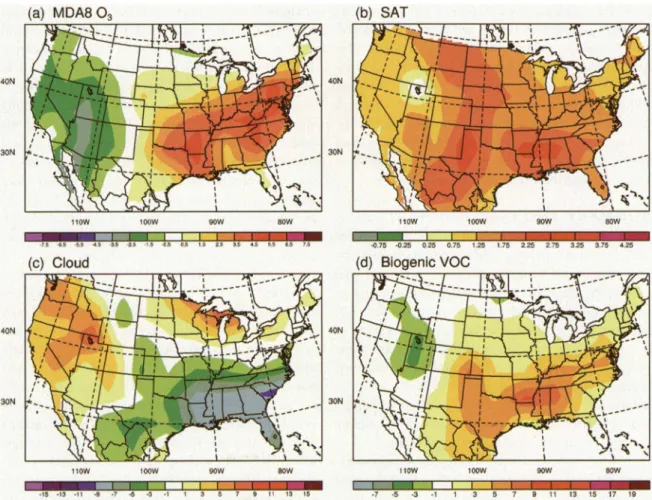
I n Fig. 9, w h i c h shows t h e s a m e q u a n t i t i e s for t h e C M U e x p e r i m e n t , a different r e g i o n a l p a t t e r n o f c h a n g e e m e r g e s . I n t h e C M U e x p e r i m e n t , t h e m a j o r increase in future 03 c o n c e n t r a t i o n is instead c e n t e r e d o n t h e G u l f C o a s t a n d e a s t e r n s e a b o a r d , with m i n i m a l 03 c h a n g e s in the upper Midwest a n d n o r t h e r n plains states.
T h e differences between these two sets o f results c a n s e e m i n g l y m o s t l y b e e x p l a i n e d b y two factors: (i) differences in the future s i m u l a t i o n o f the s u m -m e r t i -m e s t o r -m t r a c k across the n o r t h e r n part o f the c o u n t r y a n d (ii) differences in the m o d e l e d c h e m i c a l m e c h a n i s m for isoprene oxidation in the southeastern U n i t e d States.
A s e x p l a i n e d i n W u et al. ( 2 0 0 8 a ) , t h e r e a r e t w o d i s t i n c t d y n a m i c a l s h i f t s f r o m t h e p r e s e n t to t h e f u t u r e c l i m a t e in t h e H a r v a r d - 1 e x p e r i m e n t : a d e c r e a s e in s u m m e r t i m e c y c l o n e s t r a c k i n g a c r o s s the upper part o f the U n i t e d States, resulting in a de-crease in cloudiness a n d precipitation over the upper Midwest (as reflected in the insolation changes shown in Fig. 8), a n d a n o r t h w a r d shift o f the B e r m u d a high, resulting in a decrease in convective activity over the G u l f C o a s t and the s o u t h e r n Great Plains. All o t h e r factors b e i n g equal, b o t h shifts m i g h t b e e x p e c t e d to c o n t r i b u t e to 03 c o n c e n t r a t i o n increases in their respective regions.
In this context, the spatial pattern o f 03 c o n c e n t r a -tion increases in Fig. 8a is c e r t a i n l y consistent with the decrease in cyclones in the n o r t h in the Harvard-1 e x p e r i m e n t , as suggested in W u et al. ( 2 0 0 8 a ) a n d originally posited in M i c k l e y et al. ( 2 0 0 4 ) ; that is, the decrease in cold surges in the simulated future climate leads to a decrease in t h e clearing o f pollutants f r o m the b o u n d a r y layer. Racherla a n d A d a m s ( 2 0 0 8 ) , on
the other h a n d , e x a m i n e d the distribution o f sea level
zyxwvutsrqponmlkjihgfedcbaZYXWVUTSRQPONMLKJIHGFEDCBA
FIG
zyxwvutsrqponmlkjihgfedcbaZYXWVUTSRQPONMLKJIHGFEDCBA
. 8 . F u t u r e - m i n u s - p r e s e n t d iffe re n c e s in s i m u l a t e d s u m m e r t i m e m e a n ( a ) M D A 80
3 c o n c e n t r a t i o n ( p p b ) ; ( b ) n e a r- s u rfa c e a ir t e m p e r a t u r e ( ° C ) ; ( c) surfa ce in s o la tio n ( W m "2) ; a n d ( d ) bioge nic is o p re n epressure a n o m a l i e s in the present-day and future C M U simulations and found only relatively small changes in these regions. These results suggest that storm-track activity does not decrease as much in this C M U model simulation [see also Leibensperger et al. (2008) for further discussion]. In any case, it seems plausible that differences in simulated future large-scale circulation patterns explain the differences in future 03 changes simulated in the two experiments for the northern part o f the country.
T h e even larger differences in simulated future 03 changes in the southern half o f the country likely arise because o f differences in how isoprene chemistry is described in the Harvard-1 and C M U modeling sys-tems, leading to differences in how 03 responds to the climate-induced changes in biogenic V O C emissions. The spatial patterns of future-minus-present changes in isoprene emissions shown in Figs. 8d and 9d are quali-tatively similar, with the largest increases centered on the Southeast and Gulf Coast regions for both groups. Examining the C M U results in Fig. 9, it appears that increases in temperature and decreases in cloud cover (and hence increases in insolation) have combined to lead to increases in both isoprene emissions and 03
concentrations in this region. A n additional C M U simulation with future meteorology but scaled-back isoprene emissions has confirmed that the enhanced 03 chemical production resulting from these enhanced emissions are largely responsible for the simulated future 03 increases (Racherla and Adams 2008).
T h i s is in c o n t r a s t to the H a r v a r d - 1 results in Fig. 8, which show only weak changes in 03 concen-trations over the Southeast and G u l f Coast, despite the large increase in future biogenic emissions. Even the especially large increases in t e m p e r a t u r e that accompany these biogenic emissions changes over the G u l f Coast region do not seem to increase appreciably future 03 concentrations.
One factor to which this striking difference between the two sets o f results might be traced is the m o d -eled isoprene nitrate chemistry, as mentioned earlier. Although increased emissions o f biogenic V O C s are often associated with increases in 03 concentrations, these increased emissions can also lead to decreases in 03 concentrations via different pathways. For example, high concentrations of isoprene can reduce O amounts through direct ozonolysis, and they can also suppress
03 production in NOx-limited regimes (e.g., rural areas)
zyxwvutsrqponmlkjihgfedcbaZYXWVUTSRQPONMLKJIHGFEDCBA
FIG
zyxwvutsrqponmlkjihgfedcbaZYXWVUTSRQPONMLKJIHGFEDCBA
. 9. A sAMERICAN
zyxwvutsrqponmlkjihgfedcbaYXWVUTSRPONMLKJIHGFEDCBA
in Fi g . 8 b u t f o r t h e C M U g l o b al m o d el i n g e x p e r i m e n t ( see Tab l e 3) .b y s e q u e s t e r i n g N Ox in i s o p r e n e n i t r a t e s (e.g., see Fiore et al. 2005). In the Harvard-1 modeling system, increasing isoprene emissions seem to result in little change, or even decreases in 03 a m o u n t s , perhaps be-cause the model c h e m i s t r y represents these isoprene nitrates as a " t e r m i n a l " sink for N O . In the absence o f
X
additional N Ox, the small change in 03 concentrations in the G u l f Coast, despite the strongly favorable climate changes there, could be due to this suppressing effect o f isoprene. By contrast, in the C M U modeling system, the isoprene nitrates are assumed to react rapidly with O H and 03 and "recycle" N Ox back to the atmosphere with 100% efficiency. T h i s N Ox then b e c o m e s avail-able to help create 03 again, tending to favor greater 03 concentrations in regions o f greater biogenic V O C emissions. It is this effect that may be d o m i n a t i n g the influence o f climate change on 03 in the C M U results. T h i s comparison strongly illustrates the importance o f understanding the underlying details o f the chemical m e c h a n i s m o f 03 formation. C o n s t r a i n i n g the precise pathways whereby isoprene, N Ox, and 03 are l i n k e d is the subject o f ongoing research (e.g., see Horowitz et al. 2 0 0 7 ) , and as such remains an i m p o r t a n t source o f uncertainty in the modeling systems.
Lastly, in t h e H a r v a r d - 1 s i m u l a t i o n s , e n h a n c e d ventilation a n d m i x i n g also plays a role in partially o f f s e t t i n g e x p e c t e d c l i m a t e i n d u c e d O c o n c e n t r a -t i o n i n c r e a s e s in s o m e n e a r - c o a s -t a l r e g i o n s . T h i s results f r o m the c o m b i n a t i o n o f the h u m i d i t y - d r i v e n decreases in 03o v e r the o c e a n s reported in W u et al. (2008b) and Racherla and A d a m s (2006), and perhaps also stronger o n s h o r e flow due to an increase in the s u m m e r t i m e l a n d - o c e a n heating contrast. Lin et al. ( 2 0 0 8 ) report s i m i l a r effects in their simulations o f future O^over the U n i t e d States a n d C h i n a .
S U M M A R Y A N D D I S C U S S I O N . T h i s p a p e r describes an effort to c o m b i n e global a n d regional climate and air quality m o d e l s a n d apply t h e m in the study o f global climate change effects on U.S. regional air quality. T h i s effort represents a systematic attempt to use m u l t i p l e m o d e l i n g s y s t e m s a c r o s s m u l t i p l e g r o u p s to i n v e s t i g a t e t h e r e g i o n a l d i m e n s i o n s o f c l i m a t e - i n d u c e d air quality changes. T h i s synthesis across a diversity o f results helps d e t e r m i n e what new s c i e n t i f i c f i n d i n g s are e m e r g i n g . It also allows t h e assessment o f the c u r r e n t ability to simulate c h a n g e s in U.S. regional air quality as a result o f global climate change. T h e m a j o r conclusions are as follows.
F i r s t , a c r o s s all o f t h e m o d e l i n g e x p e r i m e n t s carried out by the different groups, simulated global c l i m a t e c h a n g e c a u s e s i n c r e a s e s in s u m m e r t i m e 03 c o n c e n t r a t i o n s o v e r s u b s t a n t i a l r e g i o n s o f t h e
country. For s u m m e r t i m e - m e a n M D A 8 03, the in-creases are in the 2 - 8 ppb range. T h e inin-creases in 03 c o n c e n t r a t i o n s in these simulations are larger during p e a k p o l l u t i o n events, as e x h i b i t e d b y t h e g r e a t e r increases in 9 5 t h percentile M D A 8 03t h a n those for s u m m e r t i m e - m e a n M D A 8 O .
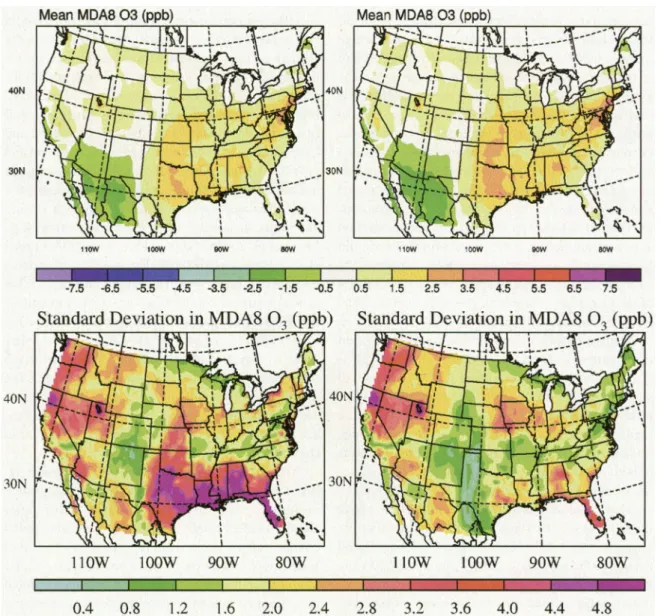
A l t h o u g h the results f r o m the different research groups agreed on these points, their m o d e l i n g sys-t e m s did nosys-t necessarily simulasys-te sys-the s a m e regional patterns o f climate-induced 03 changes, with the indi-vidual simulations showing regions o f little c h a n g e — or even d e c r e a s e s — i n addition to the 03 increases. Drawing on all seven m e a n M D A 8 03 difference maps (the five regional and two global m o d e l i n g sets) f r o m Figs. 1, 8, a n d 9, we c a n see that c e r t a i n regions show greater a g r e e m e n t t h a n others. For example, there is very generally m o r e agreement on the spatial patterns o f c l i m a t e - i n d u c e d increases for the eastern h a l f o f the c o u n t r y t h a n for the W e s t , t h o u g h parts o f the Southeast show s o m e o f the strongest d i s a g r e e m e n t s across t h e m o d e l i n g groups. T h i s is e m p h a s i z e d in a n o t h e r way in Fig. 10, w h i c h shows the m e a n a n d s t a n d a r d d e v i a t i o n c o n s t r u c t e d f r o m all seven o f these M D A 8 O difference maps.
T h e s e differences in t h e regional p a t t e r n s o f 03 changes result f r o m variations across the simulations in the patterns o f m e a n changes in key meteorological drivers, such as t e m p e r a t u r e and surface insolation. T h e m o d e l i n g e x p e r i m e n t s p r o v i d e e x a m p l e s o f regions where simulated future c h a n g e s in m e t e o r o -logical variables either have reinforcing or c o m p e t i n g effects on 03 c o n c e n t r a t i o n s . F o r e x a m p l e , r e g i o n s w h e r e t h e c h a n g e s in s i m u l a t e d t e m p e r a t u r e a n d insolation are in the s a m e d i r e c t i o n tend to experi-ence 03 c o n c e n t r a t i o n c h a n g e s in a s i m i l a r d i r e c t i o n , whereas t e m p e r a t u r e a n d insolation v a r y i n g in op-posite d i r e c t i o n s tend to c o r r e s p o n d with m i x e d 03 changes. In short, each m o d e l e x p e r i m e n t produces a u n i q u e pattern o f key m e t e o r o l o g i c a l drivers, and their c o m b i n e d effects create the u n i q u e pattern o f 03 c h a n g e s seen in the individual m o d e l i n g studies. It is worthwhile p o i n t i n g out that the findings shown here provide yet a n o t h e r illustration o f b o t h the i m -p o r t a n c e o f the re-presentation o f clouds in c l i m a t e m o d e l s (here via their effect on surface insolation) a n d the c o n t i n u e d challenge o f doing so consistently across o u r c u r r e n t generation o f models. I n t e r a n n u a l variability plays an important role here as well, as each o f the studies only simulated at m o s t a few s u m m e r s w o r t h o f c l i m a t e c h a n g e , thus i n c r e a s i n g the p r o b -ability that any two studies will differ f r o m each other in their regional patterns o f O change simply because o f year-to-year differences.
In this context, large-scale circulation patterns play an i m p o r t a n t role in m o d i f y i n g these local meteoro-logical drivers. For example, h o w a given m o d e l i n g system simulates changes in key circulation features, like the midlatitude storm track or the subtropical high pressure systems, has a strong effect on the simulated future 03 concentrations. Related factors to which the patterns in the simulated meteorological variables ap-pear to be highly sensitive but that are not discussed in detail in this paper include the choice o f convection scheme (e.g., see Tao et al. 2 0 0 8 ) and whether or not the global model outputs are dynamically downscaled w i t h an R C M ; for e x a m p l e , t h e d o w n s c a l e d M M 5 results for the 2 0 5 0 s used in the N E R L e x p e r i m e n t
show increased storminess in the upper Midwest, while the GISS I I ' output that drove this M M 5 simulation i n s t e a d shows i n c r e a s e d s t a g n a t i o n ( M i c k l e y et al. 2 0 0 4 ; Leung and Gustafson 2005; Gustafson and Leung 2 0 0 7 ) . T h e G N M group found that the effect o f overall u n c e r t a i n t i e s in c l i m a t e forecasts on the simulated future fourth-highest daily M D A 8 03 to be as high as 10 ppb in urban areas o f the Northeast, Midwest, and G u l f Coast (Liao et al. 2009).
In addition, across nearly all the modeling studies, climate change is associated with simulated increases in biogenic V O C emissions over most o f the United States, with the largest increases typically in the Southeast
and G u l f Coast regions. T h e response o f 03 concen-
zyxwvutsrqponmlkjihgfedcbaZYXWVUTSRQPONMLKJIHGFEDCBA
FIG. 10.
zyxwvutsrqponmlkjihgfedcbaZYXWVUTSRQPONMLKJIHGFEDCBA
T h e m e a n ( t o p p a n e ls) a n d s t a n d a r d d e v i a t i o n ( b o t t o m p a n e ls) in f u t u r e - m i n u s - p r e s e n t M D A 8 03 c o n c e n t r a t i o n d iffe re n ce s a cross ( le f t - h a n d pa ne ls) a ll se ve n e x p e r i m e n t s ( five re g io n a l a ndt w o g lo b a l) s h o w n in F igs. I , 6 , a n d 7 a nd, f o r c o m p a r i s o n p u rp o se s ( r i g h t - h a n d pa ne ls) , n o t in c lu d in g t h e W S U e x p e r i m e n t ( be ca use it s i m u l a t e d d iffe re n c e s f o r July only, w h i l e t h e o t h e r e x p e r i m e n t s s i m u l a t e d JJA d iffe re n c e s ) .