Publisher’s version / Version de l'éditeur:
Vous avez des questions? Nous pouvons vous aider. Pour communiquer directement avec un auteur, consultez la
première page de la revue dans laquelle son article a été publié afin de trouver ses coordonnées. Si vous n’arrivez pas à les repérer, communiquez avec nous à [email protected].
Questions? Contact the NRC Publications Archive team at
[email protected]. If you wish to email the authors directly, please see the first page of the publication for their contact information.
https://publications-cnrc.canada.ca/fra/droits
L’accès à ce site Web et l’utilisation de son contenu sont assujettis aux conditions présentées dans le site
LISEZ CES CONDITIONS ATTENTIVEMENT AVANT D’UTILISER CE SITE WEB.
Research Report (National Research Council of Canada. Institute for Research in Construction), 2008-09-12
READ THESE TERMS AND CONDITIONS CAREFULLY BEFORE USING THIS WEBSITE. https://nrc-publications.canada.ca/eng/copyright
NRC Publications Archive Record / Notice des Archives des publications du CNRC :
https://nrc-publications.canada.ca/eng/view/object/?id=33aeb027-a5cd-436d-b8a5-290c7630d1ab https://publications-cnrc.canada.ca/fra/voir/objet/?id=33aeb027-a5cd-436d-b8a5-290c7630d1ab
NRC Publications Archive
Archives des publications du CNRC
For the publisher’s version, please access the DOI link below./ Pour consulter la version de l’éditeur, utilisez le lien DOI ci-dessous.
https://doi.org/10.4224/20374374
Access and use of this website and the material on it are subject to the Terms and Conditions set forth at
International Road Tunnel Fire Detection Research Project - Phase II Task 2: Full-Scale Fire Tests in a Laboratory Tunnel
Liu, Z. G.; Crampton, G. P.; Kashef, A.; Lougheed, G. D.; Gibbs, E.; Muradori, S.
http://irc.nrc-cnrc.gc.ca
I nt e r nat iona l Roa d Tunne l Fire
De t e c t ion Re se a rch Proje c t -
Pha se I I Ta sk 2 : Full-Sc a le Fire
Te st s in a La borat or y Tunne l
R R - 2 7 0
L i u , Z . G . ; C r a m p t o n , G . P . ; K a s h e f , A . ; L o u g h e e d , G . D . ; G i b b s , E . ; M u r a d o r i , S .S e p t . 1 2 , 2 0 0 8
The material in this document is covered by the provisions of the Copyright Act, by Canadian laws, policies, regulations and international agreements. Such provisions serve to identify the information source and, in specific instances, to prohibit reproduction of materials without
written permission. For more information visit http://laws.justice.gc.ca/en/showtdm/cs/C-42
Les renseignements dans ce document sont protégés par la Loi sur le droit d'auteur, par les lois, les politiques et les règlements du Canada et des accords internationaux. Ces dispositions permettent d'identifier la source de l'information et, dans certains cas, d'interdire la copie de
International Road Tunnel Fire Detection Research Project – Phase II
Task 2: Full-Scale Fire Tests in a Laboratory Tunnel
Prepared by
Z. G. Liu, G. Crampton, A. Kashef, G. Lougheed, E. Gibbs and S. Muradori
Fire Research Program
Institute for Research in Construction
2 International Road Tunnel Fire Detection Research Project – Phase II
Project Technical Panel
Frank Gallo, Port Authority of New York and New Jersey Harry Capers, New Jersey DOT
Jesus Rohena, Federal Highway Administration Paul Patty, Underwriters Laboratories Inc. Volker Wetzig, Versuchs Stollen Hagerbach AG Art Bendelius, A & G Consultants
Bill Connell, Parsons Brinckerhoff
Margaret Simonson, Swedish National Testing and Research Institute Gary English, Seattle Fire Department
Peter Johnson, ARUP Fire Risk & Security Jim Lake, NFPA staff liaison
Principal Sponsors
Ministry of Transportation of British Columbia Ministry of Transportation of Ontario
Ministry of Transportation of Quebec
The City of Edmonton, Transportation Department, Transit Projects Branch axonX LLC
Siemens Building Technologies Tyco Fire Products
VisionUSA
Sureland Industrial Fire Safety
United Technologies Research Corporation
Contributing Sponsors
National Research Council of Canada
Port Authority of New York and New Jersey A & G Consultants
PB Foundation Micropack, Inc.
J-Power Systems and Sumitomo Electric U.S.A., Inc. Honeywell Inc.
3
ABSTRACT
This report presents the research works completed in Task 2 of the International Road Tunnel Fire Detection Research Project – Phase II. The capabilities and limitations of nine fire detectors/detection systems were investigated in a laboratory research tunnel with various challenging fire scenarios.
The simulated tunnel fire scenarios used in the test program were pool fires located in the open space, underneath a vehicle and behind a large vehicle, stationary vehicle fires in the engine and passenger compartments as well as moving fires with two different speeds and driving directions facing the detectors. The fuel types included gasoline, propane, wood crib and plastic foam. Their fire sizes were varied from approximately 125 kW to 3,400 kW. Some fires grew very quickly to reach their maximum heat release rates in less than 30 s, while other fires in the test series grew very slowly, and it took more than 8 minutes to reach their maximum heat release rate. The fire characteristics generated from these fire scenarios, such as their fire growth rates, heat flux, temperature development and smoke spread in the tunnel, as well as their impacts on detecting performance were investigated.
The fire detectors/detection systems were selected from five types of fire detection technologies. They were: two linear heat detection systems, one optical flame detector, three CCTV fire detectors, one smoke detection system and two spot heat detectors. All the detectors/detection systems were evaluated under the same fire conditions. Their detecting performances, including their response times, fire locating and monitoring capabilities, to various tunnel fire scenarios were studied. Test results showed that their detecting capability to a fire incident in the tunnel was determined by fuel type, fire size, location and growth rate as well as their detecting mechanisms.
4
ACKNOWLEDGEMENTS
The project is conducted under the auspices of the Fire Protection Research Foundation (FPRF). The authors would like to acknowledge the support of the Technical Panel, Sponsors as well as many NRCC staff to this project. A special acknowledgement is noted to Kathleen Almand of the FPRF for her contribution in organizing the project.
5
TABLE OF CONTENTS
1. Introduction ...6
2. Test Tunnel ...7
3. Selected Fire Detection Systems and Their Setups in Tests ...9
4. Instrumentations...18
5. Test Procedure………..21
6. Fire Tests and Results ...21
6.1 Pool Fires ...22
6.1.1 Open Pool Fire………22
6.1.2 Pool Fires underneath Vehicle ...23
6.1.3 Pool Fires behind Large Vehicle...38
6.2 Stationary Vehicle Fires...46
6.2.1 Engine Compartment Fires……….46
6.2.2 Passenger Compartment Fires……….51
6.3 Moving Fires...58
7. Summary.………..62
6
1. INTRODUCTION
A number of technical issues related to the use of the current fire detection technologies for road tunnel protection were identified in Phase I of the International Road Tunnel Fire Detection Research Project [1]. These issues were that relatively few test programs on the study of detecting performance of tunnel fire detection technologies were conducted. These programs mainly focused on the performance of linear heat detection systems and optical flame detectors. Many existing and newly developed fire detection technologies, such as spot heat detectors, smoke detection systems and visual CCTV flame and smoke detectors, were not studied systematically. The performances of detectors in these programs were evaluated mostly with pool fires that had a constant heat release rate of up to 3 MW. Impact of other fire scenarios, such as stationary and moving vehicle fires, on the detecting performance was not investigated.
The present work aims to study these concerns on the use of current fire detection technologies for road tunnel protection. A series of fire tests were conducted in a laboratory tunnel facility. The performance of nine fire detectors/detection systems selected from five types of fire detection technologies were evaluated with a variety of simulated tunnel fire incidents. These fire detectors/detection systems were: two linear heat detection systems, one optical flame detector, three CCTV fire detectors, one smoke detection system and two spot heat detectors. They provided a good representative of current fire detection technologies for use in tunnel fire detection.
All the detectors/detection systems were evaluated under the same fire conditions. The simulated tunnel fire scenarios included not only pool fires that had a fast growing rate and constant heat release rate, but also stationary vehicle fires that had a slow growth rate as well as moving vehicle fires. The fire sizes in the test series were varied from 125 kW to 3,400 kW and fuel types were gasoline, propane, wood crib and plastic foam. These fire scenarios were considered representative of the majority of tunnel fire incidents, and selected in Task 1 of the project [2].
This report presents works carried out in Task 2 of the International Road Tunnel Fire Detection Research Project (Phase II). The information on the testing tunnel, fire scenarios, fire detection systems and testing instrumentation is described. The fire characteristics generated from various simulated tunnel fire incidents, such as their fire growth rates, heat flux emitted, temperature development and smoke spread in the tunnel, are presented. The detecting performances of evaluated fire detectors/detection systems to various simulated tunnel fire incidents, including their response times, fire locating and monitoring capabilities, are reported.
7
Figure 2.1. Schematic of the test tunnel
2. TEST TUNNEL
The full-scale fire tests were carried out in a new laboratory research tunnel that was located at the NRCC facility site. The tunnel facility is 37.5 m long, 10 m wide and 5.5 m high (113 ft long, 30 ft wide, and 16.5 ft high). It can be used for conducting tests that realistically simulate fires in roadway and mass-transit tunnels. The tunnel has two end doors, one large side door to nearby burn hall at west end of the tunnel, and two side louvers at east end of the tunnel. Its constructions are shown in Figures 2.1 and 2.2.
Two end doors of the tunnel were closed during tests. Two side louvers at the east end of the tunnel, however, were partially opened, allowing fires in the tunnel to fully combust with sufficient air supply. The opening of two side louvers was 1.5 m wide by 4.9 m high at the north side, and 2.75 m wide by 4.9 m high at the south side.
Smoke produced in the tunnel facility can be collected and exhausted through a fan system. For the present work, however, only natural ventilation with ambient conditions was maintained and the mechanical ventilation systems in the tunnel did not operate during the tests. The effects of ventilation on the performance of fire detection systems will be studied separately in another task of the project.
8
9 3. SELECTED FIRE DETECTION SYSTEMS AND THEIR SETUPS IN TESTS
Nine fire detection systems were evaluated in the test program. These systems were selected by the Technical Panel from Task 1 of the project [2] and covered five types of currently available technologies. They were: two linear heat detection systems, one optical flame detector, three CCTV fire detectors, one smoke detection system and two spot heat detectors. General information on these systems is listed in Table 3.1 and their detecting mechanisms were described in the report of Task 1 [2].
Table 3.1. Fire Detection Systems in Test Program Technology System
no.
System information Alarming threshold Detecting
location
D-1L1 Fiber optic linear heat detection
Level 1: 50oC, 10oC/min; Level 2: 100oC, 15oC/min;
Two parallel cables in the tunnel, 2.5 m from the wall
Linear heat
D-2L2 Analogue (co-axial cable) linear heat detection system
Alarming Temp: 70oC, Alarming rate: 7oC/min;
Two parallel cables in the tunnel, 2.5 m from the wall
Flame D-3F1 IR3 flame detector Sensitivity: 0.3 m x 0.3 m gasoline fire at 65 m on-axis and 45.7 m off-axis.
30 m from the fire source and 3.9 m from ground
D-4C1 Visual flame and smoke detector
Flame: low (25); Offsite: 50% Smoke: normal
30 m from the fire source and 4.4 m from ground
D-5C2 Visual flame detector See Table 3.3 30 m from the fire source and 4.2 m from ground
CCTV
D-6C3 Visual flame detector Sensitivity: 10 kW fire at 30 m.
30 m from the fire source and 3.8 m from ground
D-7H1 Heat detector with a fixed temperature
79.5oC fast response bulbs 3 m spacing at the center of tunnel ceiling
Spot heat
D-8H2 Rate-anticipation heat detector
Alarming Temp: 57.2oC 15.2 m spacing at the center of tunnel ceiling
Smoke D-9S1 Air sampling system Fire threshold: 0.062%/ft Air sampling line at the center of tunnel ceiling
It was required that the configuration and installation of fire detection systems in the test tunnel were designed for providing a protection for a road tunnel with a dimension of 10m wide x 5.5 m high x 2,000 m long (30 ft x 16.5 ft x 6,100 ft long) [2]. Their installation configurations were not allowed to change during tests. The sensitivity levels or alarming thresholds of fire detection systems were also not allowed to change during tests. They shall be the same ones as used in operating tunnels and be consistent with those used in the operating environment tests in the Lincoln tunnel undertaken in Tasks 5 and 6 of the project.
10
Figure 3.1. Schematic of detector setup in the test tunnel
According to these requirements, all the selected fire detectors/detection systems were installed in the test tunnel by the system suppliers. The configurations of nine detectors/detection systems in the test tunnel are shown in Figure 3.1. They were evaluated under the same fire test conditions. The outputs of these detection systems were sent to a data acquisition system.
System D-1L1 was a fiber optic linear heat detection system based on Raman scattering. The entire optical fiber was used as the sensing medium. Fire warning signals could be given based on rate of temperature rise and/or exceeding a fixed temperature. During the test program, two levels of alarm threshold were set up. The alarming temperature and the rate of temperature rise were 50oC and 10oC/min for Level 1 of the threshold and 100oC and 15oC/min for Level 2 of the threshold. The fire location in the tunnel could be identified according to the temperature distribution along the fiber cable. The space resolution of the system for a fire location was 1.2 m.
11 D TS P C 10m 37.5m 5.5m C eiling A pprox. 80m m Fiber Sensor 10m 5.5m 2.5m A larm O utput to N R C C S ystem Fiber-optic S ensor A pprox.80m A pprox.20m 2000m 2.5m (2016 m point) (2068 -2121m point) (2171-2198 m point)
Figure 3.2. Configuration of System D-1L1 in the test tunnel
Two parallel sensing cables of System D-1L1 were installed on the ceiling of the tunnel (see Figure 3.1). Each cable was located at approximately 80 mm from the ceiling, 2.5 m from the wall and 5 m from another sensing cable. A total 2,198 m length of the sensing cable was used in the test program. The cable section installed in the tunnel was from 2,000 m to 2,198 m, which is the maximum sensing length of the system recommended by the supplier. The fiber optic cable in the tunnel facility was protected with a 2 mm diameter’s stainless tube. The detailed configuration of the sensing cable in the test program is shown in Figure 3.2.
System D-2L2 was an analogue (coaxial cable) linear heat detection system. The sensor cable consisted of a conductor, an insulating layer, and a metal-weaving screen layer. Fire warning signals could be given based on rate of temperature rise and/or exceeding a fixed temperature. During tests, the alarming temperature and the rate of temperature rise of the system were 70oC and 7oC/min.
12
Figure 3.3. Sensing cables of Systems D-1L1 D-2L2 on the ceiling of the tunnel
The configuration of the sensing cable of System D-2L2 in the test tunnel was similar to that with System D-1L1. 2 parallel sensing cables were installed on the ceiling of the tunnel (see Figure 3.1). Each cable was located at approximately 80 mm from the ceiling, 2.5 m from the wall and 5 m from another sensing cable. A total approximately 90 m long sensing cable, as one detecting section of the system, was installed in the test tunnel. Figure 3.3 is the picture showing sensing cables of both System D-1L1 and System D-2L2 below the ceiling of the tunnel.
13
Figure 3.4. Configuration of flame and visual detectors in the test tunnel
System D-3F1 was a multi-spectrum infrared (IR) flame detector. It consisted of three IR sensors: one covered the typical CO2 flame emission spectral band that was
responsible for the detection of flame radiation, and the other two sensors cover different, adjacent, and specially selected spectral bands, where black body emitters and background radiation were produced and they were used to minimize false alarms. The detector was installed at the north sidewall of the test tunnel, and at 3.9 m from the ground (see Figures 3.1 and 3.4). Its sensitivity was set to be “very high” for a 0.3 m x 0.3 m gasoline pool fire at 65 m on-axis and 45.7 m off-axis.
System D-6C3 System D-5C2
System D-3F1 System D-4C1
14 Setting FSM8 Flame Low (25) Offsite 50% Smoke Normal Outdoor Checked
Table 3.2. Sensitivity settings in System D-4C1
Figure 3.5. Coving view of the test tunnel provided by System D-4C1
System D-4C1 was a Closed Circuit Television (CCTV) flame and smoke detection system. Fire alarms were issued, once the characteristics of flame and smoke generated in a fire incident were identified. For the current test program, the detector was installed at the north sidewall of the test tunnel, and at 4.4 m from the ground (see Figures 3.1 and 3.4). The image of the system ran parallel with the wall of the tunnel. The entire tunnel was covered starting at 18.0 m from the camera, and the preceding camera would cover the blind spot of the camera in front of it. The view of the tunnel covered by the camera is shown in Figure 3.5. The detector had two flame algorithms and one smoke alarm algorithm. The first flame algorithm was used to detect the fire in the field of view of the camera and the second one “Offsite” was used to detect the fires outside the field of view. Its sensitivity settings during test program are listed in Table 3.2.
15
Figure 3.6. Coving view of the test tunnel provided by System D-5C2
System D-5C2 was the second CCTV detection system. It detected a fire mainly based on the characteristics of the flame generated from a fire incident. During the test program, the detector was located at the north sidewall of the test tunnel, and at 4.2 m from the ground (see Figures 3.1 and 3.4). The detector was able to cover the entire tunnel. The view of the tunnel covered by the camera is shown in Figure 3.6. Its sensitivity settings during tests are listed in Table 3.3.
Table 3.3. Sensitivity settings in System D-5C2
Intensity Mean Crossing
Intensity Standard Deviation
Flicker Mask Counter Bit Mask
Flicker Mask Counter
Color
16
Figure 3.7. Overview of System D-7H1 and System D-9S1 in the test tunnel
System D-6C3 was the third CCTV detection system. It detected a fire also based on the characteristics of the flame generated in a fire incident. Unlike Systems 4C1 and D-5C2, image sensing and processing of System D-6C3 were combined into one detector, and fire information and videos were directly sent to the monitoring computer through a controller, once a fire incident was identified. During the test program, one detector was located at the north sidewall of the test tunnel, and at 3.8 m from the ground (see Figures 3.1 and 3.4). No image of the test tunnel and experimental setup was demonstrated on the screen of the monitoring computer, and the flame image was demonstrated only after the fire was detected. The sensitivity of the detector during the test program was set to be a level for detecting a 10 kW fire at approximately 30 m.
System D-7H1 was a pneumatic, spot type heat detection system based on frangible bulb technology. The device was fitted on a sensing line pressurized using nitrogen. A fire signal was given when the frangible bulb was broken during a fire incident, and the air trapped in the line was released. During the test program, two 15 m long zones of 12.7 mm steel pipe were installed along the center of the test tunnel (see Figure 3.1). Five 79.5oC fast response sprinkler heads were installed per zone at 3 m spacing and at 20 cm from the ceiling. The overview of the system on the ceiling of the tunnel is shown in Figure 3.7. During testing, the pipe was pressurized with approximately 20 psi of compressed air, by way of a near-by compressor. The compressor was run continuously to make up for any small leaks that may have been existent in the installation.
System D-7H1 System D-9S1
17
Figure 3.8. Overview of configuration of detectors on the south wall of the tunnel
System D-8H2 was a rate-anticipation spot heat detector. It responded and activated the fire alarm when the ambient temperature reached the preset temperature setting. Its protected area was 15.24 m x 15.24 m. For the current test program, two 57.2oC responded heat detectors were installed along the center of the tunnel ceiling (see Figure 3.1) at 15 m spacing and at 11 cm from the ceiling.
System D-9S1 was an air sampling-type smoke detection system. Air was continuously drawn into a pipe network through holes in the piping to a centrally-located smoke detector using an air pump or aspirator. Alarms were issued, if the amount of smoke in the sampled air exceeded the thresholds. For the current test program, a 34 m long sampling pipe with 6 sampling holes in 5.6 m spacing was installed along the center of the tunnel ceiling (see Figure 3.1). The pipe installed in the test tunnel represents 28% of the total coverage area of one smoke detector in a real tunnel as well as in the operating environment tests in the Lincoln tunnel undertaken in Tasks 5 and 6 of the project. In order to match the air flow sampled in a full coverage area of a smoked detector, 28% of the airflow through the detector was sampled through the pipe installed the test tunnel during tests. The overviews of the pipe in the test tunnel are shown in Figures 3.7 and 3.8.
A number of additional fire detectors, including spot heat detectors, flame and CCTV detectors, were also installed in the test tunnel for collecting extra test data (see Figures 3.4 and 3.8). These additional detectors were not connected to the project data collection system, but to the data collection systems of the system suppliers. Their performances are not presented in the report.
18
4. INSTRUMENTATIONS
Various instruments were used to monitor fire tests. They included thermocouples, heat flux meters, smoke meters, velocity meters and video cameras, as shown in Figure 4.1. The locations of each instrument in the tunnel were shown in Figure 4.2.
Fifty-five thermocouples (Type K, 18 gauge, Figure 4.1f) were installed at the ceiling of the tunnel facility for temperature measurements. As shown in Figure 4.2, the transverse and longitudinal distances between thermocouples on the ceiling of the tunnel are 1.67 m and 3.125 m, respectively, and each thermocouple was at 15 cm from the ceiling. Two thermocouple trees were dropped from the ceiling of the tunnel. One was located above the fire to measure the gas/flame temperatures of the fire source and to monitor the fire development. The second one was located at the middle of the tunnel (18.7 m from the end of the tunnel and 5 m from the wall of the tunnel) to monitor fire development in the tunnel. There were five thermocouples on each tree: 0.5 m distance from the ground and to the ceiling, and 1.1 m interval distance between the thermocouples.
Three smoke meters were used for measuring smoke optical density in the tunnel (Figure 4.1d). They were located at the middle of the tunnel and approximately 12 m from the fire source. One sampling-obscuration smoke system was used to measure the smoke from the hot layer and its sampling port was located at 15 cm from the ceiling. Two straight-line obscuration smoke systems were used to measure the smoke density at low portion of the tunnel (1.53 m and 2.5 m from the ground). The measuring methods of these two types of smoke meters are described in a NRC research report [3].
Hand held Dwyer VT140 Thermo-anemometers with the remote vane sensors mounted on 4 m long aluminum poles were used to measure the air/gas velocity in the tunnel (Figure 4.1a). The measurements were taken at the middle of the tunnel from 3 heights: 15 cm from the ceiling, 2.75 m from the ground and 0.7 m from the ground.
Five heat flux meters and radiometers were used to measure the heat and radiant flux of the fire, and to monitor the fire development (Figure 4.1b). They were located, respectively, at 1 m, 2 m, 5 m, 10 m and 29 m from the fire source, and at 1.45 m from the ground, as shown in Figure 4.2. The radiometer that was located at 29 m from the fire source was placed near the end of the tunnel close to the flame detectors, which was used to measure flame radiant that could reach the detectors.
Two regular Sony Hi8 digital video cameras were used to provide a video record for the tests (Figure 4.1e). One video camera was located near the fire source to monitor the flame conditions around mock-ups. The second one was located at 29 m from the fire source to monitor the fire development in the tunnel.
The locations and distributions of these instrumentations remained unchanged in the test program. These test data together with outputs of the detection systems were collected at one second intervals by a data acquisition system (Figure 4.1c).
19
Figure 4.1a). Velocity meter Figure 4.1b). Heat flux
Figure 4.1c). Data Collection system
Figure 4.1d). Smoke meters
Figure 4.1e). Video Camera Figure 4.1f). Thermocouple
20 Figure 4.2. Schematic of instrumentation in the test tunnel
21
5. TEST PROCEDURE
The general test procedure in the test program was as follows:
• Prepare fire scenarios;
• Check instrumentation and each detection system prior to each test, to assure normal operation;
• Start the data acquisition system and video recorders for 60 s, and then manually ignite the fire;
• Terminate the test when:
- All the detectors activate;
- Or 4 minutes after the fire reaches its maximum heat release rate; - Or a maximum safe operating temperature at the ceiling is reached,
which is defined to be 200oC ceiling temperature at 3 m from the fire source. This is designed to ensure that the detection systems mounted in the tunnel are not damaged.
• Check each detection system to determine if they still function properly after the fire test.
6. FIRE TESTS AND RESULTS
Twenty-one full-scale fire tests involving three types of tunnel fire scenarios were conducted in the test tunnel. These fire scenarios included gasoline pool fires in open space, underneath the vehicle and behind the vehicle, stationary vehicle fires in engine and passenger compartments and moving vehicle fires. The fire sizes varied from approximately 125 kW to 3,400 kW and fuel types included gasoline, propane, wood crib and plastic foam. These fire scenarios were considered representative of the majority of tunnel fire incidents, and selected in Task 1 of the project [2]. The fabrications of these fire setups were also prepared and reported in Task 1 of the project [2].
For the tests involving liquid pool fires and stationary passenger vehicle fires, the fire source was placed at the same location in the test tunnel: 6.5 m from east end of the tunnel and 2.5 m from north wall of the tunnel or at the side lane of the tunnel. For this position, the fire source was located below sensing cables of Systems D-1L1 and D-2L2; at 30 m from the optical flame and CCTV detectors (Systems D-3F1 to D-6C3); at approximately 3 m from a nearest sprinkler head of System D-7H1; at approximately 7.5 m from a nearest spot heat detector of System D-8H2; and at approximately 4 m from a nearest sampling hole of System D-9S1.
The fire characteristics generated from various fire scenarios, such as their fire growth rate, temperature distribution and smoke spread in the tunnel, were investigated. The detecting capability and limitation of the selected fire detectors/detection systems were evaluated under the same fire test conditions. The detecting time of each detector/detection system in the test series, which was defined as the interval between the fire ignition point and the alarm activating point of the system, was recorded. The locating and monitoring capabilities of some detection systems on a fire incident were also evaluated.
22
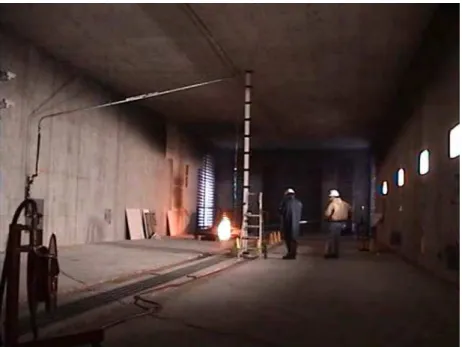
Figure 6.1. An open space gasoline pool fire in the test tunnel
6.1. Pool Fires
Pool fire scenarios used in test series included an open gasoline pool fire, gasoline pool fires underneath a vehicle, and gasoline pool fires behind a large vehicle. A propane burner with a controlled heat release rate was also used for simulating pool fires underneath a vehicle. The test conditions and results, involving pool fire scenarios, are listed in Table 6.1.
6.1.1. Open Pool Fire
A gasoline pan with the size of 0.3 m x 0.3 m was placed at the north side lane of the test tunnel. There was no obstacle around the fire source. Ambient temperature in the tunnel was 6oC and there was no air velocity in the tunnel. The test was designed for evaluating performances of detectors/detection systems to a small open pool fire, and for comparing their performances to those in shielded fire scenarios.
The fire was allowed to burn freely for approximately 12 minutes during test until the gasoline in the pan was burnt out. The fire developed very quickly to reach its maximum heat release rate (100~125 kW) (Figure 6.1). The rise rate of the ceiling temperature above the fire source was approximately 15oC/min. The maximum ceiling temperature above the fire source was approximately 22oC. The small amount of dark smokes was generated and accumulated below the ceiling. They didn’t obstruct the visual view of CCTV detectors to monitor the fire conditions during test.
23
Figure 6.2. Schematic of the setup for a fire underneath a vehicle
As shown in Table 6.1, all the optical flame and CCTV detectors responded quickly to this small and open gasoline pool fire. Their detecting times were less than 15 s. The linear fiber optic heat detection system D-1L1 also detected the fire at 22 s as the ceiling temperature quickly raised. The smoke detection system detected the fire at approximately 103 s. There was no response from the linear heat detection system D-2L2 and two spot heat detectors as the ceiling temperature during test was below to their presetting alarm thresholds.
6.1.2 Pool Fires underneath the Vehicle
The fire scenarios were designed for simulating tunnel fire incidents in which two vehicles crashed together, and the fuel leaked from the backward vehicle and generated a gasoline pool fire underneath the vehicle. As shown in Figure 6.2, a pool pan was placed underneath a simulated vehicle. It had a similar bottom area (1.5 m (5 ft) wide by 2.4m (8 ft) long) as a standard passenger vehicle. The gap between the bottom of the simulated vehicle and the ground was 0.3 m. A plate with a size of 1.5 m (5 ft) wide by 1.2 m (4 ft) high, simulating a crashed car located between the fire source and the wall-mounted detectors, was placed 1.5 m in front of the fire source and 0.3 m (1 ft) above the ground.
During tests, the fire source was located at the same place as in the test involving an open space fire in test T-1. Six fire tests with various fire sizes and two fuel types were conducted to evaluate performances of detectors/detection systems in response to various sizes of fires underneath the vehicle. The test conditions and results were listed in Table 6.1.
24 FIRE SCENARIO TEST NO FIRE SOURCE FUEL TYPE HEAT RELEASE RATE (KW) TROOM (OC) D-1L1 (S) D-2L2 (S) D-3F1 (S) D-4C1 (S) D-5C2* (S) D-6C3 (S) D-7H1 (S) D-8H2 (S) D-9S1 (S)
Open fire T-1 0.3 x 0.3 Gasoline 100 ~ 125 6 24 N/A 4 14 10 9 N/A N/A 103
T-2 0.3 x 0.3 Gasoline 100 ~ 125 6 N/A N/A N/A 125 N/A N/A N/A N/A 133
T-3 0.6 x 0.6 Gasoline 550 ~ 650 6 37 75 26 29 44 N/A N/A N/A 50
T-7 1.0 x 1.0 Gasoline 1500 ~ 1700 1 26 51 6 10 17 28 231 125 47
T-15 1.0 x 2.0 Gasoline 3000 ~ 3400 13 17 26 4 156 13 38 183 101 86
T-16 Burner Propane 1500 ~ 1700 13 22 35 12 15 N/A 195 152 72 N/A
Fire under the vehicle
T-18 Burner Propane 3000 ~ 3400 9 25 27 3 8 14 N/A 31 36 N/A
T-8 0.3 x 0.3 Gasoline 100 ~ 125 5 43 N/A 22 19 24 N/A N/A N/A 125
T-9 0.6 x 0.6 Gasoline 550 ~ 650 5 30 58 12 127 16 N/A N/A N/A 52
T-10 1.0 x 1.0 Gasoline 1500 ~ 1700 10 10 21 8 32 N/A N/A 62 37 38
Fire behind the vehicle
T-11 1.0 x 2.0 Gasoline 3300 ~ 3400 12 20 14 8 26 16 N/A 20 19 33
Note:
• No testing data from Detecting System D-5C2 were collected by the project data acquisition system, because of technical malfunction of System D-5C2. The test data of System D-5C2 that are listed in Table 7.1 were provided by the system supplier after the tests, which are not verified by the project.
• The systems listed in the table are:
1) D-1L1: Linear fiber optic heat detection system 2) D-2L2: Linear analogue heat detection system 3) D-3F1: Optical flame detector
4) D-4C1: CCTV flame/smoke detector 5) D-5C2: CCTV flame detector
6) D-6C3: CCTV flame detector 7) D-7H1: Spot heat detector 8) D-8H2: Spot heat detector 9) D-9S1: Smoke detection syste
25
Figure 6.3. A 0.3 m x 0.3 m gasoline pool fire underneath the vehicle in test T-2
For the tests involving gasoline fuel, four pans with sizes of 0.09 m2, 0.36 m2, 1.0 m2 and 2.0 m2 were placed underneath the vehicle, respectively. The fire in test T-2 involving 0.09 m2 gasoline pan was allowed to burn freely for approximately 8 minutes. The fire size was small, and the flame was confined underneath the vehicle but the smoke escaped from the vehicle, as shown in Figure 6.3. The maximum ceiling temperature above the fire source was approximately 13oC. The rise rate of the ceiling temperature above the fire source was approximately 5oC/min. Both maximum ceiling temperature and its rise rate were lower than those generated from an open gasoline pool fire in test T-1 with the same size of the pan.
Only visual flame and smoke CCTV detector D-4C1 and smoke detection system D-9S1 detected the fire at 125 s and 133 s, respectively, as they responded to the smoke released from the fire. Their detecting times were longer than those in the open space fire. All other fire detectors/detection systems had no response to the fire in test T-2.
With an increase in the pool size, the fire size increased and more flames and smokes were generated and stretched outside the vehicle, as shown in Figure 6.4 with a large gasoline pool fire (1.0 m2) in test T-7. The heat flux measured at different locations of the tunnel in test T-7 are shown in Figure 6.5. It indicates that once ignited, the gasoline pool fire developed very quickly. The heat flux continuously increased with time until the fire was extinguished at 5:50 minutes after ignition. The maximum heat flux measured at 1 m from the fire source was approximately 19 kw/m2 and it decreased with an increase in distance from the fire.
26 Time (s) 0 50 100 150 200 250 300 350 400 450 He at F lux ( k w /m 2 ) 0 5 10 15 20 1 m 2 m 5 m 10 m 29 m
measuring point from fire
Figure 6.4. Tunnel conditions with a gasoline pool fire (1.0 m x 1.0 m) underneath the vehicle in test T-7
Figure 6.5. Variations of heat flux with distance from the fire source in Test T-7 with a 1.0 m by 1.0 m gasoline pool fire underneath the vehicle
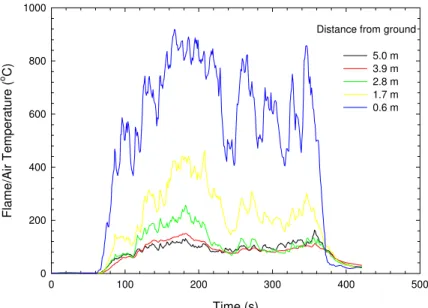
27 Time (s) 0 100 200 300 400 500 Flam e/Air T e mp eratu re ( o C) 0 200 400 600 800 1000 5.0 m 3.9 m 2.8 m 1.7 m 0.6 m Distance from ground
Time (s) 0 100 200 300 400 500 Air T em per ature ( o C) 0 20 40 60 80 100 120 140 5.0 m 3.9 m 2.8 m 1.7 m 0.6 m Distance from ground
Figure 6.6. Flame and air temperatures above the fire source in Test T-7 with a 1.0 m by 1.0 m gasoline pool fire underneath the vehicle
Figure 6.6 shows variation of temperatures measured above the fire source with time in test T-7. The maximum temperature measured at 0.6 m above the ground was approximately 900oC and it declined with an increase in distance from the fire source. The temperatures measured above 2.8 m from the ground did not show substantial decrease with an increase in distance from the fire source. The temperature measured at the middle point of the tunnel showed different trend from those measured above the fire source (Figure 6.7). Its temperatures increased with time and with an increase in the elevation from the ground. The maximum temperature measured at 5 m from the ground was nearly 95oC.
Figure 6.7. Variation of air temperatures along elevation at the middle of the tunnel in Test T-7 with a 1.0 m by 1.0 m gasoline pool fire underneath the vehicle
28 Time (s) 0 50 100 150 200 250 300 350 400 450 Ceiling Tem p erat ure ( o C) 0 50 100 150 200 8.34 6.67 5.0 3.34 1.67
TC location from north wall of tunnel (m)
Time (s) 0 50 100 150 200 250 300 350 400 450 Ce ilin g Te mpe ra tu re ( o C) 0 20 40 60 80 100 120 140 3.12 6.25 9.37 12.5 15.62 18.75 21.87 25.00 28.12 31.25 34.37
TC location from east end of tunnel (m)
Figure 6.8. Ceiling temperatures along center of the tunnel in Test T-7 with a 1.0 m by 1.0 m gasoline pool fire underneath the vehicle
Figure 6.8 shows the variation of ceiling temperatures along the center of the tunnel in test T-7. They increased quickly with time and decreased with an increase in distance from the fire source. The maximum temperatures measured at center of the tunnel were approximately 125oC near the fire source. Figure 6.9 shows changes in the ceiling temperatures across the tunnel measured near the fire source (6.2 m from east end of the tunnel). They also have substantial decrease with an increase in distance from the fire source. The maximum ceiling temperature near the fire source was approximately 170oC.
Figure 6.9. Ceiling temperatures across the tunnel near the fire source in Test T-7 with a 1.0 m by 1.0 m gasoline pool fire underneath the vehicle
29 Length of Tunnel (m) 0 5 10 15 20 25 30 35 40 C eiling T emper atur e ( o C) 0 20 40 60 80 100 120 8.33 6.67 m 5.00 m 3.34 m 1.67 m Distance from north wall of tunnel
fire location
Temperature distributions in the tunnel at 2 minutes after ignition are shown in Figure 6.10. It suggests that the fire had substantial impact on the ceiling temperature in the area with radium of 5 m from the fire source. The changes in ceiling temperatures across the tunnel tended to become small as the distance to the fire source increased. Figure 6.10 also showed that the ceiling temperatures near to partially opening side louver at the east end of the tunnel and near to partially opening side door at the west end of the tunnel substantially dropped, in comparison to temperatures located at other areas, indicating air exchange between inside and outside of the tunnel.
Figure 6.10. Ceiling temperature distribution in the tunnel at 2 minutes after ignition in Test T-7 with a 1.0 m by 1.0 m gasoline pool fire underneath the vehicle
30 Time(s) 0 50 100 150 200 250 300 350 400 450 Sm ok e Dens it y (OD/m ) 0.0 0.2 0.4 0.6 0.8 1.0 1.2 1.4 0.15 2.5 3.97 location from ceiling (m)
Figure 6.11 further shows that variation of smoke density measured at the middle of the tunnel with time in test T-7. The smoke density at 15 cm below the ceiling increased slowly at initial stage of the fire, and then quickly increased from 170 s after ignition. The smoke densities measured at 2.5 m and 3.97 m below the ceiling were not very high, and increased slowly with time. There was no air velocity in the tunnel.
Figure 6.11. Variations of smoke density below the ceiling at center of the tunnel in Test T-7 with a 1.0 m by 1.0 m gasoline pool fire underneath the vehicle
31 Time(s) 0 50 100 150 200 250 300 350 400 450 Smoke Densi ty (OD /m) 0.0 0.2 0.4 0.6 0.8 1.0 1.2 1.4 0.09 0.36 1.0 2.0 Pool size (m2)
Figure 6.13. Smoke densities measured with four gasoline pool pans underneath the vehicle
Time (s) 0 50 100 150 200 250 300 350 400 450 Hea t Flux ( k w /m 2 ) 0 5 10 15 20 0.09 0.36 1.0 2.0 Pool pan (m2)
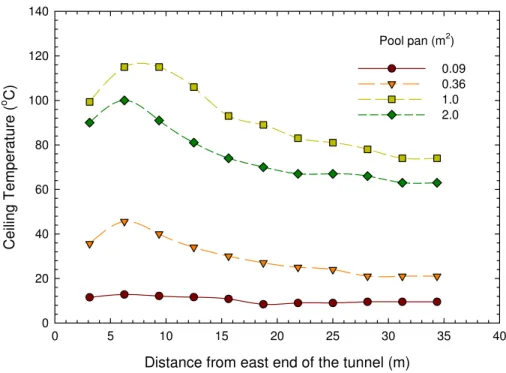
Figures 6.12 to 6.15 compare the changes in the heat flux measured at 1 m from the fire source, and smoke density measured at 15 cm below the ceiling, and the maximum ceiling temperatures along the center of the tunnel and across the tunnel near the fire source, when four gasoline pool pan sizes were used in the test series. The heat flux, smoke density and ceiling temperatures increased with an increase in pan size from 0.09 m2 to 1.0 m2. However, when further increase in pan size from 1.0 m2 to 2.0 m2, its both heat flux and smoke density were lower than those with gasoline pan size of 1.0 m2, and its maximum ceiling temperatures were also lower than those with the gasoline pan size of 1.0 m2, indicating that the combustion of 2.0 m2 gasoline pool fire underneath the vehicle was not fully developed, as available oxygen for the combustion of the fire was limited by the existence of the vehicle body above the pool pan.
32
Figure 6.14. Maximum ceiling temperatures along center of the tunnel with four gasoline pool pans underneath the vehicle
Distance from east end of the tunnel (m)
0 5 10 15 20 25 30 35 40 Cei ling T emper at ur e ( o C) 0 20 40 60 80 100 120 140 0.09 0.36 1.0 2.0 Pool pan (m2)
Figure 6.15. Maximum ceiling temperatures across the tunnel near fire with four gasoline pool pans underneath the vehicle
Distance from north wall of tunnel (m)
1 2 3 4 5 6 7 8 9 Ceiling tem perature ( o C) 0 20 40 60 80 100 120 140 160 180 0.09 0.36 1.0 2.0 Pool pan (m2)
33
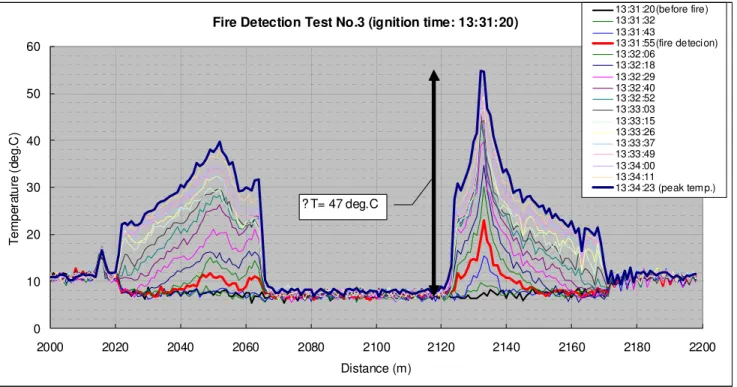
Fire Detection Test No.3 (ignition time: 13:31:20)
0 10 20 30 40 50 60 2000 2020 2040 2060 2080 2100 2120 2140 2160 2180 2200 Distance (m) T e m p e rat u re ( de g. C ) 13:31:20(before fire) 13:31:32 13:31:43 13:31:55(fire detecion) 13:32:06 13:32:18 13:32:29 13:32:40 13:32:52 13:33:03 13:33:15 13:33:26 13:33:37 13:33:49 13:34:00 13:34:11 13:34:23 (peak tem p.) ? T= 47 deg.C
Figure 6.16. Variations of temperatures along the cable with time in test T-3 with a 0.36 m2 gasoline pool pan underneath the vehicle
During tests, the linear heat detection system D-1L1 could not detect the fire underneath the vehicle with a 0.09 m2 gasoline pool fire, but it detected all other three large gasoline fires in less than 40 s, as shown in Table 6.1. Its detecting time decreased with an increase in fire size. The detecting time was 35 s for the 0.36 m2 gasoline pool fire, and then decreased to 17 s for the 2.0 m2 gasoline pool fire. System D-1L1 was also able to provide information on the variation of temperatures along its optical linear cable with time, as shown in Figure 6.16 with 0.36 m2 gasoline pool fire in test T-3. The system quick responded to the change in temperature, and the position in which the temperature has a sharp increase is the location close to the fire source.
34 The linear heat detection system D-2L2 also did not detect a 0.09 m2 gasoline pool fire. It detected all other three large gasoline fires ranging from 75 s to 26 s. Its detecting time decreased with an increase in fire size.
The optical flame detector D-3F1 did not detect a 0.09 m2 gasoline pool fire, but it detected other three large gasoline fires very quickly, ranging from 26 s to 4 s. Its detecting time also decreased with an increase in fire size.
The visual CCTV flame and smoke detector D-4C1 detected all the four gasoline pool fires underneath the vehicle ranging from 156 s to 10 s, based on characteristics of smoke and flame generated from fires. Its detecting time generally decreased with an increase in fire size, but its detecting time for the 2.0 m2 gasoline pool fire was even longer than that with 0.09 m2 gasoline pool fire. One explanation for this phenomenon was that the flame burst from the 2.0 m2 gasoline pool fire after ignition was much larger than presetting alarming thresholds of the system, and it took a long time for the system to reset its response.
The visual camera was able to provide video images on fire conditions in the tunnel during entire test with 0.09 m2 gasoline pool fire. Visual view of the camera to the tunnel, however, could be completely shut during tests with an increase in fire size, as the smoke density in the hot layer increased. The time for completely shutting visual view of the camera due to smoke was approximately 3:30 minutes for 0.36 m2 gasoline pool fire, 3:45 minutes for 1.0 m2 gasoline pool fire, and 4:40 minutes for 2.0 m2 gasoline pool fire. This was consistent with smoke density measured in tests. As shown in Figure 6.13, smoke density generated in the fire with 0.36 m2 gasoline pool is higher than those in two fires with large gasoline pools at initial 5 minutes of fire development.
The visual CCTV flame detector D-6C3 could not detect two small underneath fires, but responded to two large fires in less than 40 s.
Both spot heat detectors D-7H1 and D-8H2 only responded to two large underneath fires. Their detecting times declined with an increase in pool pan size. For a 2.0 m2 gasoline pool fire underneath the vehicle, the detecting times of two detectors were 183 s and 101 s.
The smoke detection system D-9S1 detected all the four underneath gasoline fires ranging from 133 s to 47 s, based on characteristics of smoke generated from the fires. Its detecting time decreased with an increase in the fire size, but its detecting time for the fire with 2.0 m2 pan was extended and longer than that in the fire with 0.36 m2 pan. This was consistent with smoke density measured in tests. As shown in Figure 6.13, the smoke density measured in the fire with 2.0 m2 pan was lower than that measured in the fire with 0.36 m2 pan due to its incomplete combustion.
35 During tests, the propane burner was used to simulate large pool fires underneath the vehicle. The setup of the fire scenarios was the same as those with gasoline pool fires. Two tests with different propane fire sizes (tests T-16 and T-18) were conducted. As shown in Figure 6.17 with a propane fire in test T-16, the fire generated from the propane burner is similar to the fire generated from a underneath gasoline pool, when it is viewed from the front of the simulated vehicle. However, no smoke was generated from propane fires.
The heat release rate generated from the propane burner in two tests was controlled manually to simulate those generated from underneath gasoline pool fires, based on previous calibration tests [2]. Figure 6.18 shows variation of ceiling temperatures with time in tests T-7 and T-16 with gasoline and propane fires. The temperatures were measured at thermocouple #28 located at the center of the tunnel ceiling in two tests. For the similar heat release rate, the temperature generated in two tests had a similar developing trend and their maximum temperatures were also close.
During two tests involving propane fires, the smoke detecting system D-9S1 had no response to the propane fires due to no smoke in the tunnel. The visual CCTV flame detector D-6C3 had difficulty to detect the propane fires. It detected the fire with 1,500 kW at 195 s in test T-16 and could not detect the large fire with 3,000 kW in test T-18. All other detectors/detection systems were able to detect the propane fires. Their detecting time decreased with an increase in propane fire size. Compared to the same setup with a 1.0 m2 gasoline pool fire in Test T-7, the detecting time for the 1,500 kW propane fire in Test T-16 was reduced for linear heat detection systems D-1L1 and D-2L2, and for two spot heat detectors (D-7H1 and D-8H2), but slightly increased for the optical flame detector D-3F1 and the visual CCTV flame and smoke detector D-4C1. The sensing cable of the linear heat detection system D-2L2 was damaged in Test T-18, after the maximum ceiling temperature was higher than 240oC.
36
Figure 6.17. A propane fire (1,500 kW) in test T-16
a). Side view of a underneath propane fire
37
Figure 6.18. Ceiling temperatures measured at Thermocouple #28 at center of the tunnel ceiling in test T-7 with gasoline fuel and in test T-16 with propane fuel
Time (s) 0 50 100 150 200 250 300 350 400 450 Ceiling T em p er at ure ( o C) 0 40 80 120 160 200 gasoline propane fire scenario
38
Figure 6.20. Overview of the setup for a pool fire behind a vehicle Figure 6.19. Schematic of the setup for a pool fire behind a vehicle
6.1.3.
Open Pool Fires behind a Large VehicleThe fire scenarios were designed for simulating tunnel fire incidents in which an open gasoline pool fire was formed behind a large vehicle due to the crash or mechanical failure of the vehicle. The fire scenario was constructed by placing an open pan fire behind a large plate. The plate had a size of 2.5 m (8.3 ft) wide by 3.5 m (11.7 ft) high, being representative of the size of a large truck. It was placed 0.3 m (1 ft) above the ground, and 6 m (20 ft) in front of the pool fire, simulating the front portion of a crashed truck located between the pool fire and the detectors. The distance between the edge of the plate and the wall of the tunnel was 1.2 m (4 ft). The schematic of an open pool fire located behind a large vehicle and overview of its setup are shown in Figures 6.19 and 6.20.
39
Figure 6.22. Front view of a 0.09 m2 gasoline pool fire behind a large vehicle (T-8) Figure 6.21. A 1.0 m2 gasoline pool fire behind a large vehicle
Four tests with gasoline pool fires ranging from 125 kW to 3,400 kW were conducted. Four pans with sizes of 0.09 m2, 0.36 m2, 1.0 m2 and 2.0 m2 were placed behind the large plate, respectively. The gasoline pool fire behind the vehicle was a freely burning fire with sufficient air supply. It developed very quickly and generated a hot smoke layer below the ceiling, as shown in Figure 6.21 with a 1.0 m2 gasoline pool fire in test T-10.
40
6.23. Front view of a 2.0 m2 gasoline pool fire behind a large vehicle in test T-11 a). A 2.0 m2 gasoline pool fire behind a large vehicle at 10 s after ignition
b). A 2.0 m2 gasoline pool fire behind a large vehicle at 25 s after ignition
However, it was difficult to view the flames from front of the large vehicle. When the fire was small, the flame was not big enough to stretch out from behind of the vehicle, and the flame could only be observed from the gap between the bottom of the vehicle and the ground (Figure 6.22). With an increase in fire size, the flame became big and high, and it flickered out from behind of the large vehicle, as shown in Figure 6.23a with a 2.0 m2 gasoline pool fire in test T-11. However, as shown in Figure 6.23b, the smoke layer quickly formed and descended from the ceiling within a short period of time, which blocked the view to the flames from front of the large vehicle.
41 Time (s) 0 50 100 150 200 250 300 350 400 450 He at Fl ux (kw/ m 2 ) 0 5 10 15 20 25 30 under vehicle behind vehicle Fire scenario Time (s) 0 50 100 150 200 250 300 350 400 450 C eiling Tem perat ure ( o C) 0 40 80 120 160 200 under car behind car fire scenario
Figure 6.24. Heat flux measured at 1 m from the fire source with a 1.0 m2 gasoline pool pan at two fire scenarios (tests T-7 and T-10)
Figure 6.25. Ceiling temperatures measured at 3 m from the fire source with a 1.0 m2 gasoline pool pan at two fire scenarios (tests T-7 and T-10)
Figures 6.24 to 6.26 compare the heat flux measured at 1 m from the fire source, the ceiling temperatures measured at 3 m from the fire source, and smoke density measured at 15 cm below the ceiling with the same gasoline pool pan (1.0 m2) for fires located underneath and behind the vehicle in tests T-7 and T-10. They indicate that fires behind the vehicle develop much faster than fires underneath the vehicle, and generate hotter ceiling temperatures. Also, the hot smoke layer is more quickly built below the ceiling. The tests for fires behind the vehicle were terminated by using a compressed air foam (CAF) system. A substantial increase in fire size and heat release rate was generated as the discharge of foam agitated the combustion of gasoline fire.
42 Time(s) 0 50 100 150 200 250 300 350 400 450 Smoke D ens ity (OD /m) 0.0 0.2 0.4 0.6 0.8 1.0 1.2 1.4 under vehicle behind vehicle fire scenario
Figure 6.26. Smoke Density measured at 0.15 m below the ceiling at the center of the tunnel with a 1.0 m2 gasoline pool pan at two fire scenarios (tests T-7 and T-10)
Time (s) 0 50 100 150 200 250 300 350 400 450 Hea t Flux (kw /m 2 ) 0 10 20 30 40 125 650 1,700 3,400 Fire size (kW)
Figure 6.27. Heat flux measured from four pool fires behind the vehicle
Figure 6.27 compares the changes in heat flux generated from four fire sizes behind the vehicle in the tests. The large fires not only generated high heat flux and their developing rate also tends to be faster than small fires. It took less than 30 s for the fire with a size of 3,400 kW to reach its maximum heat release rate. In addition, their developing trends were different from those observed in pool fires underneath the vehicle, as shown in Figure 6.12.
43
Distance from north wall of tunnel (m)
1 2 3 4 5 6 7 8 9 Ceilin g te mp era ture ( o C) 0 100 200 300 400 500 125 kW 650 kW 1,700 kW 3,400 kW Fire size
Distance from east end of the tunnel (m)
0 5 10 15 20 25 30 35 40 Ceiling T e mpe ratu re ( o C) 0 50 100 150 200 250 300 125 kW 650 kW 1,700 kW 3,400 kW Fire Size
Figure 6.28. Maximum ceiling temperatures across the tunnel measured near the fire source in four pool fires behind the vehicle
Figure 6.29. Maximum ceiling temperatures along center of the tunnel measured in four pool fires behind the vehicle
Figures 6.28 and 6.29 are maximum ceiling temperatures across the tunnel near the fire source and along the center of the tunnel that were measured from four pool fires behind the vehicle. The ceiling temperatures substantially increased with fire size and the maximum ceiling temperature near the fire source was higher than 400oC for a pool fire of approximately 3,400 kW. The ceiling temperatures across the tunnel and along the center of the tunnel quickly dropped with an increase in distance from the fire source. Their drops in temperature tended to increase with an increase in fire size. For example, the drop in the maximum ceiling temperature between two locations (1.6 m and 5.0 m to north wall of the tunnel) across the tunnel was from 419oC to 257oC for the fire of 3,400 kW and from 209oC to 138oC for the fire of 1,700 kW.
44 Time(s) 0 20 40 60 80 100 120 140 160 180 200 Smok e D en s it y ( O D /m) 0.0 0.5 1.0 1.5 2.0 2.5 125 650 1,700 3,400 Fire size (kW)
Figure 6.30. Smoke density generated in four pool fires behind the vehicle
Figure 6.30 further shows changes in smoke density measured at 15 cm below the ceiling in four pool fires behind the vehicle. With an increase in fire size, not only the smoke density generated substantially increased, but also the smoke spread in the tunnel speeded up. As indicated in Figure 6.30, it took approximately 40 s after ignition for the smoke generated from the fire of 125 kW to reach the center point of the tunnel, but only approximately 15 s for the smoke generated from the fire of 3,400 kW to reach the same location.
45 During tests, linear heat detection system D-1L1 detected all the four fires behind the vehicle ranging from 43 s to 10 s. Its detecting time decreased with an increase in fire size. Linear heat detection system D-2L2 could not detect a small fire with a 0.09 m2 gasoline pool, but it detected all other three fires ranging from 58 s to 14 s. Its detecting time also decreased with an increase in fire size. As shown in Table 6.1, the detecting times of both linear heat systems for fires behind the vehicle were shorter than their detecting times for fires underneath the vehicle. The sensing cable of the linear heat detection system D-2L2 was damaged in test T-11 with 2.0 m2 gasoline pool fire, after the maximum ceiling temperature reached beyond 400oC.
Optical flame detector D-3F1 quickly detected all the four fires ranging from 22 s to 8 s. The detecting time decreased with an increase in fire size.
Visual CCTV flame and smoke detector D-4C1 detected all the four fires in tests. Its detecting time was 19 s for the 0.09 m2 gasoline pool fire, but increased to 127 s for the 0.36 m2 gasoline pool fire, and then reduced to 26 s for the 2.0 m2 gasoline pool with an increase in fire size.
The visual camera was able to provide video images on fire conditions in the tunnel during 6 minutes long of the test period with 0.09 m2 gasoline pool fire. When the fire size increased, the period of time available for monitoring the tunnel conditions decreased, as the smoke density in the hot layer increased. The time for completely shutting visual view of the camera due to smoke was approximately 3 minutes for 0.36 m2 gasoline pool fire, 1:28 minutes for 1.0 m2 gasoline pool fire, and 34 seconds for 2.0 m2 gasoline pool fire. They were much shorter than those in the fires underneath the vehicle.
Visual CCTV flame detector D-6C3 had no response for four gasoline pool fires behind the vehicle.
Both spot heat detectors D-7H1 and D-8H2 only responded to two large fires with 1.0 m2 and 2.0 m2 gasoline pans, as they did in fires underneath the vehicle. This was consistent with temperatures measured in the tests. As shown in Figure 6.29, the maximum ceiling temperatures at the center of the tunnel that were generated in fires with 0.09 m2 and 0.36 m2 gasoline pans were lower than those alarming levels of two spot heat detectors. However, their detecting times were much shorter than those in detecting fires underneath the vehicle. They both detected a 2.0 m2 gasoline pool fire around 20 s.
Smoke detection system D-9S1 detected all the four gasoline fires behind the vehicle ranging from 125 s to 33 s. Its detecting time decreased with an increase in the fire size and was slightly shorter than those in tests involving fires underneath the vehicle, particularly for the 2.0 m2 gasoline pool fire. The fire behind the vehicle developed quickly, resulting in a short detecting time.
46
Figure 6.31. Overview of the setup for the engine compartment
6.2. Stationary Vehicle Fires
Two types of stationary vehicle fire scenarios were used in the test program: an engine compartment fire and a passenger compartment fire. The fire scenarios were designed to simulate fire incidents in which the fire ignited from either engine compartment or passenger compartment of the vehicle due to the crash or mechanical failure of the vehicle. Compared to the pool fires, the fires in the engine and passenger compartments of the vehicle developed much slowly due to their fuel type and location [4, 5].
During tests, no obstacle was located between the fire source and the detectors. Fuel materials in tests included gasoline, propane, plastic foam, and wood crib. The performance of fire detectors/detection systems to slowly growing fires was investigated in tests. Test conditions and results in stationary vehicle fire tests are listed in Table 6.2.
6.2.1. Engine Compartment Fires
A simulated vehicle engine compartment with a dimension of 1.5 m (5 ft) wide x 1.2 m (4 ft) long x 0.67 m (2.2 ft) high was built, as shown in Figure 6.31. Two simulated engine compartment fire tests involving two fuel types (T-5 and T-17) were conducted.
For test T-5, a gasoline fuel pan with a movable lid was placed inside the engine compartment. The dimension of the fuel pan was 1.0 m wide x 2.0 m long x 0.2 m high. During test, the size of the opening of the pan gradually increased to simulate the fire growth rate generated from a real vehicle engine compartment fire [2, 4, 5]. The maximum heat release rate generated in the test was approximately 2,000 kW.
For test T-17, the propane burner that had a controlled heat release rate was also used for simulating a vehicle engine compartment fire. Its growth rate and heat release rate during test were similar to those generated from a real vehicle engine compartment fire [4, 5].
47 FIRE SCENARIO TEST NO FIRE SOURCE FUEL TYPE HEAT RELEASE RATE (KW) TROOM (OC) D-1L1 (S) D-2L2 (S) D-3F1 (S) D-4C1 (S) D-5C2* (S) D-6C3 (S) D-7H1 (S) D-8H2 (S) D-9S1 (S) T-5 Engine compartment Gasoline ~2,000 1 107 175 5 76 96 149 391 295 177 T-17 Engine compartment
Propane ~2,000 9 33 71 5 7 N/A N/A 338 252 N/A
T-14 Passenger compartment Wood crib 1100~1500 13 171 291 173 188 178 271 N/A N/A 230 Stationary vehicle fire T-19 Passenger compartment
Foam 100 10 105 N/A 76 12 61 N/A N/A N/A 115
Note:
a) No testing data from Detecting System D-5C2 were collected by the project data acquisition system, because of technical malfunction of System D-5C2. The test data of System D-5C2 that are listed in Table 7.1 were provided by the system supplier after the tests, which are not verified by the project.
b) The systems listed in the table are follows:
i. D-1L1: Linear fiber optic heat detection system ii. D-2L2: Linear cable heat detection system iii. D-3F1: Flame detector
iv. D-4C1: CCTV flame/smoke detector v. D-5C2: CCTV flame detector
vi. D-6C3: CCTV flame detector vii. D-7H1: Spot heat detector viii. D-8H2: Spot heat detector
ix. D-9S1: Smoke detection system
48 Time (s) 0 100 200 300 400 500 600 700 H eat F lux (k w /m 2 ) 0 10 20 30 40 1 m 2 m 5 m 10 m 29 m Heat flux location
Figure 6.32. Tunnel conditions during an engine compartment vehicle fire in test T-5
During test T-5, the fire gradually grew up and flames stretched outside the engine compartment. It took more than 8 minutes for the fire to become a large one (Figure 6.32). The fire development and smoke spread in the tunnel could be observed clearly, since there was no obstacle around the simulated vehicle.
Figure 6.33 shows the heat flux measured at different locations of the tunnel. The fire grew up slowly. It took more than 8 minutes for the fire to reach its maximum heat release rate. The test was terminated by using a compressed air foam (CAF) system. A substantial increase in fire size and heat release rate was generated as the discharge of foam agitated the combustion of gasoline fire.
49
Figure 6.34. Ceiling temperatures along center of the tunnel in Test T-5 with an engine compartment fire
Figure 6.35. Ceiling temperatures across the tunnel near fire source in Test T-5 with an engine compartment fire
The variation of ceiling temperatures along the center of the tunnel and across the tunnel near the fire source in test T-5 is shown in Figures 6.34 and 6.35. The ceiling temperatures increased slowly with time and reached their maximum temperatures of 150oC at the center of the tunnel and 230oC near the fire source after approximately 8 minutes of growing up. The ceiling temperatures further increased as the CAF foam was applied to terminate the test.
Time (s) 0 100 200 300 400 500 600 700 Ce iling Te m perat ure ( o C) 0 50 100 150 200 3.12 6.25 9.38 12.50 15.62 18.75 21.88 25.00 28.12 31.25 34.38
TC location from east end of tunnel (m)
Time (s) 0 100 200 300 400 500 600 700 Ceiling T e m perature ( o C) 0 50 100 150 200 250 300 8.34 6.67 5.00 3.34 1.67
50
Figure 6.36. Variations of smoke density below the ceiling at center of the tunnel in Test T-5 with an engine compartment fire
Time(s) 0 100 200 300 400 500 600 700 Smo k e De ns it y (O D/ m) 0.0 0.2 0.4 0.6 0.8 1.0 1.2 1.4 2.5 m from ground 1.53 m from ground 0.15 m from ceiling Locations
Figure 6.36 shows variation of smoke density measured at the middle of the tunnel with time in test T-5. Smoke density in the tunnel also slowly increased. The smoke density at 15 cm below the ceiling was very low at beginning of 2 minutes of the fire growing period, and then gradually increased. The smoke densities measured at 1.53 m and 2.5 m from the ground started to increase approximately 4 minutes after ignition.
The fire detectors/detection systems generally had slow response to the engine compartment fire in test T-5, as the fire grew up slowly. The linear heat detection systems D-1L1 and D-2L2 detected the fire at 107 s and 175 s. Two spot heat detectors D-7H1 and D-8H2 detected the fire at 391 s and 295 s. The smoke detection system D-9S1 also had a slow response to the engine compartment fire at 177 s. Two visual CCTV detectors D-4C1 and D-6C3 detected the fire at 76 s and 149 s. However, the optical flame detector D-3F1 quickly detected flames emitted from the engine compartment at 5 s after ignition.
The fire in test T-17 involving propane fuel also grew up slowly. Flames stretched out from two sides of the engine compartment but no smoke was generated. The response times of linear heat detection systems, spot heat detectors and the visual CCTV detector D-4C1 to the propane fire were shorter than their times to the engine compartment fire with gasoline, as shown in Table 6.2. The response time of the optical flame detector D-3F1 had no changes in two fire tests. However, both visual CCTV detector D-6C3 and the smoke detection system D-9S1 had no response to the fire in the test.
51
Figure 6.37. Overview of the setup for a passenger compartment vehicle fire
6.2.2. Passenger Compartment Fires
One mock-up simulating the front portion of a vehicle passenger compartment with a dimension of 1.5 m (5 ft) wide x 1.2 m (4 ft) long x 1.2 m (4 ft) high was built. It was assumed that during the fire incident, the door at the driver side of the vehicle was left open, as the driver escaped from the burning vehicle. Two simulated passenger compartment fire tests involving two fuel types (T-14 and T-19) were conducted.
Wood cribs with a dimension of 0.8 m x 0.8 m x 0.7 m and a weight of 62.5 kg were placed inside the compartment in test T-14. Three small pans with 100 ml of methyl hydrate per pan were placed underneath the wood crib in a triangle position. They were used as ignition sources for the wood crib fire. The setup of the passenger compartment fire scenario is shown in Figure 6.37.
The wood crib fire was easily controlled and repeated in the tests. It could generate a fire that had a similar heat release rate and growth rate as those generated in a real vehicle passenger compartment fire [4, 5], when appropriate wood crib size and ignition source were used. The heat release rate of the simulated passenger compartment fire generated by the wood crib fire was measured in Task 1 of the project [2]. Its maximum heat release rate generated in the test was approximately 1,200 kW.
During test T-19, polyurethane foam was used to simulate the smokes and fires generated from the vehicle passenger compartment at its initial fire stage. The dimension of the foam was 0.6 m by 0.6 m by 0.1 m thick and its weight was 1.0 kg, generating a fire with the heat release rate of 100 kW. The combustion characteristics of the polyurethane foam, including its heat release and smoke generation rate, was investigated in a NRC research project [6].