Analysis of Asset Health
-
an Approach to Monitoring and Diagnostics
for Medium Voltage Circuit Breakers
byErick Corona
B.S. Mechanical and Electrical Engineering, ITESM, Monterrey, Mexico, 2002 M.S. Aeronautics and Astronautics Engineering, University of Washington, Seattle, 2009
Submitted to the MIT Sloan School of Management and the Engineering Systems Division in Partial Fulfillment of the Requirements for the Degrees of
MASTER OF BUSINESS ADMINISTRATION AND
MASTER OF SCIENCE IN ENGINEERING SYSTEMS In conjunction with the Leaders for Global Operations Program at the
Massachusetts Institute of Technology June 2013
C 2013 Erick G. Corona. All rights reserved.
The author hereby grants to MIT permission to reproduce and to distribute publicly paper and electronic copies of this thesis document in
whole or in part in any medium now known or hereafter created.
ARCHNES
MASSACHUSETTS INSTTTE OF TECHNOLOGYMAY 3 0 2013
LIBRARIES
Signature of AuthorEngiffering Syfms Division, MIT Sloan School of Management May 10, 2013
R oy Welsch, Thesis Supervisor Profelor of 'tistics Men7geent Science, MIT Sloan School of Management
i/Af/y/-'~-John G. Kassakian, Thesis Supervisor Professor 1 lectrical Engineering, MIT School of Engineering
I/L
I /(YAAAL. V A-N
'
aura Herson, Director of MIT Sloan MBA Program MIT Sloan School of ManagementOI0'1idIe xI67cIair, Engineering Systems Education Committee Associate Professor of Aeronautics and Astronautics and Engineering Systems Certified by Certified by Accepted b Accepted b3 4 42 / ."- / - - , -I - - F - -
Analysis of Asset Health
-
an Approach to Monitoring and Diagnostics
for Medium Voltage Circuit Breakers
by Erick Corona
Submitted to the MIT Sloan School of Management and the Engineering Systems Division on May 10, 2013 in Partial Fulfillment of the Requirements for the Degrees of Master of Business
Administration and Master of Science in Engineering Systems
ABSTRACT
The Medium Voltage Electric Industry is a very conservative and risk adverse sector that has undergone very little change in the past 30 years when compared to other technologically dependent activities; this reality is rapidly shifting.
The advent of cost-effective and reliable telecommunications, coupled with the drastic price decrease of wireless communication and sensing technologies, are steering the industry towards an information based era that is generically known as smart-grid.
With an emphasis on medium voltage circuit breakers, the purpose of this thesis was to identify sensor technology and analytics that will allow electric utilities in North America-primarily the United States-to assess the health of their equipment and utilize this information for maintenance operational decisions.
The main areas of research included in this work were the market context for medium voltage circuit breaker Monitoring & Diagnostics solutions, the financial justification for such applications, and the technical merit of multiple sensor technologies and associated analytics. The findings of this research helped support the development of an advanced Monitoring and Diagnostics kit currently deployed at a customer site as part of a pilot demonstration program. The prototype system provides real-time monitoring and trending information for six
reactor-switching 15 kV circuit breakers.
The completion of this thesis, and successful development of the advanced Monitoring and Diagnostics kit, was the result of the collaborative effort of a small interdisciplinary team assembled to identify smart-grid opportunities in the medium voltage space. This work took place at ABB's Medium Voltage Headquarters in the United States.
Thesis Supervisor: Roy Welsch
Title: Professor of Statistics & Management Science, MIT Sloan School of Management Thesis Supervisor: John G. Kassakian
ACKNOWLEDGMENTS
I
would first like to thank the LGO program for granting me the opportunity to become part of such an amazing community. The past two years have been full of challenges and enriching experiences that have marked my professional and personal life. Foremost, I would like to thank my fellow-classmates for making this journey so special.I would also like to thank my academic advisors, Professors John Kassakian and Roy Welsch for the wisdom offered as I found my way through this project. Your support and ability to steer me through some of the obstacles I encountered is greatly appreciated.
Thank you, as well, to my colleagues at ABB Lake Mary, particularly Doug Voda, Stuart Laval, David Lawrence, Cory Nguyen, and Wei Huang. The results documented in this thesis would not have been possible without your support. Again, thank you.
I would like to thank my parents and siblings for their love, patience, everlasting laughter, and grounded perspective. To all the friends and family who have made this journey possible, I thank you sincerely.
To my beloved daughter Analisse, the joy you bring is the dear reminder of the true meaning of life. A mi querida esposa Lissy, te agradezco tu amor y carif5o durante esta travesia. Tu apoyo incondicional me motiva para ser mejor persona, padre, y marido.
TABLE OF CONTENTS
ABSTRACT ... ... 3 ACKNOWLEDGMENTS... 5 T A B LE O F C O N TEN T S ... 7 L IST O F F IG U R E S ... 9 L IST O F T A B L E S ... 11LIST OF ABBREVIATIONS, ACRONYMS, AND SYMBOLS ... 12
1 SMART-GRID, WHAT IT IS AND ITS SIGNIFICANCE ... 13
1.1 In tro d u ctio n ... 13
1.2 Context of Smart-Grid in the United States ... 14
1.2.1 Reliability and an Ageing Infrastructure... 15
1.2.2 T echnological C hallenge... 16
1.2.3 Financial and Policy C hallenge... 17
1.3 Project M otivation and G oal ... 17
1.4 R esearch M ethodology... ... 19
1.5 T h esis O utlin e ... 2 0 2 ABB NORTH AMERICA & SMART-GRID ... 21
2.1 A B B C orporate B ackground ... 21
2.2 ABB North America Power Products Medium Voltage (PPMV) ... 22
2.2.1 ABB PPMV NA Product Portfolio ... 23
2.2.2 ABB PPMV NA Utility Sales Channel... 23
2.2.3 ABB PPMV NA R&D and Product Design Capabilities... 24
2.3 ABB North America's Smart-Grid Efforts ... 24
3 RELIABILITY OF MEDIUM VOLTAGE CIRCUIT BREAKERS ... 26
3.1 Circuit Breaker Technology and Operation Basics... 26
3.2 Medium Voltage Circuit Breaker Reliability - Industry Guidelines ... 27
3.3 The Impact of Ageing on Reliability ... 28
3.3.1 T he G erm an Experience... 28
3.3.2 Insights from the U.S. Nuclear Generation Sector... 29
3.4 MV Circuit Breaker Survivability Simulation ... 30
3.4.1 Survivability Sim ulation Inputs ... 30
3.4.2 Survivability Sim ulation R esults... 32
3.4.3 Survivability-Simulation Insight ... 32
3.5 MV Circuit Breaker Reliability Summary ... 33
4 MEDIUM VOLTAGE CIRCUIT BREAKER FAILURE MODES...34
4.1 MV Circuit Breaker Failure Modes - Available Information... 34
4.1.1 IE E E 493 R eport ... 34
4.1.2 The German and U.S. Nuclear Generation Experiences...34
4.1.3 CIGRE Report on HV Circuit Breaker Reliability ... 35
4.2 IEEE Guide for the Selection of Monitoring for Circuit Breakers ... 35
4.3 OEMs as a Source of Failure Mode Information ... 37
4.4 Existing Maintenance Practices - a Validation Source...37
4.4.1 Circuit Breaker Time-Travel Analysis ... 37
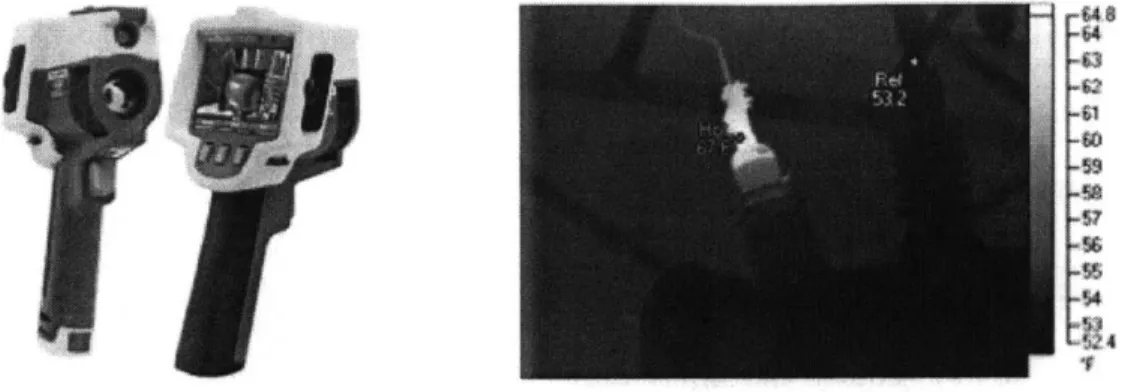
4.4.2 Circuit Breaker Hot-Spot Testing ... 38
5 THE BUSINESS CASE FOR MV CIRCUIT BREAKER M&D ... 40
5.1 The Business C ase for O EM s ... 40
5.2 The Value Proposition for Utility Customers ... 41
5.2.1 Baseline Operations - Status Quo Inputs...41
5.2.2 M & D Scenario Inputs ... 42
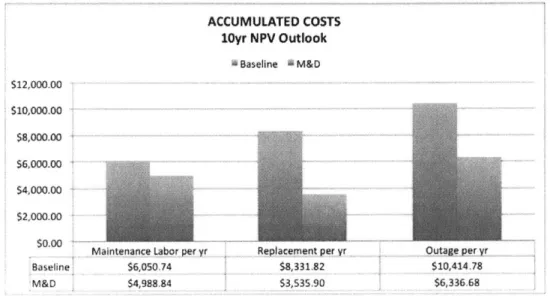
5.2.3 Customer Costs & Savings Model Results ... 45
5.3 MV Circuit Breaker Business Case Summary ... 46
6 EXISTING M&D ANALYTICS FOR MV CIRCUIT BREAKERS... 48
6.1 Thermal Monitoring of MV Circuit Breakers ... 48
6.1.1 Therm al M onitoring and Analytics ... 49
6.1.2 Tem perature Sensor Selection... 51
6.2 Mechanical Operation Monitoring of MV Circuit Breakers... 52
6.2.1 Circuit Breaker Mechanical Operation Monitoring ... 52
6.2.2 A ctuation System s... 53
6.2.3 Mechanical Operation Monitoring and Analytics... 57
6.2.4 Mechanical Operation Sensor Selection ... 58
6.3 MV M&D Integrated System Overview ... 59
6.4 MV Circuit Breaker M&D System -Summary ... 60
7 LABORATORY TESTING AND RESULTS ... 62
7.1 Sequence of Experim ents D esign... 62
7 .2 T est R esu lts ... 6 5 7.2.1 (a) - Symmetrical Testing Across 95%-75%-50%-25%-5% WIPE settings ... 65
7.2.2 (b) - Asymmetrical WIPE Testing to Evaluate Phase Interactions ... 66
7.2.3 (c) - Temperature and WIPE interactions... 68
7.2.4 (d) - Magnetic Actuator Mapping after 1000 Cycles ... 69
7.3 R esults and Insight ... 70
8 REACTOR SWITCHING-M&D ANALYTICS DESIGN...71
8.1 D aily O peration M onitoring... 71
8.2 Short Term Trending - Operation Shift Detection ... 71
8.3 Long Term Trending - Deterioration Factor Calculation ... 72
8.4 Temperature Correction - M&D Analytics Calibration ... 75
8.5 Deterioration Rate Estimation -Alternate Method ... 79
8.6 Reactor Switching Mechanical Operation Analytics - Summary ... 82
9 SUMMARY AND CONCLUSIONS...83
9.1 B ackground Inform ation ... 83
9.2 M&D System Design and Integration... 83
9 .3 K ey F in d in g s ... 83
9.4 Future Challenges and Research Opportunities ... 84
R E F E R E N C E S...85
10 APPENDIX A - MATLAB CODE ... 89
10.1 M V Breaker Survivability Study ... 89
10.2 M V Breaker Cost & Savings M odel ... 91
10.3 Deterioration Rate Estimation -Alternate Method Simulation...98
LIST OF FIGURES
Figure 1-1: North American Regions with Organized Electricity Markets...14
Figure 1-2: Sawtooth Bathtub Failure Rate Curve ... 15
Figure 1-3: Electric Generation, Transmission, and Distribution Infrastructure...17
Figure 1-4: Typical Substation Components and Layout...18
Figure 1-5: Medium Voltage Circuit Breaker M&D Research and Design Gates...19
Figure 2-1: ABB 2015 Strategy -12 Growth Areas... 22
Figure 2-2: ABB's Divisional Structure and North America PPMV Smart-Grid ... 22
Figure 2-3: ABB PPM V Product Offering ... 23
Figure 2-4: ABB, Competition, and Utility Customer Simplified Interaction Diagram...24
Figure 3-1: Arc Formation during Separation of Live Electric Contacts...26
Figure 3-2: Lifetime Estimation of German MV Electrical Components...28
Figure 3-3: MV CB Failure Events with Fitted Trend and 90% Confidence Band ... 29
Figure 3-4: MV Circuit Breaker Survivability Curves for Five Large U.S. Utilities...30
Figure 3-5: Growth Imbalance between Demand and System Capacity 1950-2012 ... 31
Figure 3-6: Survivability Simulation Bathtub Failure Rate Model ... 31
Figure 3-7: Survivability Sim ulation Results ... 32
Figure 3-8: Reliability Information -Past Experience and Inferences ... 33
Figure 4-1: Time-Travel Analyzer with Actuation Coil Current Output Plot...38
Figure 4-2: Thermal Imaging Equipment and Example of Circuit Breaker Hot-Spot...39
Figure 5-1: M&D Impact on OEM Market Intelligence and Customer Operations ... 40
Figure 5-2: Graphical Representation of M&D Timing and Effectiveness ... 43
Figure 5-3: M&D Financial Impact - Does not Include Deferral or Depreciation Analysis...45
Figure 5-4: NPV Accumulated Costs & Savings for Three Failure Reduction Scenarios...45
Figure 5-5: NPV Accumulated Costs & Savings -Includes Deferral and Depreciation...46
Figure 6-1: Temperature Monitoring Preferred Areas in MV Circuit Breaker M&D...48
Figure 6-2: Interrupter Heat Rise Characteristic ... 50
Figure 6-3: Interrupter Steady State Thermal Behavior: Normal (1), Worn (2), Faulty (3)...50
Figure 6-4: SAW W ireless Temperature Sensing System ... 51
Figure 6-5: MV Circuit Breaker Trip Coil Current Characteristic Features ... 53
Figure 6-6: Generic M agnetic Actuator System ... 53
Figure 6-7: Magnetic Actuator Operation - OPEN/CLOSE State and Transitions (a-d)...54
Figure 6-8: Magnetic Actuator Pulse Relationship to Mechanical Operation - (i-vii)...55
Figure 6-9: Spring Actuator Trip Operation Sequence Description - (a-f)...56
Figure 6-10: Spring Actuator Pulse Relationship to Mechanical Trip Operation - (a-f)...56
Figure 6-11: Spring Actuator Circuit Breaker Coil Monitoring Analytics - OPEN Pulse ... 57
Figure 6-12: Hall-Effect Transducer and Current Induced Magnetic Field ... 59
Figure 6-13: MV Circuit Breaker M&D Integrated Sensor Kit ... 60
Figure 7-1: 15 kV Circuit Breaker Most Important Coil Current Pulse Defining Features ... 63
Figure 7-2: Sequence of Experiments -Test Flow ... 64
Figure 7-3: Test Results -Magnetic Actuator Pulse Characteristics as a Function of WIPE ... 65
Figure 7-4: Test Results -Asymmetric WIPE Interactions -Predicted versus Actual Data...67
Figure 7-6: Test Results -Magnetic Actuator Pulse Characteristics with Temperature ... 68
Figure 7-7: Test Results - Symmetric WIPE Actuator Pulse Profile after 1000+ Cycles ... 69
Figure 8-1: OPEN and CLOSE Strike-Zones with Hypothetical Alarm Triggering Cond...71
Figure 8-2: Mechanical Operation Control Charts - Data from Last 30 Operations ... 72
Figure 8-3: Monitored Parameter Deterioration Rate -Regression Slope ... 73
Figure 8-4: Monitored Parameter Deterioration Factor Accuracy Simulation Results ... 73
Figure 8-5: Deterioration Rates over Time - Hypothetical Monitored Parameter...74
Figure 8-6: Fleet Status Board - Equipment Maintenance Prioritization ... 74
Figure 8-7: Hourly Registered Temperature for Three Major US Cities 2007-2011 ... 75
Figure 8-8: 365 Days of Temperature, IMAx and Temperature Correction for IMAX...76
Figure 8-9: Temperature Corrected IMAx & Deterioration Factor Linear Regression...77
Figure 8-10: Temp. Correction and Deterioration Factor Accuracy Simulation Results...77
Figure 8-11: Temp. Correction Term as a Function of Data Gathering Window Start Date ... 78
Figure 8-12: Temp. Correction Factor Time Window Computation Introduced Errors ... 78
Figure 8-13: Average and Standard Deviation Temperature Match ... 79
Figure 8-14: MAX CURRENT Deterioration Rate Visualization ... 80
Figure 8-15: Collection of Simulated Magnetic Actuator Profiles -Equipment Variability ... 81
LIST OF TABLES
Table 4-1: IEEE 493 Failure Mode Summary for MV Circuit Breakers - 1985 Survey...34
Table 4-2: M V Failure M odes versus OEM ... 35
Table 4-3: Failure Mode Mitigation Results for MV Vacuum Circuit Breakers ... 36
Table 5-1: IEEE 493 Assessment of Maintenance Practices on Distribution Reliability ... 43
Table 7-1: ASYMMETRICAL WIPE TEST SETTINGS ... 66
LIST OF ABBREVIATIONS, ACRONYMS, AND SYMBOLS
ABB - Asea Brown Boveri AC - Alternating Current A/D - Analog to Digital
AMI - Advanced Metering Infrastructure ANSI - American National Standards Institute CB - Circuit Breaker
CIGRE - International Council on Large Electric Systems (translatedfrom French) CVR - conservation voltage reduction
DC - Direct Current
DOE - Department of Energy
FDIR - Fault Detection, Isolation, and Restoration HV - High Voltage
IEEE - Institute of Electrical and Electronics Engineers IEC - International Electromechanical Commission ISO - Independent System Operator
IC - Integrated Circuit IT - Information Technology M&A - Mergers and Acquisitions M&D - Monitoring and Diagnostics MV - Medium Voltage
NA - North America NPV - Net Present Value
NRC - U.S. Nuclear Regulatory Commission O&M - Operations and Maintenance
OT - Operation Technology ROI - Return on Investment
RTD -Resistance Temperature Detector RTO - Regional Transmission Operator SAW - Surface Acoustic Wave
SCADA - Supervisory Control and Data Acquisition T&D - Transmission and Distribution
1 SMART-GRID, WHAT IT IS AND ITS SIGNIFICANCE
1.1 Introduction
The concept of Smart-grid has been evolving for at least 20 years and is yet to be fully defined in literature, policy, and technological specifications. In essence, a smart-grid is an electric transmission and distribution (T&D) network managed through the analysis and synthesis of massive amounts of information.
Although existing electric grids hold the capability of generating some information through existing supervisory control and data acquisition systems (SCADA), current architectures have limited information flow bandwidth and/or the flexibility to incorporate additional information that might be useful to an electric utility operator. Thus the importance of Smart-grid-Smart-grid envisions enhanced data acquisition systems, data transmission and storage technology, and the use of computing power and analytics to help manage electric grid operations.
Moreover, from an economic standpoint, smart-grid offers the promise of enabling more efficient and reliable dispatch and routing of electricity. Utilities will have enhanced real-time monitoring of their networks and will thus be able to reduce system energy losses with the adoption of
conservation voltage reduction (CVR) and fault detection, isolation, and restoration (FDIR)
technology. Utilities will also have the ability to transition away from time-based maintenance schemes and deploy data-intensive monitoring and diagnostic approaches to manage their assets. Along with the economics, smart-grid also envisions the capability to effectively incorporate renewable sources (e.g., wind, solar) and manage their inherent intermittency; this capacity to adapt is a critical technological enabler if renewable resources are to become significant contributors in the electric generation mix. The same enabling argument exists for electric vehicles, distributed generation (e.g., residential solar panels), energy storage, and advanced electric grid ancillary services (e.g., demand response).
Additionally, on the consumer's side, as smart metering becomes pervasive and tariff structures better reflect the "true cost" of electricity, utility customers will have the ability to shift loads away from peak prices and allow for an overall more efficient use of electric generation capabilities.
In the same way that Smart-grid is an enormous technological undertaking, it is also an equally important financial and policy challenge. As with any infrastructure upgrade, the cost of developing and deploying smart-grid will require billions, and be subject to a complex political-regulatory landscape; the utility space is risk adverse and not accustomed to the rapid pace with which technology for the sector has evolved.
Consequently, smart-grid will be distinct across the electric utility spectrum and will be reflective of the technological needs and capabilities, policies, and financial means of the distinct territories in which utilities operate.
To sum up, in 2003 The National Academy of Engineering announced that Electrification was the most significant engineering achievement of the 2 0th century. Therefore, in a world evermore
reliant on electricity, smart-grid is the 2 1s' century evolution-the next chapter-in what is an
1.2 Context of Smart-Grid in the United States
The electric sector in the United States serves 143 million residential, commercial, and industrial customers through more than 6 million miles of transmission and distribution lines owned and/or managed by more than 3,000 entities that range from investor owned companies to cooperative enterprises [1].
But the United States, unlike other developed nations, does not have a unified national electricity policy as regulation occurs at the state, as well as the federal level. Partly because of this fragmented regulatory landscape between federal and state authorities, the U.S. is composed of vertically integrated utilities, cooperative utilities, and organized wholesale electricity markets operated by Independent Transmission Organizations (ISOs) or Regional Transmission Organizations (RTOs) as seen in Figure 1-1.
Alberta Electric
System Operator MIS
Ontario Independent ElentrilIty Systemn Operator
New Brunswick
.. c System" operator
- NeISO Now England
NwYork 1S0
P.IM Interconnection
California ISO
Southwest
Power Pool
Electric Reliability s oMTO Cotmel
Council of Texs
Source: ISO/RTO Council, http://www.isorto.org. Copyright @ ISO/RTO Council, all rights reserved.
Figure 1-1: North American Regions with Organized Electricity Markets
The lack of a shared policy, over time, has resulted in the adoption of distinct engineering standards and equipment management practices that are at times anchored in rules of thumb dating back to an era where computing power was not available to adequately plan for an optimal system. Over time, and partly due to the lack of communication that exists amongst utilities, these standards and practices have evolved in a disjoint fashion with the most serious disconnect existing in the distribution arena.
The Federal Government understands the need for modernization. During the Bush administration, the U.S. Congress put forth the Energy Independence and Security Act of 2007, which identifies the modernization of the grid as a directive for the country and instructs the
Department of Energy (DOE) to issue a report on the status of smart-grid deployment. During the Obama administration, the American Recovery and Reinvestment Act of 2009 directed $4.5 billion to the DOE for modernization of the electric grid and increases grants for the Smart Grid
Investment Program from 20% to 50% [2].
Although the federal directives and availability of funds are steps in the right direction, they are not enough because the nation's smart-grid efforts are still uncoordinated and geographically disperse. Examples of this abound and can be found in the troubled and localized adoption and deployment of advanced metering infrastructure (AMI), the distinct regulatory and market approaches with which demand response and distributed generation are managed, and the different campaigns designed to engage utility customers, amongst others.
From an economic standpoint, the need for smart-grid is paramount if one considers that increasingly scarce energy resources conflict with U.S. expected electricity demand growth. By 2050, EPRI estimates that the average electric bill could reach 400% if smart-grid technologies are not deployed; whereas, with the adoption of smart-grid the projected increase is 50% [3].
1.2.1 Reliability and an Ageing Infrastructure
In 2011, the McDonnel Consulting Group published a report [4] showing that 53% of the top 100 utilities in North America rank ensuring reliability of their ageing assets as a top strategic priority, and 94% consider it one of their top three priorities. The report, unlike surveys conducted in the past, brings the problem of an ageing infrastructure to the forefront because the cost of maintaining existing assets, in order to deliver expected reliability, is becoming more expensive. The ageing electrical infrastructure problem in the U.S. is not new, and has been expected and documented in literature for the past twenty years. The main problem with old equipment is that it is three to ten times more likely to fail than newer equipment, and the onset of increased failure rates typically follows an exponential trajectory as seen in Figure 1-2.
... ---. Maintenance Reduces Failure Rate
0.6
Mban
Failure
Rate
During Usef ul Life 014
0.
0
0
10
20
30
Component Age
(years)
Source: Brown, R., Electric power distribution reliability, 2009 Figure 1-2: Sawtooth Bathtub Failure Rate Curve
The higher load factors that the U.S. system has observed in the past 30-40 years' further exacerbate the issue. These higher loads are a consequence of the lack of investment that has failed to keep up with demand growth, and are directly responsible for an acceleration of the ageing phenomenon. On top of this, through the 1990s, many de-regulated utilities saw budgetary reductions of 25%-35%, which impacted maintenance operations-and thus worsened the ageing infrastructure problem [5].
The level of investment required to modernize the existing U.S. electric grid is prohibitively expensive if the system is to perform with the same reliability as in the past. Rather than increasing the frequency of time-based maintenance intervals to mitigate the ageing infrastructure problem, smart-grid offers the possibility of implementing condition based maintenance schemes as a means of extending the life of existing equipment.
1.2.2
Technological Challenge
The technological foundation required to put in place smart-grid: viable sensors, widespread telecommunications, and the availability of storage and computing power, are all readily available as evidenced by systems already utilized in industrial/manufacturing settings. The main challenge is not the technology itself, but rather the design and integration of smart-grid as a system.
In order for smart-grid to be successful, clear specifications need to be defined so that all interfacing parties are capable of designing components-sensors, telecommunications, and software-in such a way that they plug-and-play. In the United States, in line with the lack of a decisive electric sector policy, there has not been a serious effort to define interface standards and overall system architecture for the system2
A major hurdle to piecing smart-grid together in the U.S. is the siloing that characterizes the industry. Information sharing amongst utilities is not pervasive given that each serves distinct territories and more than likely operates in separate regulatory environments. Moreover, even within utilities, transmission and distribution planning are viewed as "Church and State " and this divide is even reflected in the organizational structures of electrical equipment vendors, which in turn places an additional hurdle for the much-needed systems integration capability required. Another barrier for smart-grid is the pressure of time imposed by the fact that utilities will need to replace 46% of skilled technician positions by 2015 because of retirement or attrition [6]. Smart-grid, with the potential of utilizing information to streamline operations, is essential in order to bridge this imminent workforce gap. This gap becomes even wider if one realizes that an ageing grid requires more effort to maintain: the challenge is to deploy smart-grid in a short period. Along the way, smart-grid will provide vast amounts of information, which in itself will be an immense challenge to manage. Ultimately, the way in which we store, analyze, and extract value from the grid will be a reflection of the degree of consensus achieved throughout the industry in what is clearly a highly complex system design and integration challenge.
Average electrical feeder loading in metropolitan areas increased 50% between 1965-2000 [5].
2 Cyber-security, a key element of the grid given its national security aspect, is the focus of much attention and concern when discussing requirement definitions.
1.2.3
Financial and Policy Challenge
The lack of standards, silos, and the complexity presented by interests involved in de-regulated territories, are all elements of risk to the development and adoption of multi-billion dollar modernization investments. These elements, in the midst of the traditionally risk adverse electric sector, explain the slow pace that has characterized smart-grid deployment in the U.S.
The fragmented utility landscape of the United States has the unintended consequence of creating an environment in which the business case for distinct smart-grid applications is difficult to make as each region's operational realities are distinct and/or are yet to be defined (e.g., monetization of frequency regulation). With utilities subject to distinct operational and regulatory constraints, achieving production economies of scale with inter-operable systems is harder to achieve.
Nevertheless, the societal benefits of smart-grid are clear. As noted previously, EPRI estimates
that smart-grid will help maintain electricity economically viable through 2050, with utility bills
increasing by 50% (versus the alternative of 400% without smart-grid) [3]. And in the more immediate future, McKinsey's 2010 report on smart-grid [7] estimates that a successful deployment of smart-grid could generate savings of $130 billion annually by the end of the decade.
Smart-grid development finds itself at the intersection of a technical, financial, and policy problem that is currently in gridlock. As it stands, development will continue to be organically driven and slow paced unless the enactment of strong federal policy defining market mechanisms and incentives comes to fruition alongside clearly outlined smart-grid standards and interface definitions.
1.3 Project Motivation and Goal
The justification for Monitoring & Diagnostics (M&D) schemes in the utility sector is well understood in the generation and transmission-high voltage (HV) space (Figure 1-3) where assets and equipment failure outage costs are valued in millions (USD). As such, equipment in this space (e.g., HV transformers) has had M&D solutions for over 10 years.
Transmission lines 765, 500, 345, 230, and 138 kV Color Key: Black: Generation Blue: Transmission Green: Distribution Generating Stationm Substation Step Down Transformer Ill Subtransmission Customer 26kV and 69kV Primary Customer 13kV and 4kV Secondary Customer Generating 138kV or 230kV | 120V and 24 Step Up ilu u Transformer
Source: U.S.-Canada Power System Outage Task Force, Final Report on the August 14, 2003, Blackout in the United States and Canada: Causes and Recommendations, April 2004. Figure 1-3: Electric Generation, Transmission, and Distribution Infrastructure
The underlying principle is for M&D to provide advance warning of impending failures and/or reduce problem diagnosis times in order to restore service as quickly as possible, and thus minimize the financial penalties to the utility incurred during an unplanned outage. This decreased likelihood of incurring outage penalties is the main driver for investment in M&D technologies.
Within the distribution medium voltage (MV) space (Figure 1-3), where equipment is valued in the thousands, geographic reach of disruptions is much more limited, and outage costs are significantly lower, the financial case to invest in M&D has been non-existent given the comparatively elevated costs associated with sensing equipment, telecommunications, data storage, and computing capability, versus cost of the asset protected.
This paradigm, however, is rapidly shifting given the advent of cost-effective and reliable telecommunications, and the drastic cost decrease of computing power and sensing technologies. The widespread and economical availability of these technologies is steering the MV space towards exploring M&D solutions in what is a smart-grid application that can help streamline O&M operations and alleviate the problems associated with an ageing distribution network and skilled workforce shortage.
This project explores sensor technology and analytics that enable M&D schemes for medium voltage circuit breakers (Fig. 1-4) and justifies the selected technology, system integration, and monitoring analytics from both a technical and financial standpoint. The project's hypothesis is that it is possible to develop cost-effective M&D schemes for MV circuit breakers and switchgear
equipment for the utility market.
D i S.Nannect CntFee e~a
b
Switch Trandnee PoG D ct-ankBus Transformer
Source Brown R Electric power distribution reliability, 2009
Figure 1-4: Typical Substation Components and Layout
Research for this project took place on site at ABB's Power Products Medium Voltage (PPMV) headquarters in the United States. Developed for, and included herein, is a customized M&D system for a fleet of reactor switching circuit breakers3 currently deployed at a customer site as part of a demonstration pilot. The documented design methodology and end results serve as a case study of M&D development for medium voltage circuit breakers.
The market opportunity for medium voltage circuit breaker M&D, a subset of the $8 billion USD benefit McKinsey sees in M&D [7], is significant as there are more than 60,000 distribution substations in the United States [8] averaging 2-3 MV circuit breakers each. Furthermore, many of these substations lack even the most basic SCADA capability4, and thus the operational impact smart-grid M&D applications is substantial [9].
1.4 Research Methodology
The project's evolution, findings, and implementation are part of the collaborative effort of a
small Accelerated Proof of Concept Team assembled to identify smart-grid opportunities in the
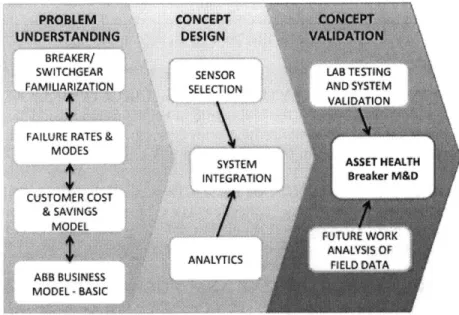
medium voltage space. As the project's objective is to ultimately develop an advanced circuit breaker M&D functional prototype, the development effort follows a simple product development flow consisting of the following gates (Figure 1-5):
Problem Understanding: This gate focuses on understanding essential medium voltage circuit breaker systems and operation, failure modes and reliability, and the equipment's associated costs when viewed from the customer's perspective.
Concept Design: With the objective of increasing equipment reliability and decreasing customer costs, research will evaluate the merit of distinct sensing technologies and propose an analytical framework for the down-selected sensors. The end task for this gate will be the integration of sensors, communications, data aggregation, and analytics.
Concept Validation: Lab testing will validate system design before piloting the advanced prototype at a customer location. This gate will also identify and document system design decisions dependent on field data analysis-future work and areas of research.
Figure 1-5: Medium Voltage Circuit Breaker M&D Research and Design Gates
4 PG&E, one of the most progressive utilities and the third largest in the United States, has a fleet of 724 distribution substations of which only 50% have SCADA capability.
1.5 Thesis Outline
The thesis proceeds as follows:
Chapter 1, SMART-GRID, WHAT IT IS AND ITS SIGNFICANCE introduces smart-grid in
the context of its technological and policy challenges, as well as potential economic benefits. Emphasis is drawn on the ageing infrastructure problem faced by electric utilities in the United States and the opportunities that exist for monitoring and diagnostics solutions. The chapter describes the project's motivation, goal, methodology, and this thesis outline.
Chapter 2, ABB NORTH AMERICA & SMART-GRID provides a brief historical background
on the company as well as its management and operating structure in North America. Additionally, it places the thesis project in the context of the company's recent smart-grid strategy.
Chapter 3, RELIABILITY OF MEDIUM VOLTAGE CIRCUIT BREAKERS gives an
overview of reliability for MV breakers in the U.S. by piecing together information available from the German MV distribution system, the U.S. Nuclear Generation sector, and the IEEE. The lack of information on equipment failure rates frames the discussion and justifies the work presented.
Chapter 4, MEDIUM VOLTAGE CIRCUIT BREAKER FAILURE MODES looks into the
leading equipment failure mechanisms. Here too, as with Ch. 3, a collage of information is the result of piecing together reports from the German MV distribution system, the U.S. Nuclear
Generation sector, CIGRE, and the IEEE.
Chapter 5, THE BUSINESS CASE FOR MV CIRCUIT BREAKER M&D presents the
business case for M&D applications for both circuit breaker manufacturers and their utility customers. For OEMs, a transition towards service models marks the need for M&D as a means to provide insight into customer equipment and market intelligence. For utilities, the justification is based on a simple Cost & Savings model that predicts significant savings when considering the
findings of Ch. 3 and Ch. 4.
Chapter 6, EXISTING M&D ANALYTICS FOR MV CIRCUIT BREAKERS gives an
overview of existing work in the space, the underlying principles behind magnetic coil profiling and interrupter thermal monitoring analytics, and utilizes this framework to justify the selected sensing technologies and overall system integration of the MV circuit breaker M&D kit.
Chapter 7, LABORATORY TESTING AND RESULTS presents the results utilized to design
the M&D analytics for a reactor switching application. The chapter describes the prior knowledge and information used to justify testing, presents the test objectives and logic behind the design of the experiment, and highlights key findings obtained from test results.
Chapter 8, REACTOR SWITCHING-M&D ANALYTICS DESIGN provides an overview
of the analytics developed for a pilot program currently deployed on six reactor-switching circuit breakers. The focus of the chapter is on the distinct levels of protection designed for monitoring mechanical operations.
Chapter 9, SUMMARY AND CONCLUSIONS provides an overview of the project and brings
2
ABB NORTH AMERICA & SMART-GRID
This chapter provides a general overview of the corporate structure of ABB with emphasis on its Medium Voltage operations in North America, and presents the key competitive and cultural challenges facing the company as it begins developing M&D solutions. The objective of the chapter is to provide a context of the operating environment surrounding the research conducted.
2.1 ABB Corporate Background
Headquartered in Zurich, Asea Brown Boveri, Ltd. (ABB) is formed in 1988 when ASEA AB (est. 1883) of Sweden and BBC Brown Boveri (est. 1891) of Switzerland combine their electrical engineering and equipment businesses.
Since its inception, the company has had a history of acquisitions that has allowed it to establish itself as one of the largest engineering conglomerates with operations in over 100 countries. In conjunction with its acquisition strategy, beginning in the 2000s, and with the objective of refocusing on core competencies, the company initiated a consolidation process (still ongoing) that began with the divestiture of its nuclear and conventional power generation businesses.
In 2006, after consolidating its remaining businesses into two areas, Power Technologies and
Automation Technologies, ABB restructured its operations into five divisions (Figure 2-2): Power Products, Power Systems, Automation Products, Process Automation, and Robotics. ABB's
acquisition and consolidation strategy continues to this day.
The company's strategy through 2015 is to continue the consolidation process of today's still highly decentralized conglomerate into a more centralized organization, meanwhile ensuring that a connection to country and regional customers, and market realities, remains strong. From a product development and portfolio offering the company's focus is to:
- Penetrate emerging markets.
- Develop industries expected to grow faster than world GDP (Figure 2-1). - Address mature market opportunities (e.g., infrastructure renovation). e Integrate Operational Technology (OT) and Information Technology (IT)
5 . - Continue M&A strategy to fill in gaps in product portfolio offering.
- Stimulate Disruptive Innovation: business models, products, and services.
In 2011, the company had sales of $37.99 billion (USD), a net income of $3.17 billion, assets of $39.65 billion, and a market value of $47.77 billion. ABB has close to 145,000 employees.
20%
0%
--- World GDP
---10 200
Market Size In 2010 ($bn)
Source: Overview ofABB's 2014 strategy, http://www.abb-betterworld.com/en/,
http://www02.abb.com/global/abbzh/abbzh259.nsf/0/c3098a1I79f5b83bdc 125793a00339e27/$file/ABB+CMD+1I+-+Joe+Hogan.pdf
Figure 2-1: ABB 2015 Strategy - 12 Growth Areas
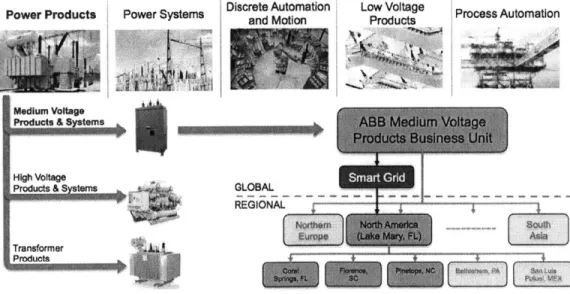
2.2 ABB North America Power Products Medium Voltage (PPMV)
The products that ABB offers the T&D market are the focus of its Power Products Division that is composed of three subdivisions (Figure 2-2): Transformer Products, High Voltage Products &
Systems, and Medium Voltage Products & Systems. Each sub organization is comprised of a
global office tasked with strategic decision-making and country/regional offices responsible for execution. Within both offices, the organization is matrix-structured into product lines (e.g., circuit breaker) and functions (e.g., marketing).
Power Products Power Systems Discrete Automationand Motion Low Voltage Products
~
AtmtoMedium Voltage
High Voltage
Products & stems
Transformer
GLOBAL REGIONA
1-Figure 2-2: ABB's Divisional Structure and North America PPMV Smart-Grid &
t _A A"
2.2.1 ABB PPMVNA Product Portfolio
In North America, ABB's Power Products Medium Voltage (PPMV) head office is located in Lake Mary (FL) and includes operations in Coral Springs (FL), Bethlehem (PA), Pinetops (NC), Florence (SC), San Luis Potosi, Mexico, Dorval (Quebec), Calgary (BC), and Brampton (Ontario). Its products offering (Figure 2-3) mainly serves the United States, Mexico, Canada and other Latin American countries that follow standards set forth by the American National
Standards Institute (ANSI).
earn, *0<
Indoor and outdoor
circuit breakers, reclosers, switch disconnectors, fuses, contaMors, instrument transformers and sensors
Air- and gas-insulated
switchgear, motor control centres and
ring main units for primary and secondary distribution Distribution Automation Protection, control, communication
products for power
distribution and integration with primary equipment Prefabricated modular solutions for power distribution in applications like distributed generation, marine, IT, heavy industries, oil &
gas.
Installation, commissioning,
spare parts,
retrofits, upgrading and more to extend the life of customer equipment
Source: ABB Medium Voltage Products, ABB.com,
http://www02.abb.com/global/abbzh/abbzh259.nsf/bfl77942fl 9f4a98c1257148003b7a~a/0614867da5026a7c12575080033 15d9/$FI LE/081120+JP+Morgan+Medium+voltage+Presentation.pdf
Figure 2-3: ABB PPMV Product Offering
2.2.2 ABB PPMVNA Utility Sales Channel The sales
dependent the utility operations
channels for PPMV NA's products to the utility sector are complex and highly on the unique relationship that ABB has with each utility customer. For the most part, sector maintains a predominantly product-direct business model with maintenance contracted out to third parties, or performed by the utilities themselves.
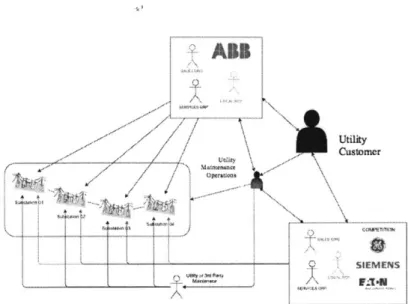
Although a simplification of the complex interactions involved in utility sales, Figure 2-4 depicts the main interactions between ABB's sales and engineering support teams with utility customers and ABB's competition, as well as third party service providers. Worth noting is the restricted access to utility substation equipment: this limits the information available regarding equipment reliability, hinders marketing intelligence, and explains the need for close ties between ABB field personnel and utility customers.
Figure 2-4: ABB, Competition, and Utility Customer Simplified Interaction Diagram
2.2.3 ABB PPMVNA R&D and Product Design Capabilities
ABB's PPMV NA Division leverages both local and international R&D capabilities to meet the company's product development needs in the ANSI market. These R&D resources are capable of developing custom products and/or adapting existing technologies to meet market needs.
From a smart-grid perspective, ABB has invested heavily in a Smart Grid Center ofExcellence to develop and showcase end-end solutions intended for the ANSI market. The intention is to provide ABB rapid product design capability, leverage technology developed in the U.S. and Europe, and address the rapid and uncertain U.S. and Global smart-grid market.
On the M&A front, ABB closed three important deals that fill gaps in IT, telecommunications technology, as well as the company's market presence in the medium/low voltage space:
e Ventyx - is a software provider to asset-intensive businesses (e.g., electric utilities) offering
asset and workforce management solution (acquired 2010).
e Tropos Networks - is a smart-grid communications technology company (acquired 2012). e Thomas and Betts - is a medium/low voltage electrical component manufacturing company
focused on cables, connectors, and other distribution related products (acquired 2012).
2.3 ABB North America's Smart-Grid Efforts
The capability for ABB to develop tailored products for the U.S. smart-grid market is critical as Europe and the United States have distinct smart-grid deployment priorities6. An example of this is Europe's current focus on renewable integration architectures, whereas the United States has focused on Conservation Voltage Reduction (CVR) and Fault Detection Isolation and Restoration
(FDIR) technologies [10].
This strategy falls in line with the efforts of ABB's main competitors (i.e., GE, Schneider Electric) who themselves have created dedicated centers in the U.S. and/or Canada and are actively involved in policy and discussions for the elaboration of standards.
The challenge for ABB is to develop a consistent product offering across its three Power Product subdivisions (Figure 2-2). The integration of ABB's legacy products with its recently acquired telecommunications and IT capabilities (Tropos Networks, Ventyx) will require strong coordination and governance across organizational boundaries.
As a mitigating factor to the systems integration challenge described above, ABB PPMV NA put in place a small Accelerated Proof of Concept and Product Development Team tasked with identifying market opportunities and fast development projects. The team's objective was to develop advanced working prototypes aimed at validating market requirements, evaluating market potential, and providing demonstration/learning platforms for future detailed design engineering, R&D, and market research.
Justification for an Accelerated Proof of Concept Team is that of disruptive innovation and stems from the positive-and documented-results obtained when carefully selected teams are allowed to operate with flexibility and free of large overhead activities [II]. It is in the context of this
Accelerated Proof of Concept Team that the advanced circuit breaker M&D functional prototype,
3
RELIABILITY OF MEDIUM VOLTAGE CIRCUIT BREAKERS
Chapter 3 starts with a brief history on circuit breaker technology and follows with an overview of failure rates observed in equipment utilized in the MV space. Reliability information is an essential component when determining the financial viability of any M&D effort.
3.1 Circuit Breaker Technology and Operation Basics
Circuit breakers exist for distinct current and voltage ratings spanning the entire low-high voltage spectrum. The operating principle of a circuit breaker is no different from a residential light switch as its design allows for switching capability; its main objective however is to provide critical protection from overload or short circuit failures by interrupting fault currents within milliseconds.
Fault detection and switching control of circuit breakers is typically performed by an automatic relay system capable of detecting the abovementioned fault conditions. Relay systems typically reside in the equipment's low voltage compartment and are electrically isolated from the circuit breaker's protected circuit in order to enhance overall system safety and reliability. Present day relay systems found in utility and industrial settings also have the ability of receiving remote switching instructions-this gives operators enhanced grid control and coordination ability. During the interruption of current in any switch-like device, as the device's contacts begin to separate, an electric plasma arc will form between the two electrodes (Figure 3-1). The means utilized to control the quenching of the arc are critical in circuit breaker engineering and grow in complexity as the intended design rating of the equipment increases (i.e., higher voltage and/or current).
Fixed Moving
Contact Arc Contact
I
-~/
Figure 3-1: Arc Formation during Separation of Live Electric Contacts
Alongside the current and voltage ratings, the technology (or medium) utilized to extinguish the
plasma arc is also a circuit breaker classification criterion. During the first half of the twentieth
century, in the mid-high voltage realm (4 kV and above), circuit breakers relied on oil-filled tanks as a quenching medium. This technology, however, was prone to fires, and the need for alternatives was clear.
By the 1940s, the use of compressed air as a means to "blow out" the arc was an attractive substitute to oil-filled tanks. By the 1960s, the use of inert gas-sulfur hexafluoride (SF)-became extremely popular given it lacked the need for external compression machinery and was less expensive to operate. In the mid 1970s, the vacuum circuit breaker appears on stage and quickly becomes the technology of choice for the MV space (4 kV-35 kV).
In vacuum circuit breakers, as the live electric contacts separate, the metal electrodes begin to evaporate and it is this metal vapor that provides the medium for arc formation. Through careful design of the vacuum chamber, the arc extinguishes when the vaporized metal re-condenses on the electrodes and walls of the interruption chamber [12].
From an operations standpoint, vacuum interrupter technology offers higher reliability and requires significantly less maintenance than its compressed air and SF6 counterparts. As a rule,
vacuum circuit breakers should be inspected at least once a year or every 2000 operations, whichever occurs earlier [13].
The research presented in this paper focuses, for the most part, on vacuum circuit breakers. The general approach, however, is easily extendable to SF6 breakers and other protection equipment.
3.2 Medium Voltage Circuit Breaker Reliability
-
Industry Guidelines
Circuit breaker failures happen whenever the equipment fails to achieve its commanded state (i.e., open or closed), or transitions occur outside the timing specifications required to avoid damaging
interconnected assets (e.g., transformers) and the circuit breaker itself.
Although it might come as a surprise, the medium voltage space for circuit breakers and other apparatus lacks detailed information that would allow for a serious, present day, analysis of circuit breaker or apparatus reliability. In the case of the United States, the vast the number of utilities providing service, coupled with a regulatory and political environment that stifles information sharing, are partly to blame for the imperfect, incomplete, and outdated reliability MV datasets.
This shortcoming in information is recognized, and entities such as the IEEE have conducted countrywide surveys and data collection efforts in order to gain a better understanding on equipment reliability and failure modes. Far from perfect, the results from these efforts are published in the IEEE's 493 report [14] in what has come to be regarded as a standard resource across the industry.
Last published in 2007, the IEEE's 493 report sheds valuable information that has been an adequate proxy in distribution planning. However, the same is not true in the context of smart-grid M&D applications:
- Reliability numbers are based on data collected from 1971-1991.
- Failure mode information dates from surveys conducted in 1974 and 1985. - Dynamic database for further interrogation does not exist-only printed format. e High uncertainty given data sampling limitations and distinct operational realities. e Information fails to capture impact of ageing infrastructure.
The latest reliability information for MV circuit breakers printed in the IEEE's 493 report shows an expected yearly failure rate of 3.3%. This value, although on the high end, is partially in agreement with other published guidelines, which place substation circuit breaker failure rates anywhere from a 0.1-3.0% range-these values, though, are offered as "rules of thumb" [15].
3.3 The Impact of Ageing on Reliability
3.3.1 The German Experience
Although there are many differences between the electric grids of the U.S. and Germany7
, both nations have a high penetration of vacuum and SF6 circuit breakers, and both share the same
underlying operation principles requiring rapid equipment functioning as a means of minimizing network damage. While an apples-to-apples comparison of the equipment in both countries is not possible, Germany's experience with ageing assets provides insight into what could happen in the United States.
Results from a study performed under contract from the National Research Council of Germany found that 36% of all failures verified in medium voltage substations were due to circuit breaker misoperation, and 90% of these were due to material fatigue (cyclic load) ageing [16].
The study, with data provided by Research Institute for Electric System and Power Economy (Manheim, DE), sheds light on the drastic failure rate increase that circuit breakers observed as the equipment reached the 25-year age mark. Likewise, similar trends are observable in other MV electrical equipment included in the study (Fig. 3-2).
SX JW 1 . C o n d u c to r
T ra ns fo rm e r
year 2. Cable 4, Breaker!
Source: © 2007 IEEE. Reprinted, with permission, from Zhang, X. (et al.), Estimation of the Lifetime of the
Electrical Components in Dist. Networks, IEEE Transactions on Power Delivery, Vol. 22, No 1, Jan 2007
Figure 3-2: Lifetime Estimation of German MV Electrical Components
7 Examples: Europe's network is underground and follows International Electromechanical Commission (IEC) protection standards versus the U.S. that is mostly above ground and follows ANSI guidelines.
Electrical Equipment Failure Probability -- -- - -- --- --- - 4
3.3.2 Insights from the U.S. Nuclear Generation Sector
Analogous to the German and U.S. comparison, the Nuclear Generation sector in the United States also offers valuable insight into what could be in store for the U.S. MV circuit breaker fleet from a reliability perspective.
The Nuclear Regulatory Commission (NRC), after analyzing MV circuit breaker failure reports spanning from 1980 through 2000, found that 62% of partial failures spotted during routine maintenance where due to mechanical degradation (ageing breakdown). The data for the 4.16-6.9 kV circuit breaker fleet also found evidence that lubrication and dirt were the two leading equipment deterioration catalysts [17].
The NRC report provides some history on how analysis of this data led to a revision of maintenance operation practices after a spike in reported failure events was recorded in 1983 (Figure 3-3). The data available at the time allowed the Nuclear Generation sector to identify ageing as the main culprit behind the failure increase, and facilitated the design of improved testing and inspection practices that visibly decreased the number of recorded failures over the next 15 years. 01$ 0S U 0 0.18 U
x
U *1 U *lI
.2 C U t~ 0.05 0U
Observed Fltbd Trend*0 4 00g % Lower Sound 0 -WW 95% Upper Bouund
Industry Maintenance Procedures
Z
Revised & Improved
so s 82 as8 se aS. as.
Calendar Year
at es .4 .s .I .7 . . 20
Source: T. E., Rasmuson (et al.), Common-Cause Failure Event Insights Circuit Breakers, 2003 Figure 3-3: MV CB Failure Events with Fitted Trend and 90% Confidence Band
The sector's timely response, and the impact of the revised maintenance practices, would have been more difficult to achieve had the industry not had rigorous data collection and documentation practices. These results, although primitive and not based on real-time data, provide insight into the impact that M&D applications can have on reliability.
3.4 MV Circuit Breaker Survivability Simulation
A simple numerical simulation, understanding that reliability information for MV circuit breakers is imprecise, provides a means of testing distinct failure rate scenarios in order to better understand potential implications to a utility.
Based on available substation distribution circuit breaker survivability curves for 5 major U.S utilities [15], the simulation's objective is to attain a reasonable approximation of the general equipment survivability trajectories observed in Figure 3-4.
&-a .. ka 100% 90% 80% 70% 40% 30% 20% 10% 0% 0 10 20 30 40 50 60
Age of Substation Circuit Breakers
70 80
Source: Brown, R., Electric power distribution reliability, 2009
Figure 3-4: MV Circuit Breaker Survivability Curves for Five Large U.S. Utilities
3.4.1 Survivability Simulation Inputs
The main inputs to the model are: a yearly MV breaker fleet growth (% units installed), and a
bathtub failure rate model. A description of the model's variables as coded in Matlab (in parenthesis) follows. Reader can reference the Matlab code in Appendix A- 10.1.
i) Fleet Growth Over Time (growth)
This parameter represents the average yearly growth observed in the MV circuit breaker fleet across all utility sites.
This parameter is set to a value of 0.01 based on the fact that installed capacity grew, in the United States, at an average pace of 1.0% annually from 1950 through 2012 [18]-the model assumes that circuit breaker population growth scales with the system's installed capacity8.
Nearly identical system capacity growth rates are reported by EPRI between 1988-2008 [19].
Figure 3-5 depicts U.S. growth observed for both electricity demand and electric generation capacity in the past 60 years. The disproportionate level of investment, when compared to growth in the system, is partly responsible for the advanced age of distribution assets.
8.00
6.00
-4.00
1950 1960 1970 1980 1990 20O0 2010
moneman~d asCapacity
Source: DOB/EIA, Annual Energy Outlook 2012: With Projections to 2035, 2012. Figure 3-5: Growth Imbalance between Demand and System Capacity 1950-2012
ii) Bathtup Failure Rate Model Parameters
The variables below are utilized to describe the bathtub failure model used by the simulation. Figure 3-6 provides guidance on the meaning of each variable.
- Infant Mortality Yearly Failure Rate (failRateZero) - Typical Failure Yearly Rate (baseFailRate)
e Failure Rate Yearly Increase (failRateAdj) e Failure Rate Increase Year (failShift)
0.075 0.0? 0.05 0,05 0.0s0 b.04 OM05 2 0 0 40 50 50 70 year
Figure 3-6: Survivability Simulation Bathtub Failure Rate Model
-... . erUiiu:rtc. sta~bilizes - imulatiop artif ce
Infani lorait
ailuelue te Yeaily incras es
verifi ed --A geng Effect
Failpre Rate lncrease Year is the - ... FT -etR.a 'niu n o) Aeng