The MIT Faculty has made this article openly available. Please share how this access benefits you. Your story matters.
Citation Brakewood, Candace, Francisca Rojas, Christopher Zegras, Kari Watkins, and Joshua Robin. “An Analysis of Commuter Rail Real-Time Information in Boston.” JPT 18, no. 1 (March 2015): 1–20.
As Published http://dx.doi.org/10.5038/2375-0901.18.1.1
Publisher University of South Florida
Version Author's final manuscript
Citable link http://hdl.handle.net/1721.1/99964
Terms of Use Creative Commons Attribution-Noncommercial-Share Alike
AN ANALYSIS OF COMMUTER RAIL REAL-TIME INFORMATION
IN BOSTON
Dr. Candace Brakewood (Corresponding Author), Assistant Professor
The City College of New York, 160 Convent Ave, Room 122, New York, NY 10031
Phone: (212)-650-5217, Email: [email protected]
Dr. Francisca Rojas, Urban Development Specialist, Inter-American Development Bank
Calle Esmeralda 130, Piso 19, Ciudad Autónoma de Buenos Aires, Argentina, 1035
Phone: (54-11) 4320-1843, Email: [email protected]
Dr. P. Christopher Zegras, Associate Professor, Massachusetts Institute of Technology
77 Massachusetts Avenue, Room 10-403, Cambridge MA 02139
Phone: (617)-452-2433, Email: [email protected]
Dr. Kari Watkins, Assistant Professor, Georgia Institute of Technology
School of Civil and Environmental Engineering, 790 Atlantic Drive, Atlanta, GA 30332
Phone: (206)-250-4415, Email: [email protected]
Joshua Robin, Vice President of Strategy and Development, Masabi LLC
12 Desbrosses Street. New York, NY 10013
AN ANALYSIS OF COMMUTER RAIL REAL-TIME INFORMATION
IN BOSTON
Prior studies have assessed the impacts of real-time information (RTI) provided to bus
and heavy rail riders but not commuter rail passengers. The objective of this research is to
investigate the benefits of providing commuter rail RTI. The method is a three part statistical
analysis using data from an on-board survey on two commuter rail lines in the Boston region.
The first analysis assesses overarching adoption, and the results show that one third of commuter
rail riders use RTI. The second part conducts difference of means tests and regression analysis
on passenger wait times, which reveals that riders’ use of RTI is correlated with a decrease in
self-reported “usual” wait times. The third part analyzes twelve quality of service indicators,
which have limited relationship with RTI utilization. The results suggest that the benefits of
commuter rail RTI are modest. Despite this, many commuter rail riders choose to use this new
information source, which has important implications for transit managers considering deploying
Introduction
Public transit providers often struggle with service reliability issues; when a transit
vehicle does not arrive on time, passengers become frustrated and may be less likely to choose
transit for future trips. Reliability can be improved in many ways, including improving rights of
way, using service planning approaches, or implementing control strategies. While these
supply-side strategies can be effective at improving reliability, they often come at a substantial cost.
As another way to address reliability concerns, transit agencies in the United States
increasingly provide real-time vehicle location and/or arrival information (RTI) to riders.
Providing RTI helps passengers adapt to the unreliability of transit service (Carrel et al., 2013).
Moreover, RTI can be provided to passengers in an increasingly cost-effective manner. Over the
past decade, the provision of RTI to passengers via web-enabled and/or mobile devices has
become ubiquitous in urban bus and rail systems (Schweiger 2011; Rojas 2012).
This trend has spurred commuter rail operators to consider providing riders with similar
levels of digital, dynamic transit information. Recently, some of the largest commuter rail
providers in the United States (APTA 2012) have begun to offer RTI to passengers. Both the
Long Island Railroad and Metro North Railroad in the New York region provide real-time train
location information on a website known as “Train Time” (MTA 2013a; MTA 2013b).
Similarly, New Jersey Transit provides information through its “Departure Vision” real-time
train status service (New Jersey Transit 2013) and in the Chicago region, Metra offers real-time
train tracking on its website (Metra 2013).
In Boston, the Massachusetts Bay Transportation Authority (MBTA) has taken a different
approach to commuter rail RTI. Instead of developing their own RTI platform, they released
third-party RTI applications on many different digital platforms, including websites and
smartphone applications. Since commuter rail operators increasingly offer RTI options to
passengers, this research aims to assess how riders may benefit from this information.
Prior Research
While the delivery of RTI has been possible for decades, until recently, such information
tended to be delivered via electronic signs at stations, if at all. Two inter-related phenomena in
the USA have begun to change this fixed-infrastructure, centrally-provided information model: the “open data” movement and the rapid adoption of the “smartphone.” The results are
increasingly available transit information in a variety of formats for connected devices
(Schweiger 2011).
In light of this trend, a growing body of literature has begun to assess the benefits of
providing RTI to transit riders via web-enabled and/or mobile devices. This brief literature
review focuses on prior research that utilizes actual behavioral data to understand rider benefits,
since this will most likely provide more concrete conclusions needed to inform decision-makers.
Prior studies that use stated preference methods (e.g., Tang and Thakuriah 2010) or simulation
techniques (e.g., Cats et al. 2011; Fries et al. 2011, Fonzone and Schmöcker 2014) to evaluate
the potential impacts of RTI on passenger behavior are not included in this review. Following
the framework of a prior RTI study in Tampa, Florida (Brakewood, Barbeau and Watkins 2014),
this literature review divides potential rider benefits of RTI into three key areas: (1) decreased
Decreased Wait Times
RTI enables a rider to “time” her arrival at the stop/station to minimize her wait time.
Using RTI improves the passenger’s awareness of the estimated actual arrival time of the vehicle
at the stop/station, thus allowing her to more precisely time her arrival at the station and reduce
wait time. Additionally, RTI may reduce a passenger’s perception of waiting time once she has
reached a stop/station because she is getting real-time updates of when the vehicle should arrive.
A recent study conducted in Seattle, Washington found that bus riders with RTI
perceived wait times at the bus stop to be approximately 30% less than those who did not use
RTI, and the actual wait times of RTI users were almost two minutes less than the wait times of
non-users (Watkins et al. 2011). Another study of bus riders in Tampa, Florida found significant
improvements in the “waiting experience” associated with use of mobile RTI, including
reductions in self-reported wait times and decreases in levels of anxiety and frustration while
waiting for the bus (Brakewood, Barbeau and Watkins 2014).
Increased Satisfaction
If a transit passenger spends less time waiting and/or perceives waiting time to be less,
she may become more satisfied with overall transit service. A panel study conducted of the
shuttle bus system on the University of Maryland campus showed increased satisfaction with
transit service attributable to RTI (Zhang et al. 2008). Additionally, the results of two surveys of
bus riders in Seattle who use mobile RTI revealed increased satisfaction with overall bus service
Increased Ridership
If passengers spend less time waiting and/or are more satisfied with transit service, then
RTI may increase the frequency of transit trips by existing passengers or potentially attract
completely new riders to transit. In Chicago, a longitudinal analysis of bus ridership over a nine
year period found a modest increase in route-level ridership attributable to the provision of bus
RTI (Tang and Thakuriah 2012). A follow-up study in Chicago found a small increase in train
ridership over a six year period attributable to the provision of bus RTI, possibly due to increased
intermodal transfer efficiency between trains and buses (Tang et al. 2013).
Summary
This review of studies grounded in behavioral data reveals three key rider benefits of
RTI: (1) decreased wait times, (2) increased satisfaction with transit service, and (3) increased
ridership. However, these benefits were identified based primarily on studies of bus and urban
rail systems, leaving at least one transit mode understudied: commuter rail. Commuter rail may
be understudied for numerous reasons. First, bus and heavy rail systems carry the majority of
public transit trips in the United States (APTA 2012); therefore, these systems may be studied
more frequently simply because they are more heavily used. In addition, commuter rail systems
generally operate at longer headways and run on dedicated right-of-way, whereas urban bus
systems often have shorter headways and operate in mixed traffic. Because of differences in
frequency and reliability of service, the value of using RTI on urban bus systems may be
different (likely greater) than for commuter rail systems, which may be why it has been studied
first. Regardless, by focusing on a mode that has been largely excluded from previous research,
Objectives
The overall objective of this research is to explore the utilization and passenger benefits
of RTI provided to commuter rail riders through web-enabled and/or mobile devices. Three
specific objectives are set forth, which focus on measures of RTI use and benefits in the short
term. First, the overall levels of adoption and rates of utilization of commuter rail RTI are
explored. Second, prior research indicates that reductions in passenger wait times are an
important benefit of RTI in other modes of transit. Subsequently, this study aims to determine if
there are decreases in wait times associated with using commuter rail RTI. Third, the literature
review revealed that increases in satisfaction with transit service are another possible benefit of
RTI systems. Therefore, this study aims to assess if there are increases in quality of service
ratings associated with using RTI. Last, it should be noted that the literature review suggested
that increased ridership is a benefit of RTI; such analyses, however, require longitudinal analysis
and are left for future research in the commuter rail case.
Background
Commuter rail service in Greater Boston includes fixed schedule, daily service on twelve
heavy rail lines serving downtown Boston via two central city stations (North Station and South
Station). Boston has the fifth largest commuter rail ridership in the United States based on the
number of unlinked passenger trips (APTA 2012). The service is operated by the Massachusetts
Bay Commuter Rail Company (MBCR) under contract with the Massachusetts Bay
Transportation Authority (MBTA).
Three basic categories of information sources are available to commuter rail riders in
information consists of schedules and maps, generally updated on a quarterly or annual basis and available online at the MBTA’s website, through other websites (such as Google Transit, a free
trip planner available worldwide), in printed form, and on signs at stations. Service alerts, known as “T-alerts” in Boston, include emails and text messages that report major delays (more
than 15 minutes) to subscribers. Riders can sign up for mode- and line-specific alerts, which are
automatically pushed to their mobile phone or email account in the event of a delay (MBTA
2013). Service notifications are also posted on the MBTA’s website. Real-time information
(RTI) refers to up-to-the-minute tracking of transit vehicle locations and often includes predicted arrival times for stops/stations. RTI is distinguished from service alerts because the latter are
incident-based information “pushed” to the user, while the former are user-initiated inquiries to
the system. RTI has increasingly become available to riders “on-the-go” due to the advent and
widespread adoption of smartphones and smartphone-based applications (“apps”) and the “open data” movement.
In the USA, the MBTA was an “early adopter” in the movement towards public
disclosure of real-time data (Rojas 2012), gradually releasing real-time data to the public for
each transit mode as part of the Massachusetts Department of Transportation’s open data
initiative (MassDOT 2013) (Figure 1). In 2009, the MBTA released a real-time data feed for
five “pilot” bus routes that included vehicle location and arrival information. In response to
public demand, real-time data were released for all approximately 200 MBTA-operated bus
routes in the summer of 2010. Shortly thereafter, the MBTA began publishing real-time data for
the heavy rail lines (excluding the light rail Green Line). In June 2011, the MBTA added
commuter rail to its real-time data initiative as a beta feed, which utilized a GPS-based tracking
the open release of data to third-party developers, LED signs at some commuter rail stations gave
riders real-time updates by displaying “train approaching” messages.
Figure 1 Timeline of Transit Data Release in Boston
Similar to other transit agencies, the MBTA makes available on its website the
independently developed applications (without endorsement) that draw from the real-time data
feeds. On the MBTA’s webpage, over 80 different web and mobile applications created by third
party software developers are showcased (as of 2014), and many of them integrate commuter rail
data (MBTA 2014). Despite the great variety of transit information applications now available,
little evidence exists on how many riders in Boston actually use RTI or how they access it, partly
because the applications come from third parties instead of the MBTA. Therefore, this research
aims to provide a more concrete understanding of RTI utilization on Boston’s commuter rail
system.
Data Collection
Data for this analysis were collected via a short paper survey administered in June 2012.
An on-board sampling method was selected to most easily reach the target population (commuter
rail riders). This study does not explicitly attempt to detect potential modal shifts (e.g., from car
to commuter rail), since the data collection was conducted only one year after the debut of the
F A L L 2009 Real-time location & predicted arrival data released for 5 MBTA bus routes (pilot program)
SU
MM
E
R
2010 Real-time location & predicted arrival data released for all ~200 MBTA operated bus routes F A L L 2010 Real-time location & predicted arrival data released for the Red, Orange and Blue subway lines JU N E 2011 Real-time location & predicted arrival data released for all Commuter Rail lines
commuter rail RTI feed. Furthermore, capturing non-users of commuter rail would have
required a sampling strategy well beyond the resources available.
The on-board survey was conducted on three weekdays in mid-June during the morning
and evening peak periods (between 6:30-10am and 4-7:30pm). Because ridership on the
commuter rail is highly peaked in the commuting direction (inbound in the morning, outbound in
the evening), the off-peak direction (outbound in the morning, inbound in the evening) was also
sampled so both peak and off-peak riders could be included in the analysis. Riders were sampled
on twelve train trips: six outbound and six inbound. Once on board the trains, teams of two to
three researchers distributed paper surveys to as many riders as possible and collected them
before riders alighted.
Line Selection
All twelve commuter rail lines could not be sampled due to resource constraints. Instead,
two lines were selected – the Worcester and the Newburyport/Rockport lines – based on four
factors: geography, ridership levels, ridership demographics, and service reliability. Geography
was defined based on the terminal stations in downtown Boston. As two large terminal stations
serve different geographic regions in the metropolitan area, one line from each was selected to
better represent the entire network. The Newburyport/Rockport line terminates at North Station,
and the Worcester line ends at South Station. Second, only high ridership lines were considered,
to increase the number of survey responses. The selected lines have average weekday boardings
of approximately 17,000 to 18,000 and are among the highest ridership levels within the overall
commuter rail network (MBTA 2010). Third, based on previous survey results, diversity in rider
adoption, and subsequently, utilization of RTI. The Worcester line has relatively high levels of
demographic diversity, whereas the Newburyport/Rockport line has a more homogenous,
high-income ridership (CTPS 2010). Finally, the two lines differ in levels of service reliability, as defined by the MBTA’s on-time performance metric. Monthly data for June 2012 shows that the
Worcester line was on time for 91% of trips, above the commuter rail system average of 89%,
whereas the Newburyport and Rockport branches had on-time performance measures of only
70% and 61%, respectively (MBTA 2012).
Data Collection Constraints
Although standard survey research procedures were followed, data collection faced
constraints. First, no survey mail-back option existed. Riders were instructed to complete as
many questions on the survey as possible during their commute, leaving surveys incomplete
because the rider alighted the train prior to completion. Additionally, since the survey was only
administered in English, a very small number of riders (less than 10) declined participation
because they did not speak English. Last, due to the constraints of conducting an on-board
survey in rail cars (which were often crowded), the rate at which riders accepted or declined
participation was not measured.
Survey Content
The survey instrument included questions about the awareness and use of commuter rail,
subway, and bus RTI; two questions about wait times; and twelve quality of service indicators.
Travel behavior questions about frequency of ridership, trip destination, and boarding and
account for relevant influencing factors. The survey also contained questions about ticketing,
which were used in a mobile ticketing analysis (Brakewood et al. 2014). A copy of the
questionnaire is available online (Brakewood 2014).
Responses
A total of 914 responses were collected during the fieldwork period, with 903 deemed
sufficiently complete for the following analysis. Sufficient completeness means that the
respondent answered questions up to the halfway point on the questionnaire, where the use of
commuter rail RTI question was posed. The survey responses from both lines were pooled and
used to conduct the following analyses.
Results
Three analyses were conducted to explore the impacts of RTI on commuter rail
passengers. The first analysis assessed overall adoption and utilization of RTI by commuter rail
riders. The second analysis aimed to understand if decreases in wait times are associated with
using commuter rail RTI. The third analysis examined if increases in perceived quality of
service are associated with using RTI.
Analysis 1: Awareness and Utilization of RTI
This analysis assesses three different aspects of RTI utilization by commuter rail riders:
awareness and adoption of RTI for the three primary MBTA modes (commuter rail, bus, and
subway); the interfaces used to access commuter rail RTI; and, finally, the reasons riders do not
Awareness and Utilization of RTI
Survey respondents were provided with a brief description of RTI, and subsequently
asked if they were aware of RTI for commuter rail, MBTA buses, and MBTA subway trains.
Figure 2 shows that 54% of respondents were not aware of commuter rail RTI, 63% had not
heard of subway RTI, and 66% were not aware of bus RTI. Prior to the survey, commuter rail
RTI had not been formally marketed by the MBTA or MBCR, likely contributing to the fact that
over half of surveyed riders were not aware of commuter rail RTI. For those who were aware of
commuter rail RTI, this was likely due to word of mouth, press coverage, and marketing
conducted by independent software developers (such as through social media).
The survey also asked commuter rail riders how frequently they used RTI for each
MBTA mode. Figure 2 shows that 33% of riders used commuter rail RTI either on every ride
(always = 1%), on most rides (often = 4%) or on a few rides (sometimes = 28%). However, 13%
of surveyed riders were aware of commuter rail RTI but had not used it, and, as previously
stated, 54% were not aware of commuter rail RTI. Figure 2 also shows that 19% of commuter
rail riders had used subway RTI (total of “always,” “often” and “sometimes”), and only 15%
used bus RTI (total of “always,” “often” and “sometimes”). A large amount of overlap exists
between riders who used commuter rail, bus, and subway RTI: 46% of riders who used
commuter rail RTI also used either bus, subway, or both bus and subway RTI. This overlap may
be attributable to RTI applications that integrate all three modes. At the time of the survey (in
2012), there were 44 third party applications listed on the MBTA’s “App Showcase” website,
many of which integrated commuter rail RTI with others modes (Rojas 2012). Additionally, bus
and subway data were released prior to the commuter rail data (as shown in Figure 1), and
commuter rail RTI. Note that the on-board survey only sampled commuter rail riders; the
utilization of bus and subway RTI would likely be much higher if passengers on subway trains
and buses were also sampled.
Last, only 5.5% of survey respondents reported having used commuter rail RTI prior to
boarding the train on the day of the survey.
Figure 2 Awareness and Utilization of RTI by Commuter Rail Riders
Interfaces to Access RTI and Reasons for Not Using RTI
Respondents could select all technologies that they had used to access commuter rail RTI,
and they most commonly used a desktop or laptop computer (51%) (Figure 3). This may be
because riders were often traveling to/from work and may have checked the real-time status of
their train before leaving their office. The second most common method was through
smartphone applications (36%). 1% 3% 4% 4% 4% 28% 15% 8% 13% 17% 20% 54% 63% 66% Commuter Rail RTI (n=891)
Subway RTI (n=875)
Subway RTI (n=875)
Use it always (every ride) Use it often (most rides) Use it sometimes (a few rides) Aware but never use it Not aware of RTI
Figure 3 How Riders Access Commuter Rail RTI (n=334)
Riders who were aware of commuter rail RTI but stated that they “never” use it were
asked why. The most common reason (38%) for not using commuter rail RTI was “I don’t have a smartphone” (Figure 4). Note that all respondents were asked which types of information and
communication technologies they had used in the past 30 days, and smartphones had utilization
rates of 76% of all respondents, a higher rate than the national average (46%) of smartphone
owners at the time of the survey (Pew Research Internet Project 2012).
Another common reason for not using commuter rail RTI was “other.” This response had
a write-in section, and the most frequent theme of write-in comments was that commuter rail RTI
was not needed. Some examples of write-in responses include “haven’t needed to,” “don’t see the need to,” “not valuable info”, and “doesn’t matter.” These reasons may stem from the nature
of commuter rail service, traditionally a fixed schedule service operating at low frequencies.
Commuter rail riders traditionally consult the schedule pre-trip, and riders may continue to be
reliant on static schedule information for reasons of habit or simplicity. Additionally, some
survey respondents noted the lack of other transportation alternatives in the event of a delay.
Since the commuter rail network services many outlying suburbs without other transit options,
riders may not have alternative means of getting to their destination if there is a delay in service. 51% 36% 32% 22% 9% Desktop or Laptop Smartphone "apps" Mobile web Cell phone with SMS/text Tablet
Finally, 21% of riders who do not use commuter rail RTI selected the response that “it is not accurate.” Unfortunately, the accuracy of RTI was not monitored during the study period.
Figure 4 Reasons Why Riders Do Not Use Commuter Rail RTI (n=144)
Analysis 2: Wait Times
Next, passenger wait times were analyzed because prior research indicated that
reductions in wait times are a key benefit of RTI systems. RTI enables a rider to “time” her
arrival at the stop/station to minimize her wait time. This is particularly important when the
vehicle deviates from the posted schedule because a passenger can then adjust her behavior to
reduce wait time by leaving her origin (e.g., home) earlier or later than she would have if she had
simply consulted the schedule. The relationships between RTI use and passenger wait times are
tested using difference of means tests and regression analysis.
Wait Time on the Survey Day
The first analysis compared wait times on the day of the survey for passengers who used
commuter rail RTI before boarding the train and passengers who did not. Passengers were
divided into groups based on their response to the following question: Before boarding the train 38% 38% 21% 6% 4% 4% I don't have a smartphone
Other It is not accurate Did not work when I tried it It requires too many steps It is confusing or complicated
today, did you use real-time commuter rail information on a phone or the web? [Yes/No]. Wait times came from responses to the following question: How long did you wait at the commuter
rail station today? [Write number, e.g., 7 minutes].
We hypothesized that RTI use on the day of the survey would be correlated with lower
reported wait times because studies of other transit modes have found that passengers wait less
with the real-time knowledge of train arrival times and/or they perceive the waiting time to be
lower due to the reduced uncertainty about train arrival times. Table 1 shows that the data do not
support this hypothesis, since there is no statistically significant difference in reported wait times
on the day of the survey (p=0.2557).
Table 1 Difference of Means Test for Wait Time Today
Wait Time Today
Group Observations Mean (minutes) Std. Dev.
Used Real-Time Information Today 48 6.43 4.77
Did Not Use Real-Time Today 839 6.91 7.10
Total 887 6.88 7.00
t = -0.6606, P(T<=t) = 0.2557 (one-tail)
Two notes should be made about this analysis. One important variable affecting
passenger wait times is the reliability of the trains on the day the survey was administered;
therefore, the teams distributing surveys were instructed to note any delays in service. None of
the train trips for which the on-board survey was conducted experienced delays. Subsequently,
passengers who consulted RTI before boarding would have seen the same information as
passengers who consulted traditional information sources (i.e. schedules). Second, there were a
few outlier responses to the wait time question (three respondents said 60 minutes and one stated
generally operate at headways less than one hour during the time period when data were
collected.
Finally, we specified and estimated an ordinary least squares regression to model wait
time on the day of the survey as a function of many variables, including mode used to access the
station, line (Worcester, Newburyport/Rockport), time and direction of travel, destination, time
sensitivity of the trip (can/cannot be late), use of wait time for other activities (reading/listening
to music), frequency of travel on that commuter rail line, use of other information sources
(schedules, T-alerts, posted schedules, LED signs), and socioeconomic characteristics of the
respondent (gender, age, ethnicity, household income, and household car ownership). The
results confirm the previous finding of no statistically significant difference in self-reported wait
times on the day of the survey attributable to use of commuter rail RTI. Subsequently, this
model is not shown for presentation.
Usual Wait Time
The second analysis compared the “usual” wait times of passengers who have used
commuter rail RTI to the usual wait times of passengers who have not. Passengers were divided
into two groups based on their response to how frequently they use commuter rail RTI, with the
RTI user group consisting of respondents who said they “sometimes”, “often”, or “always” use
commuter rail RTI. The non-user group consisted of all respondents who said they “never” use
commuter rail RTI. Usual wait times were measured based on responses to the question: How
long do you usually wait at the commuter rail station? [Write number, e.g., 7 minutes].
This analysis aimed to capture the difference that RTI could have on passenger wait times
consult RTI would be able to adjust their wait times on days when the commuter rail experienced
delays. Subsequently, their “usual” wait times would be less than for riders who only consulted
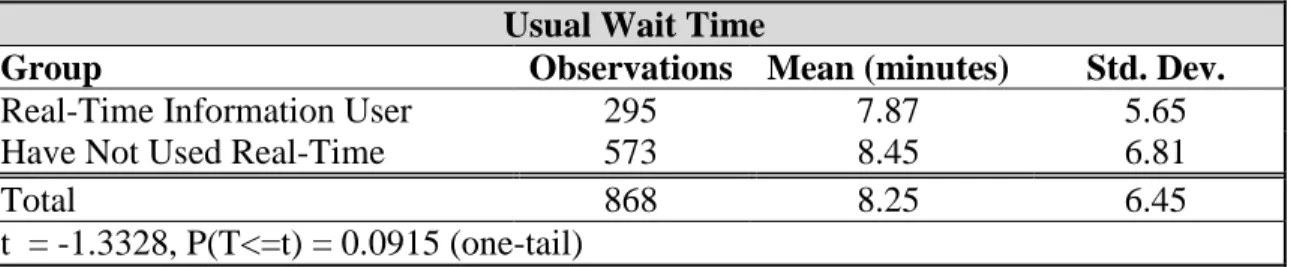
traditional information sources (i.e. schedules). Table 2 shows that the data somewhat support
this hypothesis, since the mean usual wait time of RTI users is almost one minute less than for
non-RTI users (7.87 minutes versus 8.45 minutes), a difference significant at a 90% confidence
level (p = 0.0915 < 0.1).
Table 2 Difference of Means Test for Usual Wait Time
Usual Wait Time
Group Observations Mean (minutes) Std. Dev.
Real-Time Information User 295 7.87 5.65
Have Not Used Real-Time 573 8.45 6.81
Total 868 8.25 6.45
t = -1.3328, P(T<=t) = 0.0915 (one-tail)
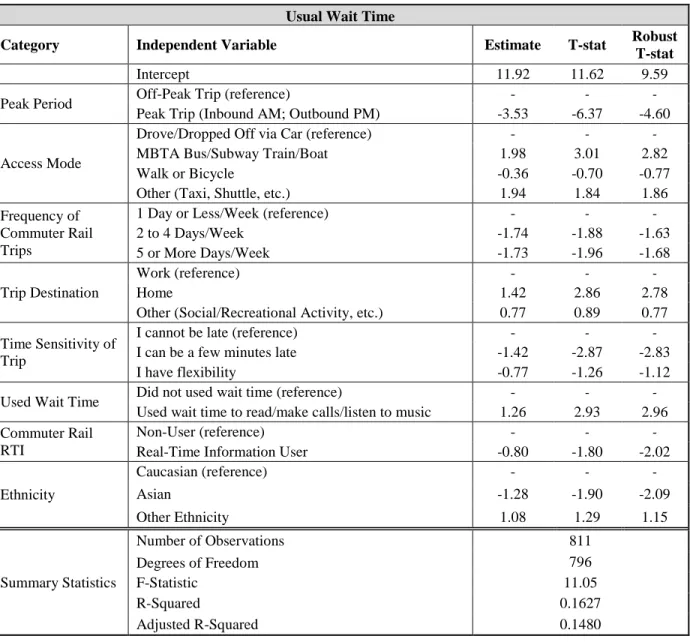
To control for potentially confounding variables influencing usual wait times, we again
estimated an ordinary least squares regression model, with the results shown in Table 3. The
independent variables included in different specifications were the same as the previous wait
time analysis, plus one additional variable for respondents who sometimes/often/always consult
commuter rail RTI. The overall goodness of fit of the model is moderately low
Table 3 Regression Model for Usual Wait Time
Usual Wait Time
Category Independent Variable Estimate T-stat Robust
T-stat
Intercept 11.92 11.62 9.59
Peak Period Off-Peak Trip (reference) - - - Peak Trip (Inbound AM; Outbound PM) -3.53 -6.37 -4.60
Access Mode
Drove/Dropped Off via Car (reference) - - -
MBTA Bus/Subway Train/Boat 1.98 3.01 2.82 Walk or Bicycle -0.36 -0.70 -0.77 Other (Taxi, Shuttle, etc.) 1.94 1.84 1.86 Frequency of
Commuter Rail Trips
1 Day or Less/Week (reference) - - -
2 to 4 Days/Week -1.74 -1.88 -1.63 5 or More Days/Week -1.73 -1.96 -1.68
Trip Destination
Work (reference) - - -
Home 1.42 2.86 2.78
Other (Social/Recreational Activity, etc.) 0.77 0.89 0.77 Time Sensitivity of
Trip
I cannot be late (reference) - - -
I can be a few minutes late -1.42 -2.87 -2.83 I have flexibility -0.77 -1.26 -1.12 Used Wait Time Did not used wait time (reference) - - -
Used wait time to read/make calls/listen to music 1.26 2.93 2.96 Commuter Rail
RTI
Non-User (reference) - - -
Real-Time Information User -0.80 -1.80 -2.02
Ethnicity Caucasian (reference) - - - Asian -1.28 -1.90 -2.09 Other Ethnicity 1.08 1.29 1.15 Summary Statistics Number of Observations 811 Degrees of Freedom 796 F-Statistic 11.05 R-Squared 0.1627 Adjusted R-Squared 0.1480
As can be seen in Table 3, the intercept term (11.92) indicates that when all other
variables are zero, the usual wait time is approximately twelve minutes. The first independent
variable, peak, is a binary variable for traveling in the peak direction (inbound in the morning,
outbound in the evening). The negative value of the peak direction coefficient (-3.53) shows that
those respondents who were traveling in the peak direction experience shorter typical wait times.
corresponding trips in the off-peak direction. The second set of independent variables, access
mode, reveals that accessing the commuter rail by MBTA-operated bus, subway train, or boat significantly increases the usual wait time, as is indicated by the positive coefficient (1.98). This
may be due to poor coordination between different transit modes and/or may result from higher
perceived waiting times due to the disutility of transferring between fixed schedule transit
services. The third set of variables, frequency of commuter rail trips, demonstrates that those
who ride that commuter rail line more frequently (2-4 days/week or 5+ days/week) report shorter
usual wait times. This may indicate that regular riders are more comfortable “cutting it short” or
have better knowledge of schedules. The positive coefficient (1.42) for the trip destination
variable representing home-bound trips indicates that respondents report higher typical wait
times when traveling home compared to work-bound trips. The fifth set of variables, time
sensitivity of the trip, shows that riders who can be a few minutes late and those who have flexibility report shorter wait times typically. These results suggest that riders with some
flexibility wait less, perhaps indicating a difference in perceived wait times and/or less concern
with missing the train if they “cut it close” getting to the train station. Respondents were also
asked how they used their wait time. Those who stated that they use the time to read, make calls,
listen to music, etc. typically experienced longer wait times, as indicated by the positive
coefficient (1.26). Two possible interpretations of this are that these riders think they spend
more time waiting because they are otherwise occupied, or they may choose to wait longer as
they find value in the use of that time. The only socioeconomic/demographic characteristic that
was statistically significant was the set of variables for ethnicity. The negative coefficient (-1.28)
for Asian riders indicates that they report shorter typical wait times, which requires further
Most importantly for this research, the binary variable representing use of commuter rail
RTI reveals that RTI users typically experience shorter wait times. The magnitude of the coefficient (-.80) implies that RTI users report that they typically wait, on average, about one
minute less than non-users, which is approximately 10% of the average usual wait time.
In light of the statistically significant relationship between the use of commuter rail RTI
and usual wait times, two important caveats should be made. First, the survey instrument had
free form responses for both questions about wait time (today and usual). For the usual wait time
question, many respondents wrote in a range (e.g., 8-10 minutes), as opposed to writing in a
single number (e.g., 7 minutes), and when a range was provided, the average of the range was
used. Future research should aim to more clearly capture this concept, since it may be indicative
of the inherent variability of wait times. Second, as was previously noted, wait times used in
both analyses were self-reported. Prior research has shown that self-reported wait times may not
align with actual wait times due to the perception of time (Watkins et al. 2011). Accordingly, the
finding that the usual wait times of RTI users were less than the usual wait times of non-users
could actually be a difference in the perception of wait time attributable to RTI. In order to
differentiate between the two (actual and perceived wait times), independent observations of
passenger wait times would be necessary.
Analysis 3: Quality of Service
The third analysis pertains to the quality of transit service, since prior work revealed that
increases in satisfaction with transit service are another possible benefit of RTI systems. Tables
4 and 5 show the results of the quality of service analysis that tests the differences between RTI users (defined previously, as “sometimes”, “often”, or “always” using commuter RTI) and
elements of transit service (#1-6 in Tables 4 and #7-9 in Table 5) and three overall quality of
service indicators (#10-12 in Table 5). Respondents ranked all twelve indicators on five point
scales from poor to excellent. Some of these indicators were selected because of their use on
previous MBTA surveys (CTPS 2010), and others were added to capture topics related to
information provision, particularly RTI and T-alerts.
Tables 4 and 5 show the count and percentage of survey responses for each quality of
service indicator for non-users, RTI users, and their combined total. Additionally, the percent
above average (good/excellent) is shown for non-users, RTI users, and their combined total. The
results of chi-squared tests used to assess differences between RTI users and non-users are also
shown.
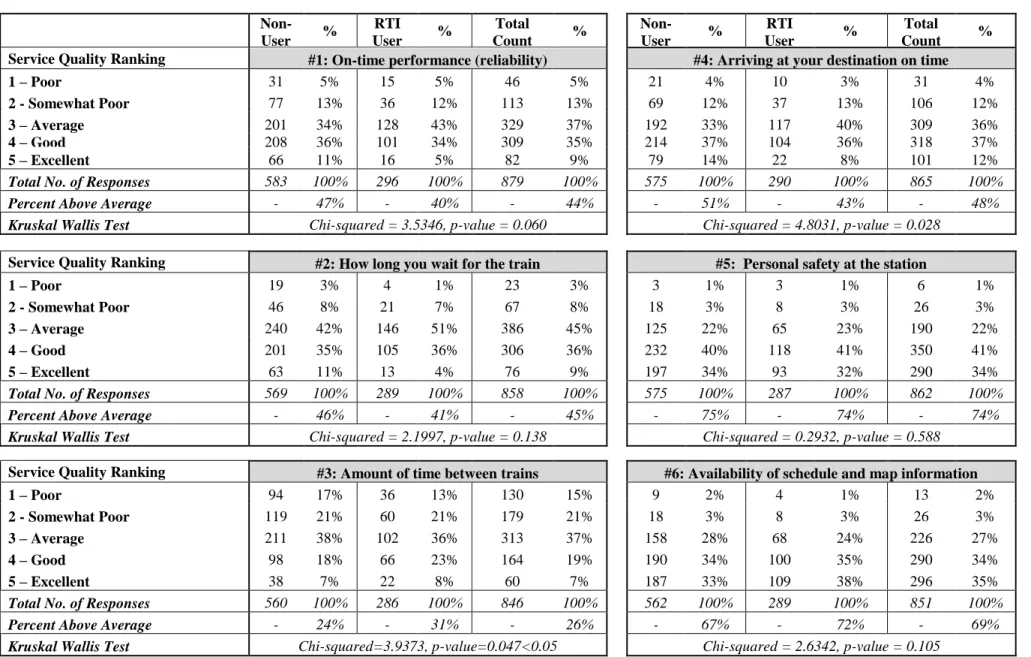
Overall, the analysis shows limited relationships between the quality of service indicators
and the use of commuter rail RTI. Of the twelve indicators, eight were not correlated with use of
commuter rail RTI (p>0.05). Two indicators had statistically significant differences in which
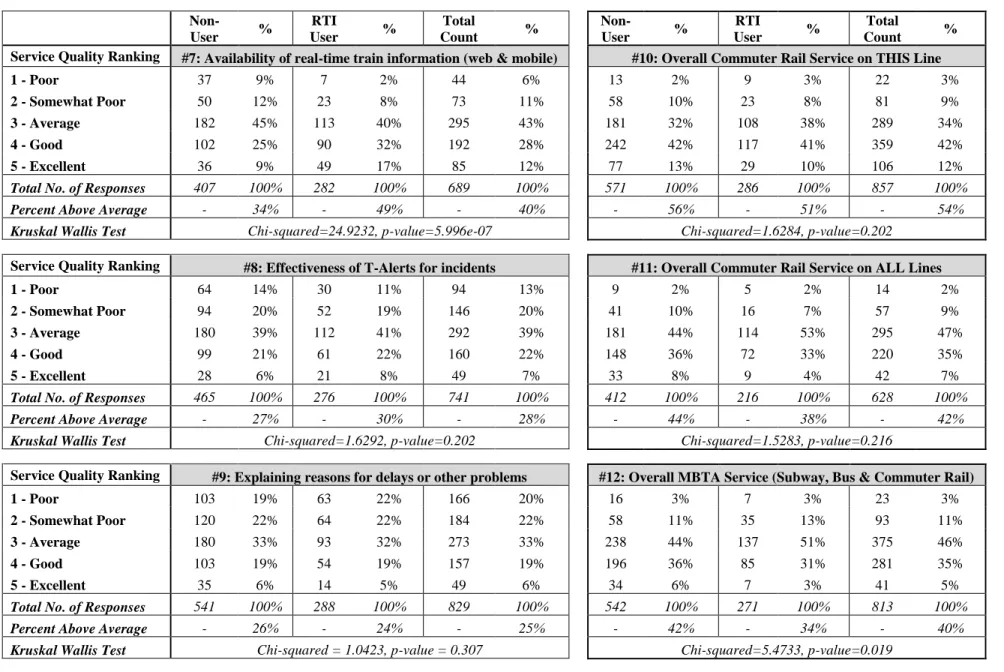
non-users reported higher rankings (“Arriving at your destination on-time” and “Overall MBTA
service”), and only two had statistically significant differences in which the RTI user group
reported higher levels of quality of service (“Amount of time between trains” in Table 4 and “Availability of real-time train information” in Table 5). The higher ranking of the availability
of commuter rail RTI by its user group is intuitive, since those who use RTI are more likely to
rank it favorably since they value it enough to use it. The positive correlation of RTI use with
the indicator for the amount of time between trains suggests that respondents who use RTI do not
experience as much time between trains or are not as concerned by the time between trains, and
subsequently, they may perceive the frequency of service as higher quality, even though
Table 4: Results of the Quality of Service Analysis for Indicators #1-6 Non-User % RTI User % Total Count % Non-User % RTI User % Total Count %
Service Quality Ranking #1: On-time performance (reliability) #4: Arriving at your destination on time
1 – Poor 31 5% 15 5% 46 5% 21 4% 10 3% 31 4%
2 - Somewhat Poor 77 13% 36 12% 113 13% 69 12% 37 13% 106 12%
3 – Average 201 34% 128 43% 329 37% 192 33% 117 40% 309 36%
4 – Good 208 36% 101 34% 309 35% 214 37% 104 36% 318 37%
5 – Excellent 66 11% 16 5% 82 9% 79 14% 22 8% 101 12%
Total No. of Responses 583 100% 296 100% 879 100% 575 100% 290 100% 865 100%
Percent Above Average - 47% - 40% - 44% - 51% - 43% - 48%
Kruskal Wallis Test Chi-squared = 3.5346, p-value = 0.060 Chi-squared = 4.8031, p-value = 0.028
Service Quality Ranking #2: How long you wait for the train #5: Personal safety at the station
1 – Poor 19 3% 4 1% 23 3% 3 1% 3 1% 6 1%
2 - Somewhat Poor 46 8% 21 7% 67 8% 18 3% 8 3% 26 3%
3 – Average 240 42% 146 51% 386 45% 125 22% 65 23% 190 22%
4 – Good 201 35% 105 36% 306 36% 232 40% 118 41% 350 41%
5 – Excellent 63 11% 13 4% 76 9% 197 34% 93 32% 290 34%
Total No. of Responses 569 100% 289 100% 858 100% 575 100% 287 100% 862 100%
Percent Above Average - 46% - 41% - 45% - 75% - 74% - 74%
Kruskal Wallis Test Chi-squared = 2.1997, p-value = 0.138 Chi-squared = 0.2932, p-value = 0.588
Service Quality Ranking #3: Amount of time between trains #6: Availability of schedule and map information
1 – Poor 94 17% 36 13% 130 15% 9 2% 4 1% 13 2%
2 - Somewhat Poor 119 21% 60 21% 179 21% 18 3% 8 3% 26 3%
3 – Average 211 38% 102 36% 313 37% 158 28% 68 24% 226 27%
4 – Good 98 18% 66 23% 164 19% 190 34% 100 35% 290 34%
5 – Excellent 38 7% 22 8% 60 7% 187 33% 109 38% 296 35%
Total No. of Responses 560 100% 286 100% 846 100% 562 100% 289 100% 851 100%
Percent Above Average - 24% - 31% - 26% - 67% - 72% - 69%
Table 5: Results of the Quality of Service Analysis for Indicators #7-12 Non-User % RTI User % Total Count % Non-User % RTI User % Total Count %
Service Quality Ranking #7: Availability of real-time train information (web & mobile) #10: Overall Commuter Rail Service on THIS Line
1 - Poor 37 9% 7 2% 44 6% 13 2% 9 3% 22 3%
2 - Somewhat Poor 50 12% 23 8% 73 11% 58 10% 23 8% 81 9%
3 - Average 182 45% 113 40% 295 43% 181 32% 108 38% 289 34%
4 - Good 102 25% 90 32% 192 28% 242 42% 117 41% 359 42%
5 - Excellent 36 9% 49 17% 85 12% 77 13% 29 10% 106 12%
Total No. of Responses 407 100% 282 100% 689 100% 571 100% 286 100% 857 100%
Percent Above Average - 34% - 49% - 40% - 56% - 51% - 54%
Kruskal Wallis Test Chi-squared=24.9232, p-value=5.996e-07 Chi-squared=1.6284, p-value=0.202
Service Quality Ranking #8: Effectiveness of T-Alerts for incidents #11: Overall Commuter Rail Service on ALL Lines
1 - Poor 64 14% 30 11% 94 13% 9 2% 5 2% 14 2%
2 - Somewhat Poor 94 20% 52 19% 146 20% 41 10% 16 7% 57 9%
3 - Average 180 39% 112 41% 292 39% 181 44% 114 53% 295 47%
4 - Good 99 21% 61 22% 160 22% 148 36% 72 33% 220 35%
5 - Excellent 28 6% 21 8% 49 7% 33 8% 9 4% 42 7%
Total No. of Responses 465 100% 276 100% 741 100% 412 100% 216 100% 628 100%
Percent Above Average - 27% - 30% - 28% - 44% - 38% - 42%
Kruskal Wallis Test Chi-squared=1.6292, p-value=0.202 Chi-squared=1.5283, p-value=0.216
Service Quality Ranking #9: Explaining reasons for delays or other problems #12: Overall MBTA Service (Subway, Bus & Commuter Rail)
1 - Poor 103 19% 63 22% 166 20% 16 3% 7 3% 23 3%
2 - Somewhat Poor 120 22% 64 22% 184 22% 58 11% 35 13% 93 11%
3 - Average 180 33% 93 32% 273 33% 238 44% 137 51% 375 46%
4 - Good 103 19% 54 19% 157 19% 196 36% 85 31% 281 35%
5 - Excellent 35 6% 14 5% 49 6% 34 6% 7 3% 41 5%
Total No. of Responses 541 100% 288 100% 829 100% 542 100% 271 100% 813 100%
Percent Above Average - 26% - 24% - 25% - 42% - 34% - 40%
Limitations and Future Research
A few noteworthy caveats limit the results of this exploratory study, and many areas for
future research can be identified based on the results.
One noteworthy limitation of the on-board sampling method was that the response rate of
the survey was not measured due to manpower constraints and the difficulty distributing surveys
in crowded train cars. Another limitation of this study is that the accuracy of RTI was not
monitored during the study period, which could have been done by comparing real-time arrival
predictions to actual train arrival times. Because 21% of surveyed riders who do not use
commuter rail RTI stated that commuter rail RTI is not accurate, further study should be
conducted in the area of data accuracy and its impact on passengers.
In terms of future research, to expand upon this research design, riders on other
commuter rail lines in Boston or on commuter rail systems in other cities could be surveyed to
identify trends in the use and benefits of commuter rail RTI. Additionally, the sampling frame
could include travelers using other forms of transportation who may switch modes due to the
possible conveniences afforded by the provision of RTI. This is particularly important area for
future research because many rail providers want to understand if providing RTI increases rail
ridership, which might occur in the long term.
The analysis of RTI utilization could be expanded in numerous ways. First, future
research could assess disaggregate trends (i.e. RTI queries by line, station-specific RTI queries)
using fine-grained, server-side data by working with RTI application developers. Similarly, as of
October 2014, there were 80+ different applications that provide transit information in the
Boston region, and these applications could be compared to assess the quality of information
the utilization of RTI with both schedules and service alerts, particularly when there are differing
levels of delays in transit service.
There are also avenues for additional research pertaining to both the wait time and quality
of service analyses. The finding that use of RTI is associated with reduced usual wait times
relied on self-reported data. For more concrete measurements, wait time observations should be
conducted and repeated over time, which may also distinguish between differences in perceived
and actual wait times. Additionally, the quality of service analysis could be expanded using multivariate techniques, such as factor analysis, to tease out the many factors that affect a rider’s
ranking of quality of service.
Conclusions
This research sheds light on the use of RTI on commuter rail services, offering initial
insights on overall utilization of RTI, the relationship between RTI and passenger wait times, and
the relationship between RTI and indicators of quality of service.
One year after the release of real-time data for Boston’s commuter rail, a third of
commuter rail riders used RTI either sometimes/often/always, despite the fact that commuter rail
RTI had not been formally marketed by the MBTA or MBCR. However, on a daily basis, the
percentage of surveyed riders using commuter rail RTI was much lower, with only 5.5% of
riders using RTI on the days the survey was conducted. Additionally, a large amount of overlap
exists between riders who use commuter rail, bus, and subway RTI, which may be attributable to
applications that integrate information from all three modes.
Two analyses of passenger wait times produced interesting results. First, wait times on
boarding the train and those who did not, but the results did not support the hypothesis that RTI
use lowers wait times. This may be partially attributed to the fact that there were no delays on
the days when the survey was administered, and subsequently, passengers who consulted RTI
before boarding would have seen the same information as passengers who consulted schedules.
Conversely, the analysis of “usual” wait times showed that use of commuter rail RTI was
associated with a decrease in self-reported usual wait times. This statistically significant finding
may capture the difference that RTI has on wait times over an extended period of time, since
passengers who sometimes/often/always consult RTI can adjust their wait times on days when
commuter rail service is delayed. Alternatively, it may be a difference in the perception of wait
time attributable to RTI, since all wait time measures were self-reported.
An analysis of twelve quality of service indicators showed limited relationship with the
use of commuter rail RTI. The only noteworthy finding is the positive correlation of RTI use
with the indicator for the amount of time between trains, suggesting that respondents who use
RTI do not experience as much time between trains or are not as concerned by the time between
trains. Overall, the limited relationship between RTI use and the various quality of service
indicators suggests minimal impacts of RTI on rider satisfaction with commuter rail service.
Overall, the results suggest that the benefits of commuter rail RTI are modest. This could
be due to commuter rail’s relatively high levels of on-time performance, the common practice of
passengers consulting commuter rail schedules, the regularity of travel patterns among
commuting riders, and/or users’ limited possibilities to seek out wait time activities due to the
design or location of stations. Transit providers may look to invest elsewhere if providing RTI to
commuter rail passengers would be a costly endeavor. However, despite the modest benefits,
generally increased expectations for refined, personalized transportation information sources.
Therefore, where RTI is easily provided, agencies should consider offering it along with bus and
Acknowledgements
This research was funded by a Rappaport Institute Public Policy Summer Fellowship, the
Singapore MIT Alliance for Research and Technology, a US DOT Eisenhower fellowship, a
WTS Boston Fellowship, and a University Transportation Center grant. A sincere thanks to Jake
Sion and Sam Jordan for their help coding the survey data and to the MIT student volunteers
who helped distribute the surveys. We would also like to thank Gregory Macfarlane at Georgia
Tech for his guidance on robust regression; Professor David Weil, Professor Archon Fung, and
Mary Graham of the Transparency Policy Project at the Harvard Kennedy School Ash Center for
Democratic Governance and Innovation for their support of the project; and Michael Lambert at
References
American Public Transportation Association (APTA). 2012. 2012 Public Transportation Fact
Book 63nd Edition. Washington, DC.
Brakewood, 2014. Publications.
http://candacebrakewood.files.wordpress.com/2013/09/6-4-2012-inbound_worcester_survey_questionnaire.pdf. Accessed October 21, 2014.
Brakewood, Barbeau, Watkins (2014). An Experiment Evaluating the Impacts of Real-Time
Transit Information on Bus Riders in Tampa, Florida. Transportation Research Part A:
Policy and Practice, Volume 69, pp. 409-422.
Brakewood, Rojas, Robin, Sion, and Jordan. 2014. Forecasting Mobile Ticketing Adoption on
Commuter Rail. Journal of Public Transportation, 17.1. pp 1-19.
Carrel, A., Halvorsen, A., Walker, J. L. 2013. Passengers’ Perception of and Behavioral
Adaptation to Unreliability in Public Transportation. Transportation Research Record:
Journal of the Transportation Research Board, 2351, 153-162.
Cats, O., Koutsopoulos, H.N., Burghout, W., Toledo, T., 2011. Effect of Real-time Transit
Information on Dynamic Path Choice of Passengers. Transportation Research Record:
Journal of the Transportation Research Board, 2217, 46–54.
Central Transportation Planning Staff (CTPS). 2010. Commuter Rail All Lines 2008-09. MBTA
Systemwide Passenger Survey.
http://www.ctps.org/drupal/data/pdf/studies/transit/MBTA_Passenger_Survey/Commuter
_Rail_Volume.pdf. Accessed July 26, 2013.
Ferris, B., Watkins, K., Borning, A. (2010). OneBusAway: Results from Providing Real-Time
Fries, R. N., Dunning, A. E., & Chowdhury, M. A. (2011). University Traveler Value of
Potential Real-Time Transit Information. Journal of Public Transportation, 14(2), 29–50.
Gooze, A., Watkins, K. E., Borning, A. (2013). Benefits of Real-Time Transit Information and
Impacts of Data Accuracy on Rider Experience. Transportation Research Record:
Journal of the Transportation Research Board, 2351, 95–103.
Massachusetts Bay Transportation Authority (MBTA). 2013. Introducing the New T-alerts.
http://www.mbta.com/rider_tools/t_alerts/. Accessed July 26, 2013.
Massachusetts Bay Transportation Authority (MBTA). 2014. App Showcase.
http://mbta.com/rider_tools/apps/ Accessed October 25, 2014.
Massachusetts Bay Transportation Authority (MBTA). 2010. Ridership and Service Statistics.
Thirteenth Edition, 2010.
http://www.mbta.com/uploadedfiles/documents/Bluebook%202010.pdf. Accessed July
26, 2013.
Massachusetts Bay Transportation Authority (MBTA). 2012. Scorecard: July 2012.
http://www.mbta.com/uploadedfiles/About_the_T/Score_Card/ScoreCard%202012-07.pdf. Accessed November 11, 2013.
Massachusetts Department of Transportation (MassDOT). 2013. MassDOT Developers Page.
http://www.massdot.state.ma.us/DevelopersData.aspx. Accessed July 26, 2013.
Metra. 2013. Real-Time Tracker. http://metrarail.com/metra/en/home.html. Accessed July 25,
2013.
Metropolitan Transportation Authority (MTA). 2013a. LIRR Train Time Pilot Program.
Metropolitan Transportation Authority (MTA). 2013b. Metro-North Train Time!
http://m.mta.info/mt/as0.mta.info/mnr/mstations/default.cfm. Accessed July 25, 2013.
New Jersey Transit. 2013. Departure Vision.
http://dv.njtransit.com/mobile/tid-mobile.aspx?sid=AZ. Accessed July 25, 2013.
Pew Research Internet Project. 2012. Nearly Half of American Adults are Smartphone Owners.
http://www.pewinternet.org/2012/03/01/nearly-half-of-american-adults-are-smartphone-owners/. Accessed October 22, 2014.
Rojas, Francisca. 2012. Transit Transparency: Effective Disclosure through Open Data.
Transparency Policy Project, Harvard Kennedy School.
http://www.transparencypolicy.net/assets/FINAL_UTC_TransitTransparency_8%2028%
202012.pdf. Accessed July 26, 2013.
Schweiger, Carol. 2011. Use and Deployment of Mobile Device Technology for Real-Time
Transit Information. Transit Cooperative Research (TCRP) Synthesis 91. Transportation
Research Board of the National Academies, Washington, DC.
Tang, L., Ross, H., Han, X. 2013. Substitution or Complementarity: An Examination of the
Ridership Effects of Real-time Bus Information on Transit Rail in the City of Chicago.
Proceedings of the 92nd Transportation Research Board Annual Meeting, Transportation Research Board of the National Academies, Washington, DC.
Tang, L., & Thakuriah, P. 2010. Will the Psychological Effects of Real-time Transit Information
Systems Lead to Ridership Gain? Proceedings at the Transportation Research Board
90th Annual Meeting, Transportation Research Board of the National Academies, Washington, DC.
Tang, L., Thakuriah, P. 2012. Ridership Effects of Real-Time Bus Information System: A Case
Study in the City of Chicago. Transportation Research Part C, 22, pp.141-161.
Watkins, K., Ferris, B., Borning, A., Rutherford, S., and Layton, D. 2011. Where Is My Bus?
Impact of Mobile Real-time Information on the Perceived and Actual Wait Time of
Transit riders. Transportation Research Part A, 45, pp. 839–848.
Zhang, F., Q. Shen, K. Clifton. 2008. Examination of Traveler Responses to Real-time
Information about Bus Arrivals using Panel Data. Transportation Research Record:
Journal of the Transportation Research Board, No. 2082, Transportation Research Board of the National Academies, Washington, DC, pp. 107–115.
Captions
Figure 1 Timeline of Transit Data Release in Boston
Figure 2 Awareness and Utilization of RTI by Commuter Rail Riders
Figure 3 How Riders Access Commuter Rail RTI
Figure 4 Reasons Why Riders Do No Use Commuter Rail RTI
Table 1 Difference of Means Test for Wait Time Today
Table 2 Difference of Means Test for Usual Wait Time
Table 3 Regression Model for Usual Wait Time
Table 4 Results of the Quality of Service Analysis for Indicators #1-6
Biographical Sketches
Candace Brakewood is an Assistant Professor of Civil Engineering at the City College of New
York. Her research focuses on public transportation, transportation planning, and intelligent
transportation systems.
Dr. Francisca Rojas is an Urban Development Specialist at the Inter-American Development
Bank. Previously, she was Research Director with the Transparency Policy Project at the
Kennedy School of Government at Harvard University.
Dr. P. Christopher Zegras is an Associate Professor of Urban Planning at Massachusetts Institute
of Technology. His teaching and research interests include the inter-relations between
transportation and the built and natural environments, transportation system finance and policy,
and integrated system modeling.
Dr. Kari Watkins is an Assistant Professor of Civil Engineering at Georgia Institute of
Technology. Her teaching and research interests revolve around multi-modal transportation
planning and the use of technology in transportation, especially as related to transit planning and
operations and improved traveler information.
Joshua Robin is Masabi’s Vice President for Strategy and Development – North America, where
he is responsible for working with US transit agencies to deploy Masabi’s mobile ticketing and
agile fare collection systems. Prior to joining Masabi, he was the Director of Innovation for the