Serbia’S
S u Sta i n a b l e
Serbia’S
S u Sta i n a b l e
D e v e lo p m e n t :
h ow
a r e
w e
d o i n g
?
about ceves
CEVES is an independent think-and-do tank dedicated to the sustainable socio-economic development of Serbia and the Western Balkans, based on entrepreneurship, solidarity and civic initiative. At present, CEVES’ energy is focused on identifying and researching the most important determinants of sustainable socio-economic development in Serbia and the region, as well as offering innovative, responsible and evidence-based solutions and policies, not only for the state but also for the wider society – primarily to those directly affected by these issues (entrepreneurs, employees / unemployed, scientific institutions, etc.). CEVES is committed to the nationalization and achievement of sustainable development goals in Serbia, as a particularly suitable framework for directing societal development and for embodiment and quantification of European values, especially in areas not prescribed by the Acquis.
The brochure is created as a result of research done within the project „Preparatory Project for a Society-wide Dialogue Platform on SDGs for Serbia” supported by Government of Switzerland. The brochure was derived from the study “Serbia Sustainable Development Issues: A Baseline Review”. The Baseline Review was prepared by the Center of Advanced Economic Studies (CEVES), led by Kori Udovički with a research team composed of Nemanja Šormaz, Danijela Bobić, Aleksandra Urošev, Valentina Čolić, Mila Pejčić and Jelisaveta Lazarević.
This study benefited from comments by participants at several workshops and consultative meetings, as well as from bilateral meetings with stakeholders. We particularly thank Mr. Aleksandar Macura, Ms. Ljiljana Hadžibabic, Mr. Đorđe Krivokapić for their written contributions.
The production of this publication was supported by the Government of Switzerland. The publication does not necessarily represent the official stand-points of the Swiss Government.
content
foreword summary backgroundpillari
-
serbia’
shumandevelopment:
dimensionsandchallenges• serbia’shumandevelopmentlieswellbelowitspotential.
• itisintheincomedimensionofthehdicomponentsthatserbiarankslowest.
• economicgrowthhasrecentlyaccelerated, ledbyasmallbutcompetitive andexport-orientedneweconomy.
• serbia’sstrongesthumandevelopmentaspectisitseducationalattainment
(55th), measuredbyquantity – yearsofschooling.
• the qualityofeducationdoesnotfully prepareyouthfortoday’slabor market – eitherasemployeesorasentrepreneurs
• healthisrankedlow, especiallyconsideringthestrongyugoslavlegacy, reflectingoverallinstitutionalweaknesses.
• povertyandinequalityremainhigh, duetothelowemploymentlevel andlowre-distributiveeffectoffiscalpolicies.
• vulnerablepopulationgroupsareparticularlyaffectedbypoverty andinequalityofaccess.
• serbiafaces oneofthefastest ratesofpopulationdeclineineurope.
pillarii
-
prosperityonagreencorneroftheplanet:
assetsandchallenges
.
• serbia’ssustainabledevelopmentopportunitieslieintheverystrengths thattodaydriveitsexportgrowth.
• serbiacanbecomeanagri-foodpowerhouseandliftitsruralareasout ofpovertyandisolation.
• astrongengineeringandmetalworkingtraditionisgivingriseto arecoveryinthemid- andmid-to-highleveltechnologyindustries.
• someveryhighly-skilledgraduatesthatstayinserbiaaregivingriseto ahigh-knowledgecontentserviceindustry.
• amultitudeofgreengrowthopportunitieslayunexploitedandcouldprovide theedgeneededtoliftsustainablyserbia’sdevelopmenttoahigherlevel.
• euenvironmentalregulationsregardingtransparency, impactassessment, andthe circulareconomyhavelargelybeenadopted, butarealltoooftennotimplemented.
• serbiawastesenergythatcouldbeputintheserviceofsustainable developmentaswellascontributetomitigatingclimatechange.
• whileserbia’sgeostrategicpositionisanopportunity, othercross-cutting issuesarelargelychallenges.
pillariii
-
institutional capacityandpartnership• theeu’saccessionprioritiesregardingpoliticalandinstitutionalreform areequivalenttogoal 16 alignedtothehighestglobalstandards.
• goodinstitutionsmatteralsoinordertobetterattainalltheother sixteensdgs
• toooftenthestatusquowinsoverproclaimedpolicypriorities.
• evenwhenthepoliticalwillisnotlacking, itishardtocallimplementers toaccount.
• thecapacityofspecificinstitutionstodeliverspecificsdgtargetsshould bemonitoredasintermediatetargets.
pillariv
-
prosperousandcohesive communities• inserbialsgunitsperformabroadarrayoftasks, buttherearefewareas inwhichtheytrulyexercisesovereignpower.
• ownhousingprovideseconomicsecurity, butcommunalservices, especially wastemanagement, needimprovement.
• thecentralgovernment’scompetenceinmostdevelopmentaspectshasnot reducedregionaldifferencesinoutcomes.
• localcommunitiesneedgreaterlocalautonomyinrespondingtodevelopmentproblems.
• stakeholderengagementinfosteringlocalsdgscouldmakeanimportant contributiontolocaldevelopment!
listoffigures
8
13
10
16
54
37
64
78
16 50 53 49 47 18 22 54 24 56 26 58 28 60 30 62 32 65 34 66 37 69 75 38 42 45 77Institute of Public Health of Serbia Center for Advanced Economic Studies European Commission
European Union
Statistical office of the European Union Foreign Direct Investment
Gross Domestic Product Genetically Modified Organism Gross value added
Human development Human Development Index Information Technology Local Self-government Local utility companies
New member states of European Union
Organisation for Economic Co-operation and Development Programme for International Student Assessment
Renewable energy resources Serbian Business Registers Agency Sustainable Development Goals Small and Medium Enterprises
Statistical Office of the Republic of Serbia United Nations
United Nations Development Program Worldwide Governance Indicator World Health Organization World Trade Organisation batut ceves ec eu eurostat FdI gdP gMo gva Hd HdI It lsg luc nMseu oecd PIsa rer sbra sdg sMe sors un unPd WgI WHo Wto
acronyMs
Icons
Goal 1: End poverty in all its forms everywhere
Goal 2: End hunger, achieve food security and improved nutrition and promote sustainable agriculture
Goal 3: Ensure healthy lives and promote well-being for all at all ages
Goal 4: Ensure inclusive and quality education for all and promote lifelong learning
Goal 5: Achieve gender equality and empower all women and girls
Goal 6: Ensure access to water and sanitation for all
Goal 7: Ensure access to affordable, reliable, sustainable and modern energy for all
Goal 8: Promote inclusive and sustainable economic growth, employment and decent work for all Goal 9: Build resilient infrastructure, promote sustainable industrialization and foster innovation
Goal 10: Reduce inequality within and among countries
Goal 11: Make cities inclusive, safe, resilient and sustainable
Goal 12: Ensure sustainable
consumption and production patterns
Goal 13: Take urgent action to combat climate change and its impacts
Goal 14: Conserve and sustainably use the oceans, seas and marine resources
Goal 15: Sustainably manage forests, combat desertification, halt and reverse land degradation, halt biodiversity loss
Goal 16: Promote just, peaceful and inclusive societies
Goal 17: Revitalize the global partnership for sustainable development
ForeWord
Serbia needs to step more decisively on an accelerated and sustainable development path. For this, she needs to turn her thoughts to the future: to invest in it and shape it. But first, she needs to decide–what should this future look like? What kind of country does Serbia want to be? The Agenda 2030 adopted by the United Nations (UN) in 2015 gives us an opportunity to open a society-wide dialogue to shape this vision. It sets 17 global sustainable development goals (SDG) and commits the 193 countries that have subscribed to it, Serbia among them, to do their part to attain them. The countries have committed to “nationalize” the goals – meaning, specify goals for themselves that meet the criteria and work toward their realization. They have also committed to set national implementation and monitoring frameworks to accomplish the “nationalized” goals. The responsibility for their attainment is shared among all parts of society – not only the government but also the business community, academia, other stakeholders, and civil society. To forge a vision, many questions need to be answered. How do we want our economy, society and environment to work and look like by 2030? Clearly, Serbia wants to be a “European country”, but the
28 European Union member countries are all “European” in different ways. What do we want to improve most, what first? Were they to receive a windfall of one billion euros, each EU member country would have different priorities in spending them. What would be Serbia’s? A clear answer requires a shared understanding that can only be reached through a broad and thorough dialogue.
The present document sets a baseline for such a dialogue. It does not attempt to assess every one of the 169 targets through which the 17 SDGs are formulated, and it is not organized goal by goal. Instead, it is a discussion of Serbia’s most important sustainable development challenges and the strengths it should build on – as we see them. We do not attempt to give answers to the above questions. However, we do not shy away from giving our views of the direction in which these answers should be sought, by being selective about the issues we discuss. Not everyone will agree. Even we may change our minds. That would mean the dialogue had been fruitful.
We look forward to it!
suMMary
Nearly three decades since Serbia’s stormy transition begun, the country’s GDP per capita still stands below the 1989 level, and its human development is still catching up to its full potential. A new economy has, nevertheless, gradually developed which is reaching a significant size. Serbia’s key development challenge is that only a small part of the economy built during socialism has been transformed into a new, modern economy. The new economy employs a very small share of the total population. To reach average European employment levels in decent jobs, today’s formal jobs in the private sector would need to be doubled (and this assumes all formal employment in Serbia is “decent”, which it is not). Raising employment to normal levels would go a very long way in reducing inequality and poverty to better-than-average European levels, where they should be considering Serbia’s socialist past and current values. As it is, Serbia suffers some of the highest poverty and inequality rates in Europe, as well as one of the sharpest population declines.
The high levels of poverty and inequality would also be greatly alleviated if Serbia’s significant taxes and social transfers accomplished the significant redistributive effect they have in the European Union (EU). More needs to be done particularly for vulnerable groups and to protect minority rights, although in these regards significant advances were made over the past decade and a half.
Economic growth does seem poised to accelerate in the coming period. The new economy has been growing on the foundations built in the past, driven by foreign investors as well as domestic mainly SME entrepreneurs. It is now finally reaching a size that can take the country forward. Importantly, since the 2009 crisis the new economy has been led by exports. Serbia’s opportunities lie in the three factors that have underpinned its conquest of export markets: fertile land and a long-standing agribusiness tradition, very solid and competitive mid-technology industrial know-how, and a self-mobilizing creative and knowledge-products community (especially in IT).
Economic growth can be further spread and accelerated through “greening”, especially in rural areas. This requires a more coordinated and organized management of non-mineral natural resources, especially for eco- and health-related tourism, renewable energy production, and sustainable agriculture.
One key challenge that the new economy needs to overcome is the need for integration. As it is, Serbia’s generally small companies often face global markets alone.
A particular challenge is also the highly inefficient management of the country’s resources, particularly in the energy sector. Serbia recycles only 34% of its generated waste (excluding mineral waste), lower than any EU member country, whose average stands at 75%. Its energy intensity is double that of the EU average, although it does not have a very large heavy industry. Serbia has no strategy for the time, expected not long after 2030, when the hydrocarbon reserves she presently relies on are depleted.
European values and the EU accession process firmly frame Serbia’s institutional and political goals as goals in and of themselves. However, the acceleration and greater sustainability of Serbia’s development requires a business environment that encourages entrepreneurship and investment. Above all, this requires predictability—the rule of law and that priorities are more clearly set and maintained. Also, policy implementation requires that Serbia’s administration change practices that make its institutions particularly ineffective.The dialogue proposed here can contribute to overcoming these problems by linking institutional operation to specific desired results.
Finally, it is at the community level that development reaches citizens. Serbia’s local communities provide basic needs at relatively high levels, but largely as a legacy of socialist times. Local and regional development is highly uneven and there is some evidence that the relatively high level of resource transfers carried out by the central government could be better targeted to have developmental effects. Local governments need greater autonomy, in order for local communities to come together in taking initiative and responsibility for accomplishing greater local-level results.
Serbia’s development faces both challenges and opportunities. Both need to be recognized by its citizens, business and other stakeholders of development. They need to engage with Serbia’s national and local institutions to accelerate and make sustainable Serbia’s development. An SDG framework clearly linking goals to institutional capacities to deliver them, as intermediate targets, can greatly help in getting Serbia to become what its citizens want it to be.
background
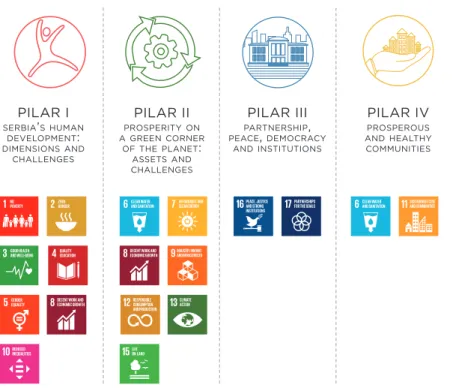
the present document is a baseline review of serbia’s human development and environmental challenges as well as the assets and limitations it faces in advancing towards attainment of sustainable development goals (sdgs). It provides background information for the design of a society-wide dialogue to help shape Serbia’s nationalization of SDGs in line with its commitment to the UN 2030 Agenda. The document focuses on SDG dimensions, grouped in four pillars, that we consider key for Serbia’s human development, and it does not address existing policy goals or options, nor their implementation.
Figure 1. SDG dimensions are grouped in four pillars – according to Serbia’s socio-economic development potential and issues.
Pillar I - “serbia’s Human development: dimensions and challenges” is dedicated to the dimensions of human development (Hd), largely covering the issues under Goals 1-5 and 10 (poverty, hunger, health, education and inequality), as well as overall income generation capacity and particularly employment (Goal 8, emphasis on 8.5). We start the review focusing on issues related to income generation capacity, because that is by far the lowest ranked dimension (84th in the world) of Serbia’s human development index (which ranks 66th overall).
Pillar II - “Prosperity on a green corner of the planet: assets and challenges” refers to the serbia’s assets and constraints, which represent the starting point for fostering quality economic growth, i.e., accomplishing Goal 8. We organize these assets and constraints roughly along the logic of economic factors of production, but also “mainstreaming” the fact that economic growth needs to be such as to meet not only the targets under Goal 8, but also Goal 9 (focusing on infrastructure, industrialization and innovation), Goal 7 (energy), parts of Goal 6 (water management), Goal 12 (sustainable production and consumption), and Goal 15 (forests and biodiversity).
Pillar III - “Institutional capacity and Partnership” deals with the role of institutions, and particularly with their capacity to deliver the sdgs. As Serbia’s values and aspirations with regards to the development of its institutions are firmly framed in its European path, in general, nationalized Goal 16 should closely follow the results framework adopted in the EU Accession context. In as far as these goals are goals in and of themselves, the EU’s progress reports’ assessments are comprehensive. Therefore, we focus on institutional effectiveness and the system’s capacity to deliver desired development results.
Pillar Iv - “Prosperous and Healthy communities” covers issues related to delivering human development at the community level. Essentially, this is a cross-cutting approach that presently incorporates questions of territorial distribution of powers, management of regional/territorial development and the extent to which the basic human development needs and resilience are met at the local level {parts of SDG 6 (clean water and sanitation) and SDG 11 (sustainable cities and communities)}.
PILAR II prosperityon agreencorner oftheplanet: assetsand challenges PILAR III partnership, peace, democracy andinstitutions PILAR IV prosperous andhealthy communities PILAR I serbia’shuman development: dimensionsand challenges
PIllar I – serbIa’s HuMan
develoPMent: dIMensIons
and cHallenges
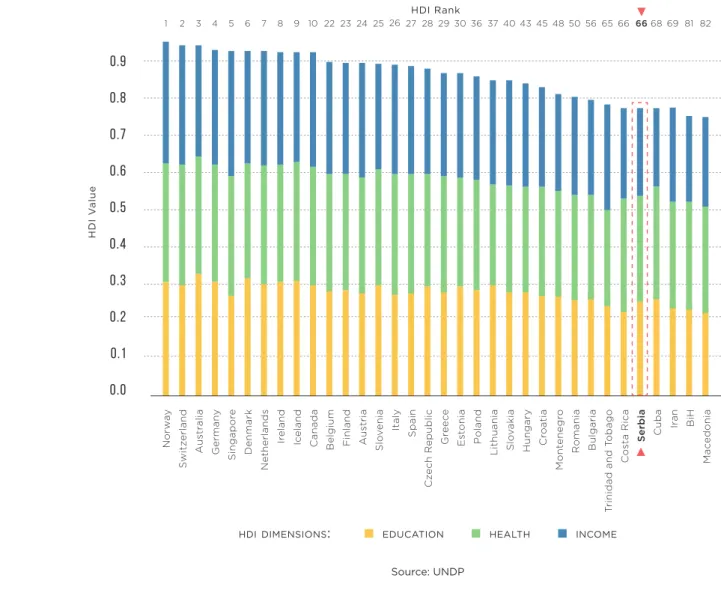
over the past few years, serbia has ranked 66th in the world in terms of human development – lower than any EU member country and Montenegro, and above Macedonia and Bosnia and Herzegovina (B&H). There is little doubt that this ranking is substantially lower than such comparisons would have shown thirty years ago. Serbia’s human development imploded in the 1990s and has not been able fully to recover since, because of the very gradual recovery and transformation of the economy. Hence, Serbia has not been able to keep pace with the countries it compares itself with. This matters to our analysis because the challenges and opportunities that Serbia faces often differ from what would be expected in a country that arrived at a similar level of human development while never having been better off. It also matters because it frames Serbia’s citizens’ expectations, affecting both their wellbeing and economic behaviour.
• Serbia’S human development lieS
Well beloW Its PotentIal.
Figure 2. Serbia is one of the lowest ranked European countries in terms of the level of human development, as measured by the HDI.
HDI V alue 82 81 27 4548 8 23 36 66 4 6 10 25 29 40 56 68 2 3 5 7 9 22 24 26 28 30 37 43 50 65 66 69 1 A us tria Trinidad and T obago Netherlands Lithuania P oland BiH German y Spain Cuba Canada Mont enegr o S witz erland Norw ay Slo venia C os ta Rica Ir eland Es tonia Hungary Mac edonia Singapor e Cz ech R epublic Ir an Belgium Romania A us tr alia Italy s erbia Ic eland Slo vakia Cr oa tia Denmark Gr eec e Finland Bulgaria
o.9
0.8
0.7
0.6
0.5
0.4
0.3
0.2
0.0
0.1
Source: UNDP HDI Rankeducation health income hdidimensions:
• it iS in the income dimenSion of
tHe HdI coMPonents tHat serbIa
ranks loWest.
In terms of a decent standard of living (gdP pc), serbia ranks the lowest (88th), mostly because it has the lowest total employment level in europe. Employment among the working-age population (15-64 years) in Serbia is only 55%, compared to 67% for the EU28 and the NMS on average. In addition, too many jobs in Serbia are of low quality (more than a quarter (700,000) of the total employed (2,719,000) hold informal jobs), and quantity (e.g., low work intensity). The productivity of the employed part of the population is low but closer to that of comparable countries. For example, Serbia’s total production per formally employed is higher than Bulgaria’s, but because its employment rate is 15% (8 pp) higher and its vulnerable employment is 68% (18 pp) lower, Bulgaria’s GDP per capita is 38% higher as well. If Serbia had had the same employment level as Bulgaria in 2015 (63.5% of working-age population) and a similar employment structure – keeping Serbia’s current productivity for each employment segment unchanged – her GDP/capita would have been higher than Bulgaria’s.
Figure 3. Serbia’s GDP per capita (4,905 euros) is among the lowest in Europe, and it stands nearly 40% below that of Bulgaria, the lowest among EU member states.
serbia
4.904
nms average12.966
bulgaria6.751
slovakia14.943
romania8.616
czech republic16.712
croatia11.120
eu28
average25.783
Source: Eurostat, SORS
gdp per capita
(
eur),
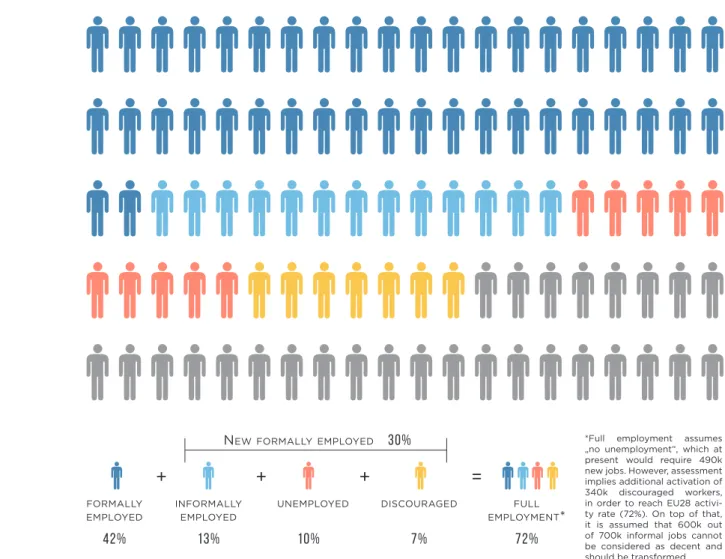
serbia and selected countriesFigure 4. The key problem is an exceptionally low total employment level, and especially of the decent kind.
7%
10%
13%
42%
72%
discouraged unemployed informally employed formally employed full employment*30%
newformallyemployed informally employed unemployed &inactive formally employed+
+
=
working-age populationFigure 5. Full employment in decent jobs requires an increase of almost 75% (1.45 million) in the current number of formal jobs – to employ the unemployed, the discouraged, and those working informally.
Source: CEVES’ calculations on Eurostat and SORS data. Source: Eurostat, SORS, World Bank
nms 11
-
employment 66% ofworking-age | vulnerableemployment 8% ofworking-ageczech republic
-
employment 72% ofworking-age | vulnerableemployment 9.9% ofworking-ageserbia - employment 55.2% ofworking-age | vulnerableemployment 14.6% ofworking-age
romania
-
employment 61.6% ofworking-age | vulnerableemployment 17.2% ofworking-agebulgaria
-
employment 63.4% ofworking-age | vulnerableemployment 5.4% ofworking-ageeu 28
-
employment 66.6% ofworking-age | vulnerableemployment 7.9% ofworking-age*Full employment assumes „no unemployment“, which at present would require 490k new jobs. However, assessment implies additional activation of 340k discouraged workers, in order to reach EU28 activi-ty rate (72%). On top of that, it is assumed that 600k out of 700k informal jobs cannot be considered as decent and should be transformed.
+
+
+
=
• economic growth haS recently
accelerated, led by a sMall but
coMPetItIve and exPort-orIented
neW econoMy.
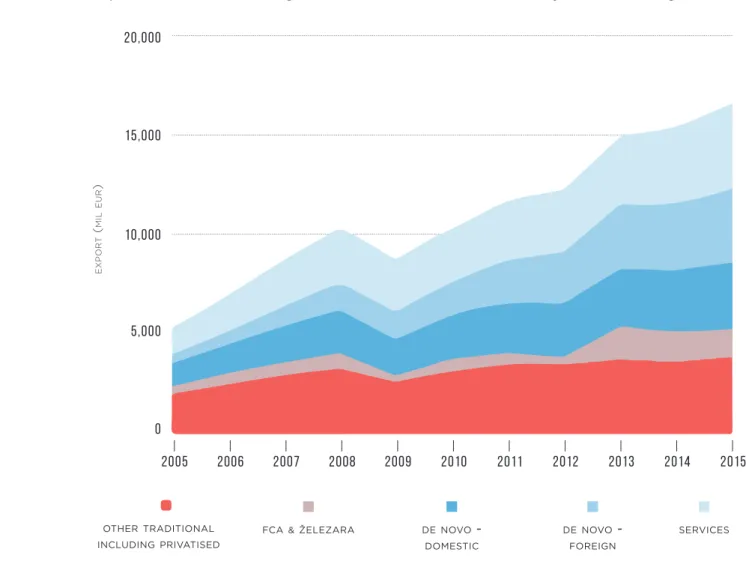
serbia’s economic structure can be divided into two segments: traditional and new, which exhibit different business paradigms and performance. By “traditional economy”, we denote the untransformed state-owned or socialist-owned sector. By “new economy”, we mean the private corporate sector – including fully transformed privatized companies. The new economy emerged gradually from the transformation of a small share of the resources built in socialist times and new investments. While the comparative productivity of the new economy that has developed since the 1990s is undoubtedly closer to historical expectations, it is the high level of inactivity or low-intensity employment, as well as the low productivity of the large and slowly transforming traditional economy, that pull Serbia’s GDP down.
trends since the global crisis are indicate that serbia has finally turned towards export orientaton while the exit of unsustianable tradition companies has recently accelerated. The new economy has finally reached a sufficient size to determine the pace of the country’s growth. It is now supported by the strong growth of the European economy and a balanced macroeconomic framework, after the recent fiscal consolidation. The new economy’s exports are based primarily on the rich land and agricultural tradition of Serbia, mid-technology industrial know-how, and IT and other knowledge-based services.
Figure 6. Only exports of the new economy grew throughout the period, reaching 93% of total exports in 2015 and indicating that the transformation of the economy is in its final stage.
2005
0
5,000
10,000
15,000
20,000
2008
2011
2006
othertraditional includingprivatisedfca&železara denovo -domestic denovo - foreign services
2009
2012
2014
2007
2010
2013
2015
Source: CEVES’ calculations on Cube Administration
e x p o r t ( m il e u r )
• Serbia’S StrongeSt human
devel-oPMent asPect Is Its
educatIon-al attaInMent (55tH), Measured by
quantIty – years oF scHoolIng.
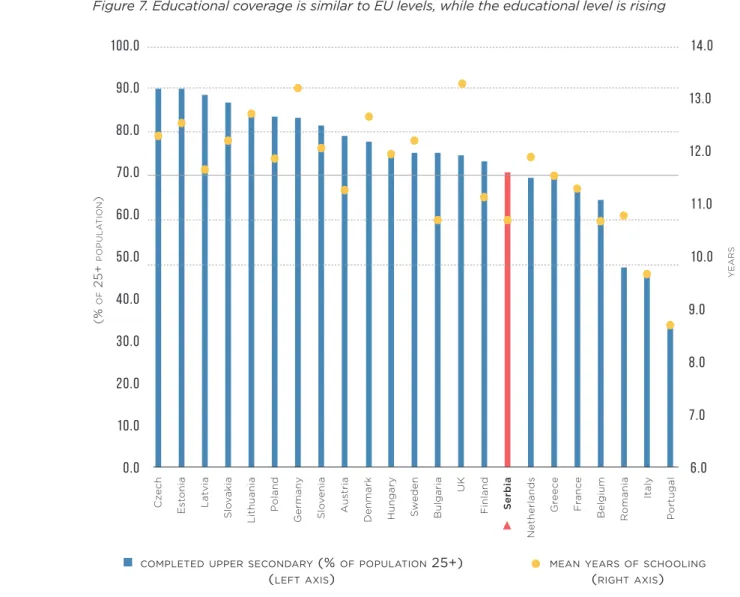
thanks to greater educational system coverage and demographic changes, the educational level is rising. In 2015, about 71% of people over 25 years of age completed at least upper secondary education – 77% of men and 65% of women. At this level, Serbia still ranks below the NMSEU (81.7%) but is catching up with them.
Cz ech Bulgaria German y R omania Belgium Slo vakia Denmark Es tonia UK Slo venia Fr anc e P ortugal Lithuania Netherlands Hungary La tvia Finland A us tria Italy P oland Gr eec e S w eden
0.0
10.0
20.0
30.0
40.0
50.0
60.0
70.0
80.0
90.0
100.0
Figure 7. Educational coverage is similar to EU levels, while the educational level is rising
6.0
7.0
8.0
9.0
10.0
11.0
12.0
13.0
14.0
Source: UNDP, World Bank, SORS
completeduppersecondary (% ofpopulation 25+)
(leftaxis)
mean yearsofschooling
(rightaxis) s erbia ( % o f 2 5 + p o p u l a t io n ) y e a r s
• the quality of education doeS
not Fully PrePare youtH For
today’s labor Market – eItHer as
eMPloyees or as entrePreneurs.
citizens of serbia are, on average, still less educated than the citizens of new eu member countries. Serbia’s participation in PISA 2012 shows that the country faces problems with educational outcomes. For example, in mathematics, Serbia ranked 42nd in a group of 65 countries, according to OECD data. With such a ranking, Serbia was well below all PISA-participating European countries except for Bulgaria, Romania, and Montenegro.
the education system has not yet adapted to the major changes of the 21 century, although the recent expansion of It curricula is an important step in the right direction. The fundamental problem is that curricula are still designed for old-fashioned rote learning, rather than to teach students to think – which leads to the issue of either a high share of unemployment, or poor quality and unsustainable employment. Examples of schools that have succeeded to adapt curricula to labor market requirements and needs are limited, and progress is colud be faster – too many students are trained in skills that are not employable any more. In the current economic environment this is even more pronounced, since the chances for youth to be employed are three times lower, while the quality of jobs for those who are employed often does not meet the criteria of the definition of “decent work”. The unemployment rate among students who have graduated is around 42% in Serbia, while almost a half of employed youth are informally employed. According to
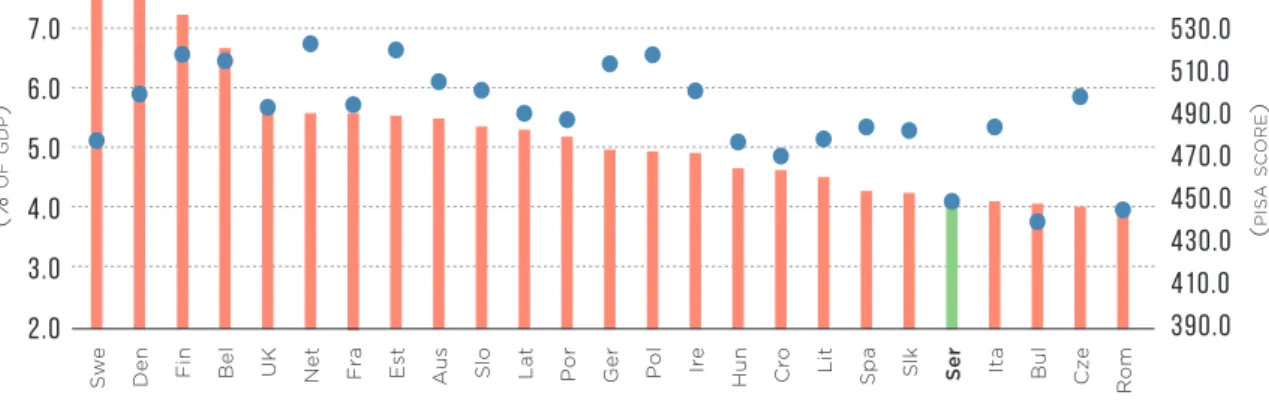
Figure 8. Education outcomes are still weak – with low expenditure likely playing an important role.
the official Labor force survey in Serbia, 20.8 % of employed youth are estimated to be engaged on a part-time basis. On the other hand, 18.8% of youth are over-qualified for the work they perform.
one of the key reasons for the relatively weak outcomes could probably be found in the low level of public expenditure for education. In Serbia, this expenditure is around 4.2% of GDP, which is significantly lower than the EU average (5.2% of GDP) and NEUMS average (4.6% of GDP). Bearing in mind that expenditure for higher education is similar to the EU average, and that since private primary and secondary education in Serbia has not yet become fully developed, we can conclude that total educational expenditure (both private and public) to even greater extent negatively deviates from the EU average. The only comparable countries that spend less than Serbia are the Czech Republic, Bulgaria and Romania.
2.0
3.0
4.0
5.0
6.0
7.0
390.0
410.0
430.0
450.0
470.0
490.0
510.0
530.0
Source: UNDP, World Bank, SORS
gov. expenditureoneducation (% ofgdp) - (leftaxis) pisa (mathematics) - (rightaxis)
S
we Den Fin Bel UK Fra Est Au Slo Lat Ire Hun Cro Lit Spa ser Ita Bul Rom
s C ze Net Po Slk r Ger Po l ( % o f g d p ) ( p is a s c o r e )
• health iS ranked low, eSpecially
consIderIng tHe strong yugoslav
legacy, reFlectIng overall
InstI-tutIonal Weaknesses.
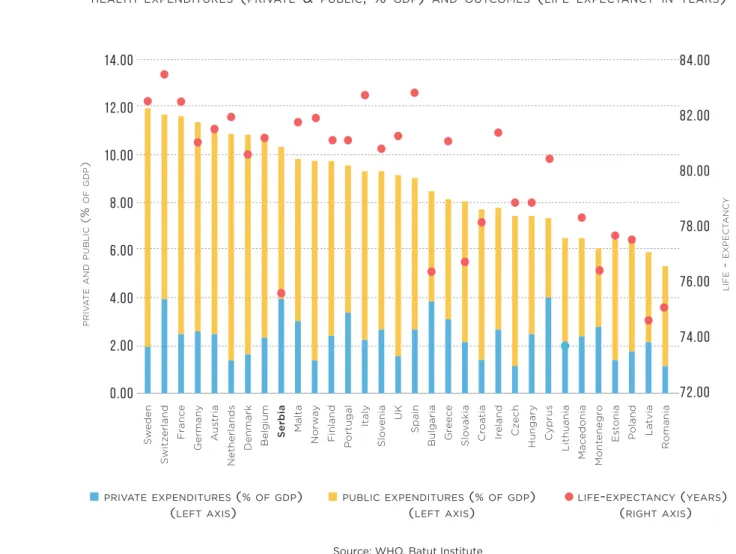
serbian citizens’ health is poorer (69th) than expected given the level of socio-economic development, funding and the strong legacy in the health care system. Among the key indicators of overall health attainment, the most comprehensive and one of the most telling indicators of the general health status of a country’s population is the life-expectancy indicator. According to WHO estimates, the life life-expectancy at birth indicator in Serbia in 2015 was 75.6 years, which was shorter than that of any EU member state or other former Yugoslav republic, except for Romania, Bulgaria, Latvia and Lithuania. One of the highest ‘out-of-pocket’ health care payments by citizens, an unnecessarily high mortality rate, a lack of strategic documents and the unresolved role of the private sector paint a picture of unresolved systemic issues.
the infrastructure of the health system changed little over several decades despite market changes in demographics and in the health prioriteies, resulting in limited institutional effectiveness. For example, Serbia’s health care system has performed well with regard to infectious diseases based on systems established decades ago. On the other hand, systems and programs for the prevention of non-communicable diseases have not been developed commensurably. Cancer, diabetes and heart diseases mortality rates are high, even in situations where highly effective prevention measures are available.
Figure 9: There is a marked disproportion between Serbia’s total level of spending (% of GDP) on health, by the government and out-of-pocket, and the level of its citizens’ life expectancy.
S w eden P ortugal Cyprus Denmark Gr eec e La tvia German y UK Mont enegr o Malta Ir eland S witz erland Italy Lithuania Belgium Slo vakia R omania A us tria Spain Es tonia Norw ay Cz ech Fr anc e Slo venia Mac edonia s erbia Cr oa tia Netherlands Bulgaria P oland Finland Hungary
14.00
84.00
12.00
10.00
82.00
8.00
80.00
6.00
78.00
4.00
76.00
2.00
74.00
0.00
72.00
health expenditures
(
private&
public, %
gdp)
and outcomes(
life expectancy in years)
Source: WHO, Batut Institute
privateexpenditures (%ofgdp)
(leftaxis)
publicexpenditures (%ofgdp)
(leftaxis)
life-expectancy (years)
(rightaxis) l if e -e x p e c ta n c y p r iv a t e a n d p u b l ic ( % o f g d p )
• poverty and inequality remain
HIgH, due to tHe loW eMPloyMent
level and loW re-dIstrIbutIve
eF-Fect oF FIscal PolIcIes.
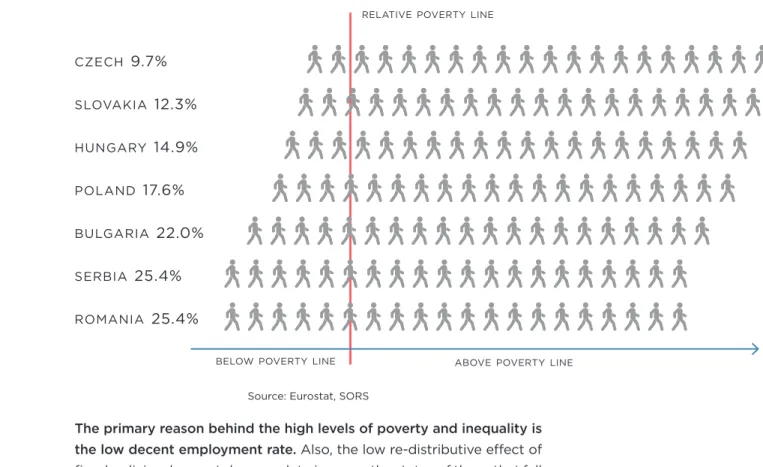
relative poverty in serbia is among the highest in europe, leaving many people behind. As much as 25% of people in Serbia earn less than 60% of the median income. Absolute poverty is also high, since as much as 7.3% of the population, or about half a million, is estimated to fall below the conservatively set absolute poverty line in 2016. Still, it is important to note that there are some positive trends. In the past ten years the more extreme measure of poverty – the population whose consumption falls below 80% of the poverty line—did halve, from 4% to 2%. Also, measures of poverty based on access to consumption put Serbia in a better position. Measured by material deprivation in dimensions such as the level of education, health and standard of living (access to electricity, drinking water, sanitation, living space, access to information – radio, tv, telephone), the poverty rate in Serbia amounted to 19.5% in 2016, which is better than a few EU member countries (such as Greece, Bulgaria, and Romania), and has been gradually declining since 2010. The rate of inequality is similar to European averages, but not improving, as recent research has indicated
Figure 10: Every fourth person in Serbia is below the relative poverty line (i.e., earns less than 60% of median income) – one of the highest shares in Europe.
the primary reason behind the high levels of poverty and inequality is the low decent employment rate. Also, the low re-distributive effect of fiscal policies does not do enough to improve the status of those that fall behind. Social transfers reduce inequality to a lesser extent than in the EU: social assistance and child allowances are only 0.6% of GDP vs the average of 1.1% of GDP in EU countries, while pensions, which amount to a very large share of GDP (11.5% in 2016) have limited redistributive effects because they themselves are unequal, and not universal.
czech
9.7%
slovakia12.3%
hungary14.9%
poland17.6%
bulgaria22.0%
serbia25.4%
romania25.4%
Source: Eurostat, SORS
belowpovertyline abovepovertyline relativepovertyline
• vulnerable population groupS
are PartIcularly aFFected by
Pov-erty and InequalIty oF access.
there are some particularly vulnerable population groups that present particular challenges and deserve special attention with regard to their human development: These are women, persons with disabilities, internally displaced persons, Roma, young people, the rural population and the elderly.
gender equality has been established by law, but inequality still persists, roughly in line or somewhat more than european levels, in employment, earnings, executive power, as well as in the perception of the role of women in the Serbian society. Not only are men more likely to be employed, but there is a more striking gap between men’s and women’s earnings. In jobs with the same characteristics (education, work experience, profession, industry sector, etc.), women earn about 11% less than men. In other words, women in Serbia practically work for free as of the 23rd of November onwards.
the roma remain side-lined in social life as the least educated and poorest social group; they often live in unsanitary settlements and face discrimination in many spheres of social life. Notable advances have been made thanks to the implementation of the previous Roma Inclusion Strategy, and it will be important to keep this same focus in the period covered by the new Strategy: 2016-2020.
although serbia has made some progress, and the rate of that inequality is similar to european averages, in order to achieve the goals of equal opportunities for all categories of the population, as well as the absence of any discrimination, it is important to conduct systematic and continuous monitoring in the period ahead.
• Serbia faceS one of the faSteSt
rates oF PoPulatIon declIne In
euroPe.
We conclude the Hd review with a big and worrisome issue not explicitly covered by the sdgs: the strong negative population growth, which is the most intractable long-term challenge. According to projections, the population of Serbia is likely to decrease by 8% by 2031 and by 12% by 2041 – and substantially more in the region of Southern and Eastern Serbia. This, in and of itself, will affect the sustainability of economic growth as it could increase decent job wages faster than productivity. It is also certain to threaten the sustainability of the pension system. This issue needs to be studied much more and come to be better understood, through comprehensive scenarios.
Figure 11: Assuming that current demographic trends continue, Serbia’s population is likely to shrink by almost 600.000 (8%) citizens by 2030.
Source: SORS population
(2016): 1.868.269
change2031/2016 (%): -11.1
change2041/2016 (%): -17.2
vojvodina population(2016): 1.690.375
change2031/2016 (%): 4.7
change2041/2016 (%): 8.0
belgrade2016
2031
2041
population(2016): 1.947.915
change2031/2016 (%): -11.0
change2041/3016 (%): -15.3
šumadijaandwestern serbia
population
(2016): 1.535.040
change
2031/2016 (%): -15.0
change
2041/2016 (%): -24.6
PIllar II – ProsPerIty
on a green corner oF
tHe Planet: assets and
cHallenges
• Serbia’S SuStainable
develop-Ment oPPortunItIes lIe In tHe very
strengtHs tHat today drIve Its
exPort groWtH.
By export growth drivers, we refer to the economic structures that the country can rely on, or develop, in order to achieve quality growth more quickly, as manifested by existing economic activity and the resources it is based on. These include natural assets such as agricultural land, tourism and mineral resources, capital, physical and other infrastructure, skills and knowledge (human capital), as well as broader concepts of “resources” such as access to capital and global markets, entrepreneurship and social trust.
• Serbia can become an
agri-Food PoWerHouse and lIFt Its
rural areas out oF Poverty and
IsolatIon.
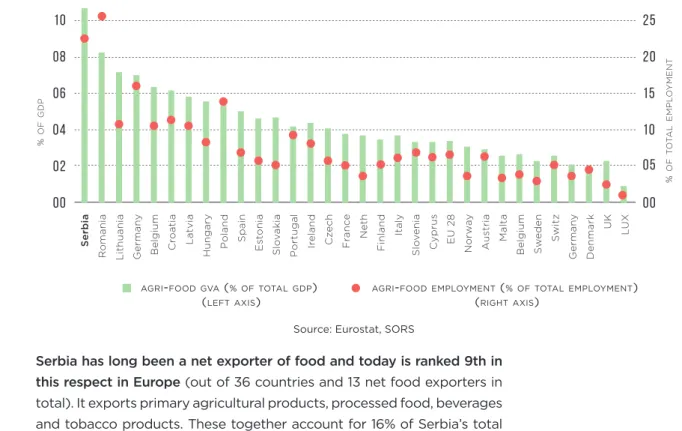
the agri-food sector in serbia is more important to the economy than it is in any other european country, contributing 10.7% of GDP and employing 120,000 people formally, or over 600,000 in total (formally and informally) – almost a quarter of the total employed. This is underpinned by the relative abundance of agricultural land, favorable climate conditions, a long tradition, and deep linkages of Serbia’s population (both rural and urban) to the land. Moreover, inelastic domestic demand saved the sector from deeper destruction in the 1990s and favorable trade agreements give it further support today. Access to land in Serbia is very broad, and while poverty is higher in rural areas, hunger and malnutrition are social safety net and health-related issues; in other words, food security is not a problem for the population.
Figure 12. The contribution of the agri-food sector to GDP and total employment in Serbia is exceptionally high.
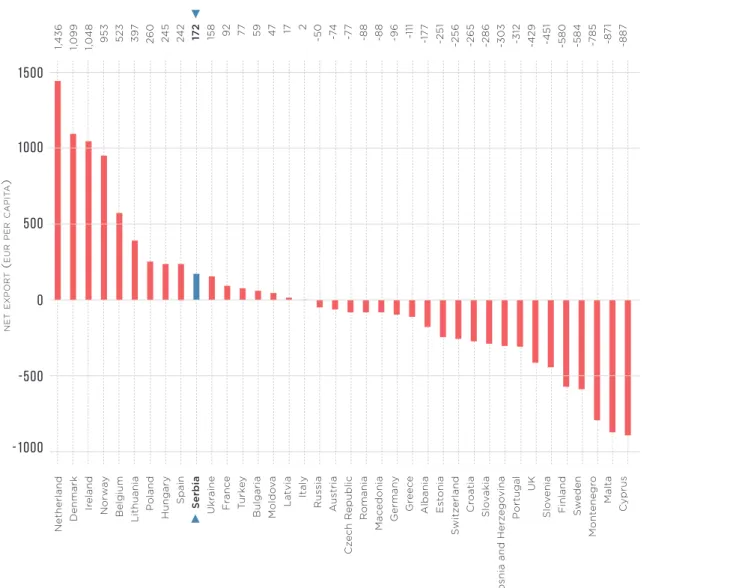
serbia has long been a net exporter of food and today is ranked 9th in this respect in europe (out of 36 countries and 13 net food exporters in total). It exports primary agricultural products, processed food, beverages and tobacco products. These together account for 16% of Serbia’s total exports of goods in 2017 and have shown a tendency to be strongly competitive in recent years. Since 2009, agri-food exports have expanded by 1.325 million euros, 70% of which was due to expanding market share in more than 60 countries (960 million euros, 45% of which was due to new market share, excluding tobacco products). However, around two-thirds of this expansion has come from just five low value-added agricultural products: corn, wheat, raspberries, apples, and animal feed.
s erbia Ir eland La tvia Slo venia UK German y Neth S w eden Es tonia Norw ay R omania Cz ech Malta Hungary C yprus LU X Belgium Finland S witz Slo vakia A us tria Lithuania Fr anc e Belgium P oland Spain EU 28 Cr oa tia Italy Denmark G er m an y P ortugal
00
00
02
05
04
10
06
15
08
20
10
25
agri-foodgva (%oftotalgdp)
(leftaxis)
agri-foodemployment (%oftotalemployment)
(rightaxis)
Source: Eurostat, SORS
% o f g d p % o f t o ta l e m p l o y m e n t
Figure 13. Serbia is among the top 10 European net exporters of agricultural and food products. the potential of the agri-food sector to expand decent employment needs to be further explored but it is undoubtedly large – on the condition that some important challenges are overcome. The key challenges that need to be tackled are the fragmentation of land and the characteristics of food processing, which tends to be carried out mostly by small to medium-sized enterprises (SME). Serbia’s average yields per hectare of cultivated land are 37% lower than the EU average, but this is because 70% of the landholdings are smaller than 5 hectares and further fragmented into, on average, four to five parts. Most of these farms use obsolete traditional methods, or marginal engagement of family labor. Many of them are elderly. In addition, 11% of arable land lies unused (out of which 80% south of Vojvodina).
at the same time, serbia has a growing number of highly productive farms and companies, especially in the fruit and vegetable sector — such as Van Drunnen (dried fruits), Inter-funghi (dried vegetables), Marbo (canned vegetables) and Nectar (juices). If a substantial part of the former type of agriculture producer is transformed into the latter kind, Serbia has great scope for adding value and increasing its productivity. The challenge is less on the production side, where relatively small farms and businesses can be used effectively to reduce poverty and generate employment. As the Italian example shows, the shortcomings can be overcome with cooperation. However, on the side of market management, it is imperative that Serbia become able to consolidate its presence on global markets, under terms that favor its producers.
Source: CEVES’ calculations on SBRA data
Netherland n e t e x p o r t ( e u r p e r c a p it a ) 1,436 Tu rkey 77 Rus sia -50 Belgium 52 3 R omania -88 Slo venia -451 Norw ay 953 Slo vakia -286 Spain 24 2 Bulgaria 59 Albania -177 Denmark 1,099 La tvia 17 S witz erland -256 Lithuania 3 97 Mac edonia -88 Finland -580 C yprus -88 7 Malta -87 1 Mont enegr o -7 8 5 S w eden -584
Bosnia and Her
zego vina -3 03 s erbia 172 Moldo va 47 Es tonia -251 Ir eland 1,048 A us tria -74 Cr oa tia -265 P oland 260 Hungary 24 5 German y -96 Gr eec e -111 Cz ech R epublic -7 7 UK -429 P ortugal -312 Fr anc e 92 Ukr aine 158 Italy 2
-1000
-500
0
500
1000
1500
•
a
Strong
engineering
and
MetalWorkIng tradItIon Is gIvIng
rIse to a recovery In tHe MId- and
MId-to-HIgH level tecHnology
IndustrIes.
serbia has the engineering/technical skills to underpin the development of a productive, modern, high-income generating industry. Know-how and skills underlie the current fast growth of some mid-level technological manufacturing industries, generating decent jobs based both on foreign investment and a vibrant — if small — SME community.
• Not surprisingly, more than 40% of Serbia’s merchandise exports is carried out by large foreign direct investment (FDI) companies. The most convincing comparative advantage is exhibited in the fast-growing rubber and plastics (R&P) industry, with exports by large, well-established foreign companies (Michelin, Cooper Tire). In addition, companies producing electrical equipment and machinery
— such as home appliances (Gorenje), wind generators (Siemens), and engine parts (Albon/Agena) – have also exhibited a high level of competitiveness. Despite being very large exporters, FDI companies in the apparel, automobile and steel industries are still creating comparatively little added value. They have been the recipients of massive government subsidies, and while the value added in the exports of these industries has certainly been increasing, there is no clear sign of sustained growth in the exports of any of these sectors. • Domestically owned SMEs have also been able to find their place on international markets, with a share of 25% of total merchandise exports (overwhelmingly by newly started companies) and well over a half of that is made by small or micro firms. About a third of domestic SME exports consist of agri-food products; the rest comes from all industries, but with more noticeable shares for rubber and plastics, fabricated metal products, machinery, and furniture and wood products.
serbia also faces limitations that would need to be very carefully addressed to ensure quality growth. High quality technical and experienced skills are not abundant, while process and market management skills are, in fact, rather limited. Together with the limitations faced by the largely SME domestic economy – i.e., the lack of access to capital and know-how, as well as internal organizational and motivational limitations — there is a real risk that these industries will continue to employ only a relatively small share of the total workforce. Whether their expansion is sustained and whether they generate a significant number of decent jobs critically depends on the effectiveness of Serbia’s education and science services as well as the society’s/government’s capacity to attract quality foreign investment and support the sustained growth of its SMEs. Critical in this regard is greatly improving the business environment.
• Some very highly-Skilled
gra-duates tHat stay In serbIa are
gIvIng rIse to a HIgH-knoWledge
content servIce Industry.
a particular opportunity for serbia to catch up exists in the high-knowledge content service and intangible creative products industries, especially in the context of Industry 4.0. It is significant that a larger share of Serbia’s economy is comprised of these products/services than in Europe on average. Export of these products & services has been growing by 10% annually since 2009, while net export growth has been particularly high from 2013 (annual growth rate of 32% from 2013 to 2017). Professional services and especially high-tech knowledge, largely computer programing, have been particularly competitive and are growing fast. By 2011, this segment began noticeably to affect the total, especially net service exports. This is clearly because Serbia’s highly trained graduates have less opportunities to obtain employment in other industries. However, it also represents an undoubtable comparative advantage. The question is how far this industry can spread and absorb the currently unemployed or under-employed labor? This potential has not, to our knowledge, been gauged yet. It is clear, nevertheless, that the sustained expansion of these services and products critically depends on the effectiveness of Serbia’s education and science services as well as on policies and collective actions that can ensure that exports shift from a low-wage to high-productivity basis.
Figure 14b. Domestic enterprises — specially small and medium ones, significantly contributed to export growth of majority of manufacturing sectors.*
* Manufacturing of motor vehicles and basic metals is excluded from this observation.
Source: CEVES’ calculations on SBRA data
Figure 14a. Export growth of mid- and mid-to-high level technology industry has been dynamic since the crisis.*
4500
4000
3500
3000
2500
2000
1500
1000
500
0
e x p o r t ( m il e u r )2005
2006
2007
2008
2009
2010
2011
2012
2013
2014
2015
wood&furniture fabricatedmetalproduct machinery&equipment oil&chemicals pubber&plastics
electrical&electronical equipment
year
wood&furniture fabricatedmetalproducts machinery&equipment oil&chemicals pubber&plastics electrical & electronicalequipment
600
500
400
300
200
100
0
exportgrowth (2009-2016, mileur) domestic foregin ownership 85% 81% 60% 59% 74% 24% 75% 41% 40% 26% 19% 15%
Figure 15. The export of services – especially computer programming – is growing fast.
0
100
200
300
400
500
600
2007
2008
2009
2010
2011
2012
2013
2014
2015
2016
• a multitude of green growth
oPPortunItIes lay unexPloIted
and could ProvIde tHe edge
needed to lIFt sustaInably serbIa’s
develoPMent to a HIgHer level.
serbia is moderately rich in non-mineral natural resources that offer much needed, mostly green, development opportunities, particularly for rural areas. In particular, Serbia has a reasonably large and relatively low-quality forest cover, plentiful water resources (although 92% comes from external flows, making this resource vulnerable) and quite rich geothermal resources.
These lay the foundations for several sources of increased and green income. Income from the growing rural tourism could be increased substantially further if it was “greened”—relying on increased protection of Serbia’s substantial biodiversity, on ethno-content connected to sustainable agriculture content, and on the sustainable exploitation of geothermal waters (spas). Furthermore, the development of renewable energy sources—particularly, biomass from agriculture and forests, and solar energy—could boost both economic growth and stakeholder cooperation within local communities, increasing their social, economic and environmental resilience.
Source: CEVES’ calculations on NBS data
computer programming serviceofrepair andmaintenance scientificresearch anddevelopment managment consultancy activities warehousingand supportactivitiesfor transportation art, entertainment andrecreation knowledgeintensive financialservices processingservices publishingservices other accommodation e x p o r t ( m il e u r )
organic, or at least natural, farming of land, is also a green way to substantially increase the value of serbia’s agri-food industry, and its developmental potential needs to be studied further. It is likely that it would increase the environmental sustainability of agriculture and reduce chemical pollution of water. Most importantly, it may be a way to increase the economic sustainability of cultivation on Serbia’s very small farms. Also, while the use of GMO seeds and products is regulated so as to facilitate a very belated membership in the WTO, Serbia’s non-GMO food tradition and capacity needs to be harnessed for increased export value-added: this primarily refers to cereal- and oil-based products - fodder, soybean oil or other segments of the mill and confectionery industry.
better management and policy coordination are much more important to improved exploitation of natural resources than increased financing, although the latter is more often cited as a need. In particular, there is almost no integrated management of water and forest resources, although an integrated approach to each, and coordination between the two, could go a very long way in improving outcomes across a broad range of issues—from climate mitigation, to water quality, biodiversity and non-agricultural land use. Only 6,8% of Serbia’s territory is under protection (Slovenia has 53.6%, Croatia 37.7%, Macedonia 9.7%, Montenegro 4.1%, B&H 1.3%). Just to illustrate the potential of better environmental management — total value of fly-fishing tourism in upper Soča region in Slovenia (population around 5.000) is 2 million EUR every year. In addition, an important problem is that the majority of Serbia’s natural resources are managed by public enterprises. Their management suffers from well- known problems of efficiency and, of great importance in this case, lack of transparency and participation. Moreover, environmental sustainability is not one of their major objectives.
• eu environmental regulationS
regardIng transParency, IMPact
assessMent, and tHe cIrcular
econoMy Have largely been
ad-oPted, but are all too oFten not
IMPleMented.
serbia’s eu membership aspirations set the highest standards globally for its environmental quality. It is well understood that Serbia may not have the financial means to implement them in the near future. However, much progress can be attained, as well as more funding secured, by a more consistent and participatory monitoring of the quality of air and water, and environmental impact assessments, and identification of polluters. While the necessary regulations are mostly in place, environmental impact assessments need to be conducted more thoroughly, be of higher quality, and be treated consequently. This is particularly true of licensing the construction of mini-hydroelectric power plants which is threatening the existence of 350 km of rivers and biodiversity in them, most of them in scenic, some even protected, areas. Only a small number of industrial polluters treat their waste waters, and by far most of the large polluters are actually under state ownership (the thermal power plants, the mines around Bor and Sjenica as well as Kolubara). Finally, the legacy of historical pollution to be cleaned is huge.
• Serbia waSteS energy that could
be Put In tHe servIce oF
sustaIn-able develoPMent as Well as
contrIbute to MItIgatIng clIMate
cHange.
decisive action to manage its energy resources more deliberately and economically would contribute to a broad array of development goals in serbia as well as improve its energy security. Serbia’s energy efficiency, at half the EU average level, is lower than any EU member country. In other words, Serbia could maintain its present economic performance and human development while using about half as much energy as it uses today. Yet, contrary to widespread belief, Serbia is not an energy rich country. The hydrocarbon reserves on which it presently relies for about 60% of its energy consumption will be depleted soon after 2030. Serbia does not have a clear strategy for dealing with this problem at present. Whatever strategy Serbia chooses to take, it will involve serious hikes in electric energy prices, to pay for imports or for replacement capacity. The longer that Serbia delays determining this strategy, the steeper the price hike will be, the more crucial it will be to straighten the system for safeguarding the most vulnerable segment of the population from it.
Figure 16. Serbia has the lowest electricity price and the second highest energy intensity among comparable countries.
Bosnia and Her
zego vina P oland Lithuania Belgium German y Ir eland Finland Greec e Tu rkey Hungary Fr anc e Spain s erbia Netherland Italy Slo venia R omania Malta Es tonia EU 28 Albania S w eden Cr oa tia C yprus Bulgaria Norw ay Unit ed Kingdom Slo vakia Mont enegr o P ortugal Cz ech R epublic Aus tria Denmark Lux embour g Mac edonia La tvia
0.0
0.00
1.0
2.0
3.0
0.05
7.0
0.25
6.0
0.20
5.0
0.15
4.0
0.10
8.0
0.30
9.0
0.35
energyintensity (leftaxis)electricalenergypriceforhouseholds (eurperkwh)
(rightaxis)
certainly, an avenue that deserves urgent and open investigation is the potential for increased reliance on renewable energy resources (rer). These are currently assessed conservatively, under the assumption of the continued absence of structural change in the electric energy production/distribution system over the medium to long term. In view of the expected depletion of domestic hydrocarbons, and their unlikely full replacement from Kosovo coal, structural change will happen and needs to be planned and prepared for. In addition to the likely higher potential for wind and solar power than is currently envisaged in the country’s energy strategy, the use of wood as biofuel needs to be carefully explored. On the one hand, generating biomass for renewable energy, including wood, holds great economic potential. On the other, presently much consists of heating based on traditional wood stoves which have negative health effects. Moreover, Serbia does not have institutional systems that ensure the wood consumed is being duly replaced.
• while Serbia’S geoStrategic
PosItIon Is an oPPortunIty, otHer
cross-cuttIng Issues are largely
cHallenges.
serbia’s very favorable geostrategic position with a tradition of cultural ties and entrepot trade, now free trade agreements with the EU but also Russia and the SEE region represent a major opportunity. It could be better supported by the transport infrastructure, which is, nevertheless, not quite a limitation to growth.
on the negative side, the culture, and particularly the public administration, are not very friendly towards entrepreneurship. There is an overall low level of social capital and mutual trust. Together with the low predictability and high costs of the regulatory environment (more in the next chapter) all together these represent substantial obstacles to the thriving entrepreneurship and investment needed to accelerate Serbia’s development. Finally, neither the government nor general public have yet begun to promote awareness and implement regulations concerning the need for more sustainable production and consumption patterns overall, as well as to mitigate and adapt to climate change. And yet, these are not only good for the environment, but for economic sustainability over the longer run.
PIllar III – InstItutIonal
caPacIty and PartnersHIP
serbia’s values and aspirations with regard to institutional and political development are firmly framed by its european union accession path. The reforms envisaged are not only about aligning with the Acquis, which most often determines rules about “how” something can, or cannot, be done. They are also about alignment with European values. European values set the highest goals regarding democracy, fundamental freedoms, the rule of law, institutional quality, and peace and security. The EU’s accession priorities for Serbia in these areas, and their mapping into the targets under SDG 16 are shown on Table 1. It can be seen that the EU accession targets can be viewed as a maximum-standard interpretation of SDG 16.
Progress on attaining the entire list of institutional goals is monitored by the European Commission (EC) in its annual Progress Reports. This is a complex exercise that assesses progress in outcomes as well as the reform steps planned to accomplish them. It is a comprehensive effort that takes very significant resources and Serbia is fortunate to have the EC investing in it.
• the eu’S prioritieS for Serbia’S
accessIon In tHe PolItIcal and
InstItutIonal realM aMount to
goal 16 natIonalIzed In lIne WItH
tHe HIgHest global standards.
sdg 16 – targets
SDG Target 16.7
Ensure responsive, inclusive, participatory and representative decision making at all levels
Strengthen democratic institution oversight (especially by the parliament); strengthen CSOs as well as their cooperation with public institutions;
Ensure fundamental rights, protection of minorities (Roma, LGBTI persons); improve access to justice; implement antidiscrimination policies; improve transparency of EU media standards - media freedom and pluralism.
Improve judicial independence, impartiality and efficiency; strengthen professionalism of judges, prosecutors and court administrators through merit-based criteria; reduce the duration of proceedings; Improve the consistency of jurisprudence.
Implement an effective system of prevention and fight against corruption, enable a legal framework; strengthen the capacities and efficiency of the relevant bodies (especially the Anti-Corruption Agency); implement an effective system for the protection of whistle-blowers. Implement an integrated approach to organized crime; improve the capacity of policy for investigations; implement a centralized criminal intelligence system; improve inter-agency cooperation; enhance the protection of witnesses in organized crime cases and victims of human trafficking; implement an integrated border management (IBM) approach and improve risk assessment, data collection and databases systems.
Enhance the coordination of public administration (PA) reforms and establish a policy coordination, planning and development system; put into place a civil service system based on merit; improve PA governance and service delivery; enhance macroeconomic stability through multilateral surveillance and implementation of the Economic Reform Programme; reform public financial management; reform customs, tax administration, and statistics to meet acquis requirements.
SDG Target 16.10
Ensure public access to information and protect fundamental freedoms, in accordance with national legislation and international agreements
SDG Target 16.3
Promote the rule of law at the national and international levels and ensure equal access to justice for all
SDG Target 16.5
Substantially reduce corruption and bribery in all their forms
SDG Target 16.1
Significantly reduce all forms of violence and related death rates everywhere
SDG Target 16.2
End abuse, exploitation, trafficking and all forms of violence against and torture of children
SDG Target 16.4
By 2030, significantly reduce illicit financial and arms flows, strengthen the recovery and return of stolen assets and combat all forms of organized crime
SDG Target 16.6
Develop effective, accountable and transparent institutions at all levels
SDG Target 16.9
By 2030, provide a legal identity for all, including birth registration
eu Indicative country strategy Paper for serbia for Instrument of Pre-accession assistance 2014-2020 - expected results
• good inStitutionS matter alSo
In order to better attaIn all tHe
otHer sIxteen sdgs
Most of the institutional reforms are planned in order to establish European values as a way of life — they are goals in and of themselves. However, many of them are also very much needed as an instrument, to create an environment and develop the institutional capacity necessary to put Serbia on a faster and more sustainable development path. Of key importance to this are; 1) Establishing a business environment that is supportive of thriving investment and entrepreneurship. Above all, such an environment requires predictability, the rule of law, including clear rules defining market relations, and stability of policies and regulations; 2) Meaningful policy planning but also stable and consistent policy implementation are needed for the accomplishment of any long-term results; 3) The design of good policies requires transparency and significant stakeholder involvement and participation; 4) Finally, the public administration needs to be capable of delivering the policies that the government may choose to adopt – i.e. it needs a measure of effectiveness.
The above issues have been amply studied and argued, especially in documents linked to the EU accession process and by the World
Bank. according to in-depth expert assessment methods, serbia’s
administrative effectiveness is somewhat above the lower end of the preparedness of new eu member states before they acceded to european union membership. Indices that heavily rely on citizen/ stakeholder perception assess the quality of Serbia’s institutions lower. This may be because Serbia’s stakeholders have higher expectations. However, of particular concern to this exercise are that policy prioritization (at the heart of policy planning), as well as its effective implementation can be particularly difficult even when all the necessary conditions typically assessed by experts—such as regulatory framework and civil service capacity – are present.
• too often the StatuS quo winS
over ProclaIMed PolIcy PrIorItIes.
serbia has real difficulty in setting policy priorities, and there is a risk that this may invalidate the present sdg nationalization exercise, as it so many other plans. Serbia has many strategies and policy planning documents, and most of them tend to present too many issues as priorities to constitute true guidance for policy actions. Actual policy priorities are revealed in policy implementation – when some actions and stakeholders receive more funding and attention than others. However, by this measure, it can be said that major shifts in policies have generally been rare over the past decades, and that few policy priorities stand out as priorities. Nor have policy changes been accomplished through consistent incremental change over several years. Serbia’s development policies have tended to revolve around the status quo: every budget year the departures from last year’s budget have tended to be marginal and/or unsystematic.
the inclination to preserve the status-quo is particularly visible in the provision of public services. Certainly, it is notable that Serbia’s public system structures, both the physical and the organizational ones have changed very little over several decades, even though the demographic, socio-economic and political changes in the meantime have been vast. One reason for the strong entrenchment of the status quo is that those interested in it, or too concerned to risk change, tend to be better organized. Another is possibly lack of clear information and credibility of what could be accomplished through change. all too often public service provision is adjusted to the needs of those providing the services, rather than the needs of the beneficiaries. Take the example of the education system. It has been clear for some time now that secondary school curricula are much too fragmented, that high-school pupils cannot learn well if they have 10-15 subjects per year. Yet, a fundamental change in the way the curriculum is organized is hard to imagine, not least because it would require both a change in the way teachers become qualified to teach particular subjects, and a reduction in the number of high-school teachers alltogether. Similarly, the geographic distribution of the public health, education and court system structures reflect Serbia’s demographic structure of several decades ago much better than the strucutre of today.
this is why it is extremely important that it be clear that the dialogue we propose here is about policy options, about the choices that need to be made. If some policies are chosen, others may need to be abandoned, or postponed. Such a dialogue would help the reform efforts aimed at policy planning and coordination by raising awareness about everything society stands to gain from setting clearer priorities, and following them consistently.
• even when the political will
Is not lackIng, It Is Hard to call
IMPleMenters to account.
However, contrary to widespread perception, difficulties in policy implementation are not always a matter of a lack of political will. On the contrary, the problem is that the implementation of certain complex policies may not be possible unless it is accompanied by a concerted political effort – mobilization, campaigning, and even pressure. In other words, some measure of politicization in Serbia seems to be necessary for complex policy implementation to happen. This is a structural problem that needs to be understood and resolved if Serbia is ever to develop a rules-based, effective, institutional system. We see two reasons for this.
one reason is that it is often impossible to identify clear and feasible accountability for tasks/results. Although the government administration seems to follow a reasonable organizational structure, the regulatory framework and distribution of competences (and tasks)
among them does not match each organizational unit with clear competences. Many institutions, including both government levels, are involved in decision-making, even over non-strategic matters Moreover, none of them quite have the authority, competence, and autonomy needed to take the initiative and full responsibility for the results. Therefore, none can be called to account. The roots of this problem probably lie in the past, when the country was presumably run by highly participatory self-management decision making, yet no formal political bodies were given the authority to actually make decisions and take final actions. These were made by the communist party in the background, through informal, parallel processes.
the second phenomenon is that regulatory practice is highly detailed, prescriptive, and formal. As such, it simply precludes the definition and pursuit of meaningful results. For example, the manager of an organizational unit is not given funding with which to staff his organization and produce results. Instead, the number and profiles of staff that can be hired and most other expenditure decisions he/ she makes are prescribed in great detail with rules and formal criteria. Of course, some such constraints are present in every administration, but in Serbia they are extreme. This releases her or him from making judgments and decisions that could ensure the result is being accomplished.
•
the
capacity
of
Specific
InstItutIons to delIver sPecIFIc
sdg targets sHould be MonItored
as InterMedIate targets.
ultimately, we are interested in identifying instruments/indicators that would help assess trends in the capacity of specific, relevant institutions to deliver results. These could be seen as important elements of the results framework developed to monitor and encourage progress towards the accomplishment of nationalized SDGs. For example, as seen in these pages, drawbacks in the delivery of education and health services can, among other things, be linked to the institutional inability to change. We might want to measure if there is appropriate organizational change, as an indicator of intermediate institutional capacity and progress towards accomplishing the SDGs in those areas. Or, we might want to support the predictability of the business environment, and hence the accomplishment of GDP growth and employment targets by measuring the consistency with which specific government programs are being implemented.
Such a process would complement the high-level institutional reform monitoring effort conducted every year by the EC, as well as mobilize stakeholders to understand better how their interests are linked with these reforms.