HAL Id: hal-01393465
https://hal.archives-ouvertes.fr/hal-01393465
Submitted on 26 Mar 2019
HAL is a multi-disciplinary open access
archive for the deposit and dissemination of
sci-entific research documents, whether they are
pub-lished or not. The documents may come from
teaching and research institutions in France or
abroad, or from public or private research centers.
L’archive ouverte pluridisciplinaire HAL, est
destinée au dépôt et à la diffusion de documents
scientifiques de niveau recherche, publiés ou non,
émanant des établissements d’enseignement et de
recherche français ou étrangers, des laboratoires
publics ou privés.
nitrogen in the food web after a phosphate enrichment :
modeling of the VAHINE mesocosms experiment
Audrey Gimenez, Melika Baklouti, Sophie Bonnet, Thierry Moutin
To cite this version:
Audrey Gimenez, Melika Baklouti, Sophie Bonnet, Thierry Moutin. Biogeochemical fluxes and fate of
diazotroph-derived nitrogen in the food web after a phosphate enrichment : modeling of the VAHINE
mesocosms experiment. Biogeosciences, European Geosciences Union, 2016, 13 (17), pp.5103-5120.
�10.5194/bg-13-5103-2016�. �hal-01393465�
www.biogeosciences.net/13/5103/2016/ doi:10.5194/bg-13-5103-2016
© Author(s) 2016. CC Attribution 3.0 License.
Biogeochemical fluxes and fate of diazotroph-derived nitrogen
in the food web after a phosphate enrichment: modeling of
the VAHINE mesocosms experiment
Audrey Gimenez1, Melika Baklouti1, Sophie Bonnet1,2, and Thierry Moutin1
1Aix Marseille Université, Université de Toulon, CNRS, IRD, Mediterranean Institute of Oceanography
(MIO), Marseille, France
2Institut de Recherche pour le Développement (IRD), AMU/CNRS/INSU, Université de Toulon, Mediterranean
Institute of Oceanography (MIO) UM110, 98848 Nouméa, New Caledonia Correspondence to:Audrey Gimenez (audrey.gimenez@mio.osupytheas.fr)
Received: 7 December 2015 – Published in Biogeosciences Discuss.: 18 January 2016 Revised: 8 May 2016 – Accepted: 9 August 2016 – Published: 14 September 2016
Abstract. The VAHINE mesocosm experiment in the olig-otrophic waters of the Nouméa lagoon (New Caledonia), where high N2fixation rates and abundant diazotroph
organ-isms were observed, aimed to assess the role of the nitrogen input through N2 fixation in carbon production and export
and to study the fate of diazotroph-derived nitrogen (DDN) throughout the planktonic food web. A 1-D vertical biogeo-chemical mechanistic model was used in addition to the in situ experiment to enrich our understanding of the dynam-ics of the planktonic ecosystem and the main biogeochemi-cal carbon (C), nitrogen (N) and phosphate (P) fluxes. The mesocosms were intentionally enriched with ∼ 0.8 µmol L−1 of inorganic P to trigger the development of diazotrophs and amplify biogeochemical fluxes. Two simulations were run, one with and the other without the phosphate enrichment. In the P-enriched simulation, N2fixation, primary production
(PP) and C export increased by 201, 208 and 87 %, respec-tively, consistent with the trends observed in the mesocosms (+124, +141 and +261 % for N2fixation, PP and C export,
respectively). In total, 5–10 days were necessary to obtain an increase in primary and export productions after the dis-solved inorganic phosphate (DIP) enrichment, thereby sug-gesting that classical methods (short-term microcosms exper-iments) used to quantify nutrient limitations of primary pro-duction may not be relevant. The model enabled us to moni-tor the fate of fixed N2by providing the proportion of DDN
in each compartment (inorganic and organic) of the model over time. At the end of the simulation (25 days), 43 % of
the DDN was found in the non-diazotroph organisms, 33 % in diazotrophs, 16 % in the dissolved organic nitrogen pool, 3 % in the particulate detrital organic pool and 5 % in traps, indicating that N2fixation was of benefit to non-diazotrophic
organisms and contributed to C export.
1 Introduction
Dinitrogen (N2) fixation is the major external source of new
nitrogen (N) for the upper ocean (Gruber and Galloway, 2008; Mahaffey et al., 2005) and particularly in the south-western Pacific Ocean (Raimbault and Garcia, 2008; Moutin et al., 2008), which is recognized as one of the highest N2
fixation area in the global ocean (Luo et al., 2012; Bon-net et al., 2015). While N availability primarily controls au-totrophic plankton growth in low-nutrient low-chlorophyll (LNLC) ecosystems (Moore et al., 2001a; Graziano et al., 1996), the new N sources provided by N2fixation may drive
the planktonic ecosystem from N limitation toward P limi-tation and may potentially affect the magnitude of C fixa-tion and eventually C export through the so called N2-primed
prokaryotic C pump (Karl et al., 2003, 2012). Consequently, it is important to quantify N fluxes to the ocean as well as to study the fate of N newly fixed by diazotrophs (or diazotroph-derived N, hereafter referred to as DDN) in order to under-stand how N2fixation affects nutrient cycles and productivity
Biogeochemical models including N2 fixation have been
developed over the last decades, some of them including di-azotrophic organisms as state variables as described below. In these models, Trichodesmium is the most frequently rep-resented organism since it is the most studied diazotroph and its physiology is well documented in the literature (Moore et al., 2001b; Fennel et al., 2001; Moore et al., 2004; Rabouille et al., 2006). In recent studies, other dia-zotrophs such as unicellular Cyanobacteria (termed UCYN) or diatom–diazotroph associations (termed DDAs) have been implemented in biogeochemical models. This was first done by Goebel et al. (2007), who developed a diagnostic model to assess the relative contribution of three distinct diazotrophs (i.e., Trichodesmium sp. and two UCYN from Group A and Group B – UCYN-A and UCYN-B, respectively), at the tropical North Pacific station ALOHA. More recently, other biogeochemical models including a more complex plank-tonic food web and the contribution of Trichodesmium sp. DDAs, UCYN-A and UCYN-B were developed (Monteiro et al., 2010, 2011), together with models representing Tri-chodesmiumsp., and a general group of UCYN (Dutkiewicz et al., 2012). Although increasing numbers of models in-clude diazotrophic organisms as part of the food web, none of them have yet focused on the fate of DDN throughout the ecosystem. Diazotrophs release part of the recently fixed N2 as dissolved organic N (DON) and ammonium (NH+4)
in the dissolved pool (Glibert and Bronk, 1994; Mulholland et al., 2006). The magnitude of this release (10 to 80 %) is still under debate in the scientific community (Glibert and Bronk, 1994; Konno et al., 2010; Benavides et al., 2013b, a) and seems to depend on the physiological state of the cells (Berthelot et al., 2015a) as well as on exogenous factors such as viral lysis (Hewson et al., 2004) or sloppy feeding (O’Neil et al., 1996). Nevertheless, recent methods coupling
15N
2 isotopic labeling, cell sorting by flow cytometry and
high-resolution nanometer-scale secondary ion mass spec-trometry (nanoSIMS) analyses enable the quantification of the DDN transfer from diazotrophs to specific groups of non-diazotrophic phytoplankton and bacteria, indicating that the DDN released in the dissolved pool is available and actively used by surrounding non-diazotrophic communities (Bonnet et al., 2016a).
The aim of the VAHINE project was to investigate the fate of DDN in oligotrophic ecosystems by deploying large-volume (∼ 50 m3) mesocosms to isolate a water mass with diazotrophs and by combining both field biogeochemical and planktonic diversity measurements and a mechanistic model-ing approach. The New Caledonian (Nouméa) lagoon is con-sidered an oligotrophic ecosystem influenced by oceanic wa-ters inflowing from outside the lagoon (Ouillon et al., 2010). It supports high N2fixation rates (235 µmol N m−2d−1;
Gar-cia et al., 2007), high Trichodesmium sp. (Dupouy et al., 2000; Rodier and Le Borgne, 2008, 2010) and UCYN abun-dances (Biegala and Raimbault, 2008). This site therefore represented an ideal location to investigate the fate of DDN.
The mesocosms were intentionally enriched with dis-solved inorganic phosphate (DIP) to enhance the potential development of N2 fixers in the mesocosms and therefore
amplify N2 fixation fluxes and facilitate the study of DDN
pathways in the planktonic ecosystem. Complementary field approaches were used during the VAHINE project includ-ing a δ15Nbudget to assess the dominant source of N (from NO−3 and/or N2fixation) fueling export production
through-out the experiment (Knapp et al., 2016). Bonnet et al. (2016a) explored the fate of DDN on shorter timescales, investigat-ing the relative contribution of each diazotroph phylotype to direct C export and quantifying the DDN release and its subsequent transfer to different groups of plankton by using nanoSIMS. In the present study, we developed a 1-D vertical biogeochemical model including the representation of Tri-chodesmiumand UCYN diazotrophs of Group C (UCYN-C), which developed extensively during the mesocosm experi-ment (Turk-Kubo et al., 2015). The goal of this study was to enrich our understanding of the dynamics of the plank-tonic food web and the associated biogeochemical fluxes during the mesocosm experiment by providing information that could not be inferred through in situ measurements. We also used the model to track the route of DDN into the different compartments of the ecosystem (diazotrophs, non-diazotrophs, dissolved pool, detrital pool and export).
2 Methods
2.1 The VAHINE experiment
The VAHINE experiment took place in January–February 2013 (austral summer) in the oligotrophic New Caledonian lagoon. Three large-volume (∼ 50 m3, 15 m height) meso-cosms equipped with sediment traps fixed at their bottom were deployed, and the dynamics of the three mesocosms were monitored for 23 days. A full description of the design and deployment of the mesocosms, including the selection of the study site and logistics, is provided in Bonnet et al. (2016b). The mesocosms were enriched with ∼ 0.8 µmol L−1 of orthophosphate (PO3−4 ) on the evening of day 4 to allevi-ate any potential DIP limitation, which is a constant feature observed in the southwestern Pacific (Moutin et al., 2005, 2008), and to stimulate N2fixation. Seawater was sampled
daily in the three mesocosms (hereafter called M1, M2 and M3) and outside (hereafter called lagoon waters) at three depths (1, 6 and 12 m), and the sediment traps and the mate-rial they contained were collected every 24 h by scuba divers. It should be noted that the term “export” used hereafter does not correspond to the material exported throughout the eu-photic zone but to the sinking flux observed in the experi-ment at 15 m depth. The methods used to measure the dif-ferent variables (C, N and P pools and fluxes, chlorophyll a stocks, and plankton abundances) used in the present paper for comparison with the model simulations are detailed in the
companion papers of Berthelot et al. (2015b), Leblanc et al. (2016) and Van Wambeke et al. (2016).
2.2 Mesocosm modeling and hypothesis
The model used in the VAHINE project is embedded in the modular numerical tool Eco3M (Baklouti et al., 2006), which uses mechanistic formulations to describe the biogeochem-ical processes engaged in the dynamics of marine pelagic ecosystems. Eco3M provides high flexibility by allowing its users to remove or add variables or processes to better adapt the model to a specific study. The VAHINE experiment con-sisted in the deployment of three replicate mesocosms in New Caledonia. Each mesocosm was modeled through a 1-D box model with 14 boxes of 1 m height each. Mass transfer between boxes is only allowed through sinking of particulate matter. Until day 10, only the detrital particles were allowed to sink but after this date, 10 % of all the living and non-living dissolved and particulate compartments were allowed to sink. The aim was to represent the setting of the aggrega-tion process and the subsequent intensificaaggrega-tion of the sink-ing process. The aggregation process was indeed supposed to be favored, not only by the reduced eddy fluxes due to the containment of water but also by the release of transparent exopolymer particles (TEPs) as mentioned in Berman-Frank et al. (2016). At the bottom of the modeled mesocosms, the sinking material was accumulated to be compared with the particulate matter collected daily in the traps. Sinking veloci-ties were not measured during the experiment, and the matter collected daily in traps was used to parameterize the sinking velocity . The latter is therefore set at a constant 0.7 m d−1 until day 10 and increases through the polynomial function given by Eq. (1) to reach 10 m d−1at the end of the simula-tion: V = α · t10+β, (1) α =(Vmax−Vmin) tend10−tini10 , (2) β = Vmin−α · tini10, (3)
where V is the sinking velocity, Vminand Vmaxare,
respec-tively, the minimum and maximum sinking velocities (0.7 and 10 m d−1), t is time, tiniis the moment at which the
sink-ing rate starts to increase (i.e., day 10) and tendis the final day
of the run (i.e., day 25). Bonnet et al. (2016b) reported that the VAHINE data revealed that the water column inside the mesocosms was well mixed, probably through natural con-vection at night. This feature is simply modeled through a vertical homogenization of every concentration once a day (at midnight), by imposing the vertically averaged concen-trations in each box. Light irradiance data from the nearest meteorological station (Nouméa airport) were used for the surface irradiance in the model, and a vertical gradient was simulated on the basis of a classical Beer–Lambert law using
the attenuation coefficient found in Morel (1988). When the total N an P pools (Ntotaland Ptotal) were calculated from the
model outputs and compared to those obtained in situ, a sig-nificant difference appeared regarding Ptotal, while the Ntotal
fitted well (data not shown). This gap was mainly due to a DIP concentration that was too high compared to data, in-dicating a non-total consumption by organisms (not shown). To deal with this DIP excess in the system, a loss of DIP was added to the model. The main hypothesis to explain this DIP loss without a similar loss in DIN is the formation of a biofilm of N2-fixing organisms on the walls of the
meso-cosms (see Knapp et al., 2016, for details and DIP consump-tion calculaconsump-tions by the biofilm). Based on the calculaconsump-tions of Knapp et al. (2016), this loss was estimated at 10 % d−1 and was assumed to have no influence on primary, bacterial or export production.
2.3 The biogeochemical model
The biogeochemical model used in this study is based on the Eco3M-MED model used for the Mediterranean Sea (Alek-seenko et al., 2014). The only modification made on this previous version lies in the addition of diazotrophs and N2
fixation process to adapt the model to the VAHINE experi-ment. The model includes eight planktonic functional types (PFTs): four primary producers (autotrophic phytoplankton), three consumers (zooplankton) and one decomposer (het-erotrophic bacteria, BAC). All of them are represented in terms of several concentrations (C, N and P and chlorophyll concentrations for phytoplankton) and abundances (cells or individual per liter; Mauriac et al., 2011).
Phytoplankton was originally divided into two size classes, namely the large phytoplankton (≥ 10 µm; PHYL) and the small phytoplankton (≤ 10 µm; PHYS). The two N2
-fixing organisms are also distinguished by their size, the large one representing Trichodesmium sp. (TRI) and the small one Cyanothece sp. (UCYN-C), which strongly developed in the mesocosms during the experiment (Turk-Kubo et al., 2015). The zooplankton compartment is also divided into the three size classes nano-, micro- and mesozooplankton, which, respectively, represent heterotrophic nanoflagellates (HNF), ciliates (CIL) and copepods (COP). The latter is rep-resented in terms of abundance and C, N and P concentra-tion. This differs from the model described in Alekseenko et al. (2014), in which mesozooplankton is only represented through an abundance and a C concentration. Three nutrients are considered, namely nitrate (NO−3), ammonium (NH+4) and phosphate (DIP). The dissolved organic pool (DOM) is composed of labile and semi-labile fractions of DOC (LDOC and SLDOC) and labile fractions of DON and dissolved or-ganic phosphate (DOP). The refractory oror-ganic pools are not represented. Finally, the detrital particulate matter is repre-sented in terms of C, N and P (DetC, DetN and DetP). All
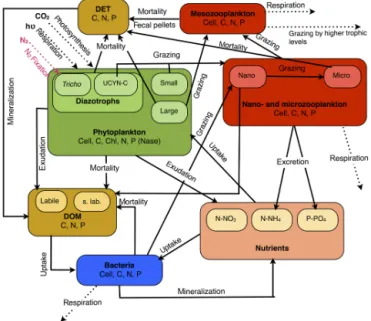
the biogeochemical processes and interactions between the state variables are described in Fig. 1. Except for the new
Figure 1. Conceptual diagram of the biogeochemical model for the 1-D vertical model used in the VAHINE experiment.
parameters associated with the new features of the model as compared to the original one (Alekseenko et al., 2014), the parameters in common between the two model versions are identical.
2.3.1 Initial conditions
Initial values for the model state variables were derived from the in situ measurements averaged over the three mesocosms and the three sampling depths (1, 6, 12 m).
Measured DOM values included the refractory organic matter, while the model only represents the labile (and semi-labile for C) fraction. To extract the labile fraction from the DON data, we assumed that the plateau reached by the DON concentration at the end of the experiment (4 µmol L−1) was equal to the concentration of the refractory DON in this study. Considering that the refractory fraction of DON was stable throughout the experiment and fixed at 4 µmol L−1, from an initial total concentration of 5 µmol L−1 at day 2, the initial labile fraction was therefore estimated at 1 µmol L−1. The percentage of the labile portion over the to-tal DON was calculated and then applied to DOP to estimate the initial concentration of labile DOP. The available DOC fraction (LDOC + SLDOC) was evaluated at 5 µmol L−1in the equatorial Pacific (Pakulski and Benner, 1994). PHYL was initialized with diatom data and PHYS with the sum of nanoeukaryotes, picoeukaryotes, Synechococcus sp. and Prochlorococcus sp. The initial detrital particulate matter was derived by subtracting the total living particulate mat-ter considered in the model form the total particulate matmat-ter measured in situ. Due to the lack of data for nano- and mi-crozooplankton, we initiated HNF and CIL abundances
us-ing BAC / HNF and CIL / HNF abundance ratios from the lit-erature, as this was made with the Eco3M-MED model for the Mediterranean (Alekseenko et al., 2014). Several ratios were tested in the range of those reported by Tanaka and Ras-soulzadegan (2002) and Christaki et al. (2011), and the ones providing the best model outputs were used (Table 1).
The standard value of 0.5 ind L−1 was used for adult COPindwhich is consistent with the recent results of Hunt
et al. (2016). The initial values of C, N and P and chloro-phyll concentrations for the planktonic compartments were derived from the initial cellular abundance data and from ar-bitrarily fixed intracellular contents (Table 1). These intracel-lular contents were thus taken from the Eco3M-MED model (Alekseenko et al., 2014).
2.3.2 Modeling N2fixation
The mathematical formulation (see Eq. 4) used to represent N2 fixation was adapted from Rabouille et al. (2006) in
or-der to be compatible with the formal features of the present model. It describes the N2fixation flux as a function of the
nitrogenase (i.e., the enzyme catalyzing N2fixation)
activ-ity (Nase) and the diazotroph abundance (DIAZOcell, where
DIAZO either refers to TRI or UCYN-C). The N2fixation
flux is regulated by the intracellular C quota and the N : C and P : C ratios (Eq. 8) and by the intracellular N quota and N : C ratio (Eq. 9). Intracellular N quota controls the net N2
fixation rate through a quota function (1 − fQN, Eq. 9), the N excess exuded being equally distributed into the DON and NH+4 pools. As in Rabouille et al. (2006), the nitrogenase ac-tivity (Nase, in mol N cell−1s−2) is a state variable, the dy-namics of which are described in Eq. (5). The nitrogenase ac-tivity results from the balance between the increase and the decrease in its activity. The increase in the potential nitroge-nase activity is assumed to be controlled by the N intracellu-lar quota (Eq. 6) and by the NO−3 concentration in the field (Eq. 7). Trichodesmium are non-heterocystous filamentous cyanobacteria with differentiated cells, called diazocysts, lo-cated in the center part of the colony (Bergman and Carpen-ter, 1991), where N2fixation occurs. This spatial segregation
mechanism is used by the organism to protect the nitrogenase enzyme from oxygen inactivation produced by photosynthe-sis (Carpenter and Price, 1976; Bryceson and Fay, 1981). In addition, Trichodesmium combines spatial and temporal seg-regation to maximize the protection of the nitrogenase. This therefore allows the cells to fix N2for only a few hours in the
daytime at around noon (Roenneberg and Carpenter, 1993; El-Shehawy, 2003; Berman-Frank et al., 2001). In contrast, Reddy et al. (1993) have shown that UCYN-C can only use a temporal strategy to separate N2fixation and
photosynthe-sis processes and thus need to fix N2to protect the
nitroge-nase from O2, released by photosynthesis during the day. The
inhibition of N2 fixation during the day for UCYN-C and
during the night for TRI is simulated by the finhib function
Table 1. Initial conditions for the biogeochemical model.
State variable Reference Value Unit State variable Reference Value Unit BACcell Data 4.75 × 10⁸ Cell L−1 HNFcell BAC50cell 9.519 × 10
6 ind L−1
BACC BACcell×QmaxC 1.152 µmol C L−1 HNFC HNFcell×QmaxC 34.950 µmol C L−1
BACN BACcell×QmoyN ×0.7 0.107 µmol N L−1 HNFN HNFcell×QmoyN ×0.7 0.326 µmol N L−1
BACP BACcell×QminP 0.007 µmol P L−1 HNFP HNFcell×QminP 0.023 µmol P L−1
CILcell HNF2500cell 3808 ind L
−1 COP
cell Adapted data 0.5 ind L−1
CILC CILcell×QmaxC 1.538 µmol C L−1 COPC COPcell×QmaxC 0.350 µmol C L−1
CILN CILcell×QmoyN ×0.7 0.108 µmol N L−1 COPN COPcell×QmoyN ×0.7 0.042 µmol N L−1
CILP CILcell×QminP 0.005 µmol P L−1 COPP COPcell×QminP 0.002 µmol P L−1
PHYLcell Data 4.48 × 10⁴ Cell L−1 PHYScell Data 8.11 × 10⁷ Cell L−1
PHYLC PHYLcell×QmaxC 0.306 µmol C L−1 PHYSC PHYScell×QmaxC 1.664 µmol C L−1
PHYLN PHYLcell×QmoyN ×0.7 0.022 µmol N L−1 PHYSN PHYScell×QmoyN ×0.7 0.117 µmol N L−1
PHYLP PHYLcell×QminP 9.634 × 10⁻⁴ mol P L−1 PHYSP PHYScell×QminP 0.005 µmol P L−1
PHYLChl PHYL25C 0.012 µg Chl L−1 PHYSChl PHYS12C 0.138 µg Chl L−1
UCYN-Ccell Data 210 Cell L−1 TRIcell Data 180 trich L−1
UCYN-CC UCYN-Ccell×QmaxC 4.308 pmol C L
−1 TRI
C TRIcell×QmaxC 0.123 µmol C L −1
UCYN-CN UCYN-Ccell×QmaxN 0.650 pmol N L−1 TRIN TRIcell×QmaxN 0.018 µmol N L−1
UCYN-CP UCYN-Ccell×QminP 0.013 pmol P L−1 TRIP TRIcell×QminP 0.388 nmol P L−1
UCYN-CNase TRI33300Nase 1.9 × 10²⁰ mol N cell−1s−1 TRINase Rabouille et al. (2006) 7.5 × 10¹⁶ molN trich−1L−1
UCYN-CChl UCYN-C12 C 0.359 pg Chl L
−1 TRI
Chl TRI25C 0.005 µg Chl L −1
Labile DOC Data 0.25 µmol C L−1 POCDet POCTot−POCLiving 3.791 µmol C L−1
Semi-labile DOC Labile DOC ×19 4.75 µmol C L−1 PONDet PONTot−PONLiving 0.188 µmol N L−1
Labile DON Data 1.0 µmol N L−1 POPDet POPTot−POPLiving 0.012 µmol P L−1
Labile DOP Data 0.0132 µmol P L−1
NO−3 Data 53 nmol L−1 NH4 Data 36 nmol L−1
PO4 Data 30 nmol L−1
between TRI and UCYN-C). The decrease in nitrogenase ac-tivity is regulated by a saturation function involving Nasemaxdec and a coefficient of nitrogenase degradation (see Eq. (5) and Table 2). Both the increase and decrease in nitrogenase are energy dependent and controlled by the intracellular C quota (Eq. 8). FluxN2fix | {z } mol N L−1s−1 = Nase | {z } mol N cell−1s−1 ×DIAZOCELL | {z } cell L−1 ×fQ C×(1 − fQN) (4) dNase dt =
Maximum rate of increase
z }| {
Nasemaxprod ×min(fNase, fNO
− 3) × fQ
C×finhib
| {z }
Increase in Nitrogenase activity
−
Maximum rate of decrease
z }| {
Nasemaxdec × Nase Nase + KNase
×fQC
| {z }
Decrease in Nitrogenase activity
(5) fNase=min max QmaxNC −QNC QmaxNC −QminNC !0.06 ,0 , QmaxN −QN QmaxN −QminN !0.06 ,1 (6) fNO − 3 = 1 1 +KNIT NO−3 (7) fQC=max QmaxNC −QNC QmaxNC −QminNC !0.06 ,0 , max QmaxPC −QPC QmaxPC −QminPC !0.06 ,0 , QC−QminC QmaxC −QminC !0.06 ,1 (8) fQN= 0 siQN≤QminN min 1 + QmaxN −QN QmaxN −QminN 0.06 ,2 if QN≥QmaxN 1 − Q max NC −QNC QmaxNC−QminNC !0.06 if QN∈ [QminN , QmaxN ] and QNC≤QmaxNC min 1 + QmaxNC−QNC QmaxNC −QminNC 0.06 ,2 else (9) finhib=exp(3.7(cos(2π t − π ) − 1)) (10)
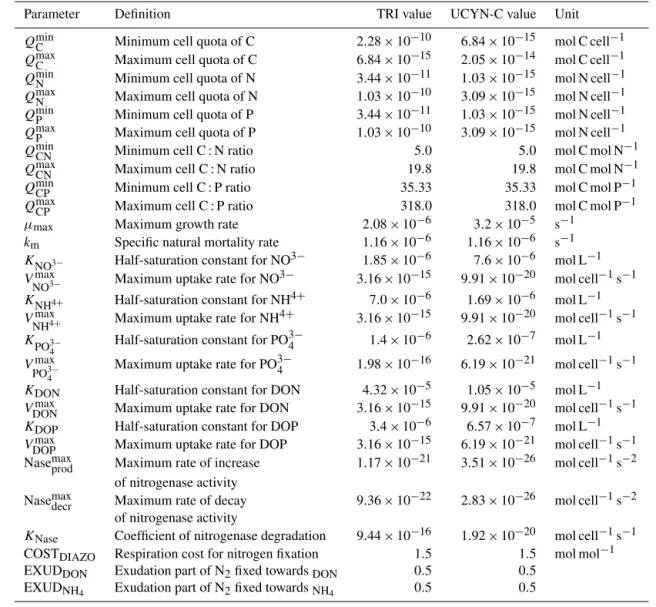
2.3.3 Parametrization of diazotrophs and diazotrophs activity
Trichodesmiumsp. and unicellular cyanobacteria (Group C and especially Cyanothece sp.) exhibit distinct physiologies, sizes and morphologies. Regarding the parametrization of
di-Table 2. Parameters added for the diazotroph organisms.
Parameter Definition TRI value UCYN-C value Unit QminC Minimum cell quota of C 2.28 × 10⁻¹⁰ 6.84 × 10⁻¹⁵ mol C cell−1 QmaxC Maximum cell quota of C 6.84 × 10⁻¹⁵ 2.05 × 10⁻¹⁴ mol C cell−1 QminN Minimum cell quota of N 3.44 × 10⁻¹¹ 1.03 × 10⁻¹⁵ mol N cell−1 QmaxN Maximum cell quota of N 1.03 × 10⁻¹⁰ 3.09 × 10⁻¹⁵ mol N cell−1 QminP Minimum cell quota of P 3.44 × 10⁻¹¹ 1.03 × 10⁻¹⁵ mol N cell−1 QmaxP Maximum cell quota of P 1.03 × 10⁻¹⁰ 3.09 × 10⁻¹⁵ mol N cell−1 QminCN Minimum cell C : N ratio 5.0 5.0 mol C mol N−1 QmaxCN Maximum cell C : N ratio 19.8 19.8 mol C mol N−1 QminCP Minimum cell C : P ratio 35.33 35.33 mol C mol P−1 QmaxCP Maximum cell C : P ratio 318.0 318.0 mol C mol P−1 µmax Maximum growth rate 2.08 × 10⁻⁶ 3.2 × 10⁻⁵ s−1
km Specific natural mortality rate 1.16 × 10⁻⁶ 1.16 × 10⁻⁶ s−1
KNO3− Half-saturation constant for NO3− 1.85 × 10⁻⁶ 7.6 × 10⁻⁶ mol L−1
Vmax
NO3− Maximum uptake rate for NO
3− 3.16 × 10⁻¹⁵ 9.91 × 10⁻²⁰ mol cell−1s−1
KNH4+ Half-saturation constant for NH4+ 7.0 × 10⁻⁶ 1.69 × 10⁻⁶ mol L−1
Vmax
NH4+ Maximum uptake rate for NH4+ 3.16 × 10⁻¹⁵ 9.91 × 10⁻²⁰ mol cell−1s−1
KPO3− 4
Half-saturation constant for PO3−4 1.4 × 10⁻⁶ 2.62 × 10⁻⁷ mol L−1 Vmax
PO3−4 Maximum uptake rate for PO 3−
4 1.98 × 10⁻¹⁶ 6.19 × 10⁻²¹ mol cell−1s−1
KDON Half-saturation constant for DON 4.32 × 10⁻⁵ 1.05 × 10⁻⁵ mol L−1
VDONmax Maximum uptake rate for DON 3.16 × 10⁻¹⁵ 9.91 × 10⁻²⁰ mol cell−1s−1 KDOP Half-saturation constant for DOP 3.4 × 10⁻⁶ 6.57 × 10⁻⁷ mol L−1
VDOPmax Maximum uptake rate for DOP 3.16 × 10⁻¹⁵ 6.19 × 10⁻²¹ mol cell−1s−1 Nasemaxprod Maximum rate of increase 1.17 × 10⁻²¹ 3.51 × 10⁻²⁶ mol cell−1s−2
of nitrogenase activity
Nasemaxdecr Maximum rate of decay 9.36 × 10⁻²² 2.83 × 10⁻²⁶ mol cell−1s−2 of nitrogenase activity
KNase Coefficient of nitrogenase degradation 9.44 × 10⁻¹⁶ 1.92 × 10⁻²⁰ mol cell−1s−1
COSTDIAZO Respiration cost for nitrogen fixation 1.5 1.5 mol mol−1
EXUDDON Exudation part of N2fixed towardsDON 0.5 0.5
EXUDNH4 Exudation part of N2fixed towardsNH4 0.5 0.5
azotrophs and the processes they undertake that they have in common with non-diazotrophs, it has arbitrarily been con-sidered that Trichodesmium cells are equivalent to PHYL cells, and the TRI state variable was therefore parameter-ized like 100 PHYL cells (assuming that a trichome includes 100 cells; Luo et al., 2012), and UCYN-C were parameter-ized like PHYS. For the diazotrophy process, parameters for TRI were configured following the work of Rabouille et al. (2006). TRI was also hypothesized as not being grazed in the field. Its main predator is the copepods of the Harpacti-coida order (mostly Macrosetella and Miracia; O’Neil and Roman, 1992), which are not found in significant numbers in the study area as reported in Hunt et al. (2016). To our knowledge, Grimaud et al. (2013) were the first to propose a dynamic model to depict the N2 fixation by unicellular
cyanobacteria (UCYN-C, Crocosphaera watsonii). Never-theless, since this formulation of N2 fixation was different
from that of Rabouille et al. (2006), we were unable to use
the parameters provided in Grimaud et al. (2013). The latter were therefore derived from that of TRI, not only on the ba-sis of cell size considerations but to obtain overall agreement with N2fixation fluxes measured during the experiment. All
the parameters added for both TRI and UCYN-C new com-partments are detailed in Table 2.
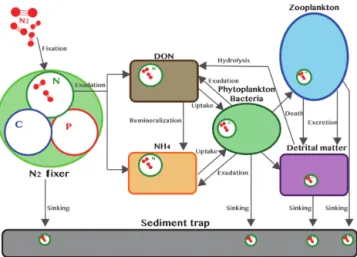
2.4 The fate of fixed N2
The main purpose of the DIP enrichment was to enhance diazotrophy in the mesocosms and facilitate the measure-ment of the DDN transfer. To monitor the pathways of DDN throughout the food web, a post-processing treatment was realized since the model itself does not allow a distinction to be made between the DDN and other N sources. The aim of the post-processing treatment was to dynamically calcu-late the DDN proportion in each compartment of the bio-geochemical model . At the beginning of the simulation, we assumed that DDN was equal to zero in each compartment.
Figure 2. Conceptual diagram of the DDN pathway with compart-ments and processes engaged in the DDN transfer within the food web.
We further assumed that the ratio DDN / N in each N flux leaving a given compartment was the same as that within this compartment. DDN transfer starts with N exudation by dia-zotrophs. This DDN release fueled the DON and NH+4 com-partments, which are then taken up by autotrophs and het-erotrophs. Grazing by zooplankton on the lower trophic lev-els will then transfer part of the DDN by excretion, sloppy feeding and egestion of fecal pellets. Finally, remineraliza-tion and natural mortality will also contribute to the transfer of DDN through the planktonic food web. Figure 2 illustrates the different processes involved in the DDN transfer within the ecosystem.
3 Results
Two simulations of the mesocosm experiment were run: the first includes the representation of the DIP enrichment (SIME), while the second does not consider this enrichment (SIMC). SIMC outputs were compared to the data from the surrounding waters where DIP concentration remained very low and constant throughout the experiment. Since meso-cosms do not include hydrodynamic processes, this is merely an approximation. However, this comparison provided the opportunity to further validate the model under dramatically different nutrient conditions. For the sake of clarity and better readability, the prefixes “m” and “o” will be used to refer to model and observations, respectively, and a∗will be used to
signify data measured outside the mesocosms. Vertical ho-mogeneity was observed in the mesocosms during the ex-periment for most of the biogeochemical and physical char-acteristics (Berthelot et al., 2015b; Turk-Kubo et al., 2015; Leblanc et al., 2016). We thus used the average of the three sampling depths to plot both model results and observations. Three periods (namely P0, P1 and P2) were distinguished during the experiment based on biogeochemical
characteris-Figure 3. Patterns of change over time in (a) dissolved inorganic phosphate (DIP), (b) nitrate (NO−3), (c) dissolved organic phos-phate (DOP), (d) dissolved organic nitrogen (DON), (e) particulate organic phosphorus (POP), (f) particulate organic nitrogen (PON), (g) total phosphorus (Ptotal) and (h) total nitrogen (Ntotal)
concen-trations (µmol L−1) in model outputs (solid lines: SIME – blue; SIMC – black) averaged over depth superimposed on data obser-vations averaged over depth in the three mesocosms (M1 – red; M2 – blue; M3 – green) and in surrounding waters (black). Red vertical lines distinguish the three periods P0 (before the DIP en-richment), P1 (diatom–diazotroph associations dominate the dia-zotrophic community) and P2 (unicellular N2-fixing cyanobacteria
(Group C) dominate the diazotrophic community).
tics as detailed in Berthelot et al. (2015b) and on changes in the diazotroph community composition (Turk-Kubo et al., 2015). P0 stands for the few days before the DIP enrichment, P1 is the period when diatom–diazotroph associations dom-inate the diazotrophic community (i.e., from day 5 to day 14), and P2 is the period when UCYN-C dominate the dia-zotrophic community (i.e., from day 15 to day 23).
3.1 Dynamics of the different N and P pools
During P0, mDIP in SIME decreases slowly from 47 to 24 nmol L−1(Fig. 3a). In response to the DIP enrichment at the end of day 4, mDIP reached 830 nmol L−1, before grad-ually decreasing to the low concentrations observed before the enrichment (Fig. 3a). During the experiment, the DIP en-richment led to three different oDIP in the three mesocosms
with 740, 780 and 990 nmol L−1in M1, M2 and M3, respec-tively, reflecting the slightly different volumes of the meso-cosms (Bonnet et al., 2016b). oDIP then decreased below the quantification limit of 50 nmol L−1 in the three meso-cosms, but the consumption of oDIP in M1 was the fastest and those in M2 the slowest. Without the DIP enrichment (SIMC), mDIP is quickly consumed and the concentrations remained close to zero until the end of the simulation, consis-tent with oDIP*, which was < 50 nmol L−1 throughout the experiment. As well as oNH+4, mNH+4 remained low and stable around 15 nmol L−1 throughout the simulation (not shown here). mNO−3 also fits in well with oNO−3, with nearly constant concentrations close to the quantification limit of 50 nmol L−1(Fig. 3b) over the whole simulation.
oDOP and oDON remained relatively stable throughout the experiment, with values around 5 and 0.14 µmol L−1, re-spectively, with a slight decrease in P2 at the end (Fig. 3c and d). A slight increase in mDOP in SIME from 0.14 to 0.18 µmol L−1 and a slight decrease in both mDOP and mDON were observed during P2. For SIMC, mDOP and mDON remained stable throughout the simulated period (Fig. 3c and d).
In the mesocosms, the trend was similar for oPOP (par-ticulate organic phosphorus) and oPON (par(par-ticulate organic nitrogen), with constant concentrations or a slight decrease during P1, followed by a strong increase during P2 (by a factor of 1.5, 1.5 and 2 in M1, M2 and M3, respectively, in oPON and by a factor of 1.4, 1.4 and 2.4 in M1, M2 and M3, respectively, in oPOP; Fig. 3e and f). SIME re-sults are in good agreement with data for mPON, which starts at 1 µmol L−1 and then increases to a maximum of 1.5 µmol L−1 during P2. While oPOP decreased slightly at the beginning of P1 and increased during P2 during the ex-periment, mPOP in SIMEremains constant (0.08 µmol L−1) from day 5 to 10 and increases after day 10. The increase in mPOP up to the 0.14 µmol L−1peak is stronger and oc-curs earlier than oPOP, before decreasing as in the observed data at the end of P2. In SIMC, the total particulate organic matter dropped throughout the entire simulation, from 0.06 to 0.02 µmol L−1for mPOP and from 1 to 0.4 µmol L−1for mPON.
In the mesocosms, oNtotal averaged 6.2 µmol L−1 during
P1 and started to decrease at the end of P2 (Fig. 3h). mNtotal
in both SIME and SIMC was quite similar and in the same range as that observed in the data, with a slightly sharper decrease for SIMC at the end of P2. SIME showed an im-mediate and strong increase in mPtotal(1–1.2 µmol L−1) on
day 5, corresponding to the DIP enrichment, while mPtotalin
SIMC was constant (250 nmol L−1) throughout the simula-tion (Fig. 3g). After the enrichment, mPtotalstarted to decline
down to 0.2–0.25 µmol L−1 on day 22. In the mesocosms, oChl remained stable during P1 and increased during P2 by a factor of 5 up to a maximum of 1 µg L−1in M3 (Fig. 4a). oChl a was lower (0.6 µg L−1) in M1 and M2 at the end of
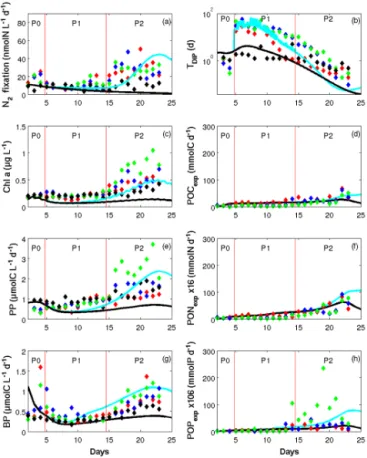
Figure 4. Patterns of change over time in (a) dinitrogen fixation (N2fixation) rates (nmol N L−1d−1), (b) dissolved inorganic
phos-phate turnover time (TDIP, days), (c) chlorophyll a (Chl a, µg L−1),
(d) particulate organic C exported (POCexp, dry matter in mmol C),
(e) primary production (PP) rates (µmol C L−1d−1), (f) particulate organic nitrogen exported × 16 (PONexp, dry matter in mmol N),
(g) bacterial production (BP) rates (µmol C L−1d−1) and (h) par-ticulate organic phosphate exported × 106 (POPexp, dry matter in
mmol N) in model outputs (solid lines: SIME – blue; SIMC – black) averaged over depth superimposed on data observations av-eraged over depth in the three mesocosms (M1, red; M2, blue; M3, green) and in surrounding waters (black). Red vertical lines distin-guish the three periods P0 (before the DIP enrichment), P1 (diatom– diazotroph associations dominate the diazotrophic community) and P2 (unicellular N2-fixing cyanobacteria (Group C) dominate the
di-azotrophic community).
P2. mChl a calculated by SIME was similar to oChl a in M1 and M2, with a decrease a little more marked during P1 and a maximum of 0.5 µg L−1in P2. While mChl a
in-creased during P2 in SIME, mChl a in SIMCremained stable
(∼0.1 µg L−1) until the end of the simulation. 3.2 Dynamics of the different fluxes
The biogeochemical fluxes relative to the main processes such as primary and bacterial productions (PPs and BPs), N2 fixation (Nfix2 ), turnover time of DIP (TDIP), and
PONexpand POPexp) have been calculated by the model and
compared to the measured values (Fig. 4b to h).
At the beginning of P0, oNfix2 as well as mNfix2 (both in SIME and SIMC) were about 17 nmol N L−1d−1 and declined gradually during P1 down to 10 nmol N L−1d−1. While mNfix2 in SIMCcontinued to decrease during P2, mNfix2 in SIMEincreased during P2 by a factor of 4, consistent with oNfix2 and reaching a maximum of 42 nmol N L−1d−1on day 23. Primary and bacterial production (PP and BP) exhibited the same temporal dynamics in both data and SIME results. They first slightly decreased before the DIP enrichment, re-mained stable during P1 and increased during P2 by a factor of 4.4 and 2.7 for PP and BP, respectively (Fig. 4c and e). During P2, mPP (SIME) rose to 2 µmol C L−1d−1, which is in the range of the oPP measured in the three mesocosms. M3 exhibited higher values of oPP than those in M1 and M2 during P2 (around 4 µmol C L−1d−1 on day 22). Even if mBP (in SIME and SIMC) started at a higher rate than oBP measured in the three mesocosms, it decreased rapidly from day 2 to 4 to reach the in situ value before the enrich-ment. The increase in mBP from day 11 to day 17 in SIME was somewhat overestimated compared to data. BP better fit-ted the data measured at the end of P2 and especially in M3 (1 µmol C L−1d−1). In SIMC, the increase in mBP and mPP during P2 did not occur and these rates remained constant around 0.5 µmol C L−1d−1for mPP and 0.4 µmol C L−1d−1 for mBP throughout the 25 days of the simulation. mBP val-ues in SIMC were lower than those measured in the three mesocosms and consistent with the oBP values measured in lagoon waters (Fig. 4e).
TDIPis a relevant indication of DIP availability in the
wa-ter column. Afwa-ter a slight decline in oTDIPduring P0 to
val-ues lower than 1 day, TDIP increased dramatically up to 30
days (oTDIP) and 21 days (mTDIP) after the DIP enrichment.
mTDIP then decreased linearly in SIME as well as oTDIP, in
the three mesocosms. mTDIPin SIMCshowed the same trend
as the oTDIPmeasured in the lagoon waters (Fig. 4g).
The fluxes of exported matter – POCexp, PONexp and
POPexp for C, N and P, respectively – are represented in
Fig. 4d, f and h in terms of dry matter measured in the sed-iment traps (Berthelot et al., 2015b). During P1, the daily export remained relatively stable and averaged 18, 1.13 and 0.09 mmol for mPOCexp, mPONexp and mPOPexp,
respec-tively. oPOCexp, oPONexp and oPOPexpgradually increased
during P2 (from day 15 to 25) to reach a maximum of 57 mmol C d−1, 5 mmol N d−1 and 0.5 mmol P d−1, respec-tively. In SIME, mPOCexp, mPONexpand POPexpfitted well
with data with a slight overestimation of mPOPexpat the end
of P2, which reaches a maximum of 0.75 mmol P d−1. There was no significant difference between SIME and SIMC for
mPOCexp and mPONexp, from the beginning of the
experi-ment to the middle of P2 (day 18). From day 19, the increase in mPOCexp and mPONexp is less important in SIMC than
in SIME. For mPOPexp, the increase in SIME occurs earlier
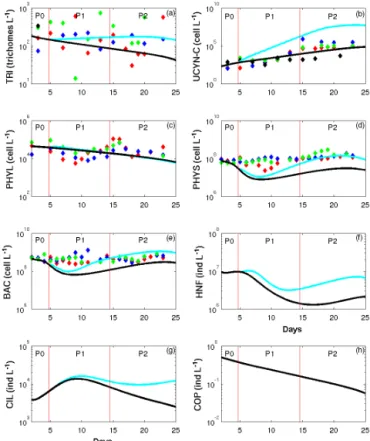
Figure 5. Patterns of change in abundances over time of (a) Trichodesmium (TRI, trichom L−1), (b) unicellular N2
-fixing cyanobacteria (UCYN-C, cell L−1), (c) large phyto-plankton (PHYL, cell L−1), (d) small phytoplankton (PHYS, cell L−1), (e) heterotrophic bacteria (BAC, cell L−1), (f) hetero-nanoflagellates (HNF, ind L−1), ciliates (CIL, ind L−1) and cope-pods (COP, ind L−1) in model outputs (solid lines: SIME – blue; SIMC – black) averaged over depth superimposed on data obser-vations averaged over depth in the three mesocosms (M1 – red; M2 – blue; M3 – green) and in surrounding waters (black). Red vertical lines distinguish the three periods P0 (before the DIP en-richment), P1 (diatom–diazotroph associations dominate the dia-zotrophic community) and P2 (unicellular N2-fixing cyanobacteria
(Group C) dominate the diazotrophic community).
(day 15) and the discrepancy between SIMEand SIMCwas wider at the end of the simulation.
3.3 Evolution of planktonic abundances
The model also simulated the abundances of organisms in cell L−1 for single cells, in trichome L−1 for TRI and in ind L−1for zooplankton, besides being represented in terms of biomass (C, N and P and Chl for phytoplankton).
mTRI remained constant in SIME around
250 trichomes L−1. By contrast, a strong development of UCYN-C occurred during P2, with mUCYN-C reaching 5.107cell L−1(Fig. 5a and b). This increase in mUCYN-C is consistent with the observed dynamics, though the mUCYN-C increase is overestimated in SIME compared
to oUCYN-C. mPHYL decreased over time in both SIME and SIMC (Fig. 5c). In the three mesocosms, oPHYL
increased from day 10 to 15 reaching 105cell L−1 before decreasing back to values close to that of mPHYL. During P0, mPHYS decreased slightly like oPHYS. During P1, the decrease in mPHYS (down to 0.1 × 10⁸cell L−1) was stronger than that of oPHYS, which increased from day 10 and reached the same range of values as oPHYS at the beginning of P2. During P2, mPHYS and oPHYS increased up to 1.5 × 10⁸cell L−1 for mPHYS in SIME and 1.3–2.9 × 10⁸cell L−1 for oPHYS. While mPHYS was similar in SIMEand SIMCfrom day 2 to day 8, the increase in mPHYS after day 8 and until the end of P2 was lower in SIMC than in SIME (Fig. 5d). As for PHYS, there was a slight decrease in mBAC and oBAC during P0. The DIP enrichment on day 4 led to a strong decline from day 5 to day 8, which was more marked in mBAC (9.5 × 10⁷cell L−1 in SIME) than in oBAC (2.3–3.1 × 10⁸cell L−1). From
day 8 to the end of the simulation, mBAC increased up to a maximum of 1.1 × 10⁹cell L−1, while oBAC reached a maximum of 6.8–8.5 × 10⁸cell L−1 at the end of the experiment. In the same way, mBAC was similar in SIME and SIMC from day 2 to day 8 and then increased until the end of the simulation but to a lesser extent in SIMC than in SIME. Since no zooplankton data that could be used for comparison with the model results were available, only the dynamics of SIME and SIMC are presented (Fig. 5g to f). mHNF and mCIL showed the same trends though they are time-shifted. mCOP was similar in SIMEand SIMC, with a decline from 0.5 ind L−1 at the beginning to less than 0.1 ind L−1 at the end of the simulation. Except for mCOP and mPHYL, the DIP enrichment had a strong impact on the plankton dynamics as significant differences between the results of SIME and SIMC in mTRI, mUCYN-C, mPHYS, mBAC, mHNF and mCIL are observed. Overall, SIMC presented abundances 3 to 680 times lower than those simulated by SIME, though the temporal trends were similar between the two simulations.
3.4 DIP enrichment and diazotrophs growth
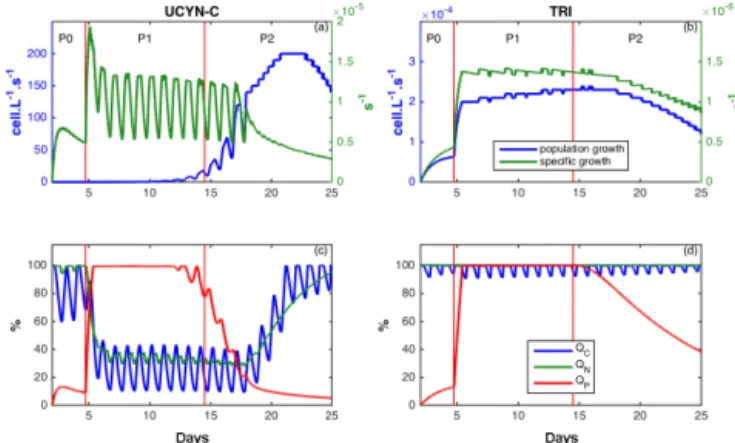
The model also gives additional information not provided by the data regarding the growth of the organisms or their intra-cellular content. The population growth rate (in cell L−1s−1) for TRI and UCYN-C, as well as the specific (i.e., per cell) growth rates (in s−1) of TRI and UCYN-C are plotted in Fig. 6a and b, while the relative intracellular C, N and P quo-tas (i.e., QC, QN and QP) are plotted in Fig. 6c and d. The
DIP enrichment at the end of day 4 had a direct impact on QP for both TRI and UCYN-C, with an instantaneous
in-crease in QPup to 100 % on day 5. While QC, QNand QP
for TRI remained at their maximum value until the end, QN
and QCof UCYN-C decreased as soon as QP increased on
day 5. During P2, QP gradually declined for TRI and faster
for UCYN-C. The reverse process then occurred with an
in-Figure 6. Patterns of change over time in specific (green) and population (blue) growth rates function of (a) unicellular N2
-fixing cyanobacteria (UCYN-C, cell s−1) and (b) Trichodesmium (TRI, trichome s−1) and carbon (C, blue), nitrogen (N, green) and phosphorus (P, red) relative intracellular quota in (c) unicel-lular N2-fixing cyanobacteria (Group C; UCYN-C, %) and (d)
Tri-chodesmium(TRI, %) in model outputs in SIME. Red vertical lines distinguish the three periods P0 (before the DIP enrichment), P1 (diatom–diazotroph associations dominate the diazotrophic com-munity) and P2 (unicellular N2-fixing cyanobacteria (Group C)
dominate the diazotrophic community).
crease in QNand QCfor UCYN-C when QPdecreased from
day 15, whereas this was not observed for TRI. Through-out the simulation, the trends of both population and specific growth rates for TRI were similar, with a sudden increase on day 5 followed by rather constant and then decreasing val-ues (Fig. 6b). By contrast, the increase in the specific growth rate of UCYN-C after the DIP enrichment (day 5) was not observed in the UCYN-C population growth rate, namely on the population scale (Fig. 6a). The population growth rate of UCYN-C increased 10 days later, i.e., during P2, up to a maximum of 200 cell L−1s−1on day 22.
3.5 Fate of DDN in the ecosystem
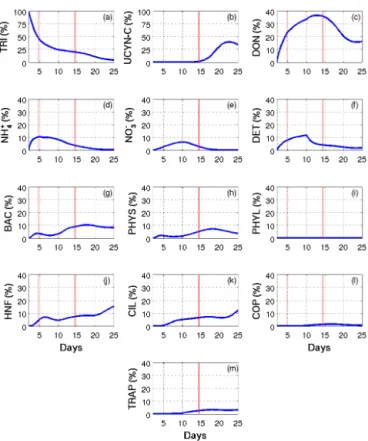
The fate of the N that was fixed at the beginning of the simu-lation (DDN) was examined using the post-processing treat-ment described in the “Methods” section. In short, the pro-portion of the total DDN present in each living and non-living compartment of the water column and in the traps was calcu-lated throughout the simulation period (Fig. 7). At the start of the experiment, DDN was nearly exclusively in TRI (the proportion of DDN in UCYN-C was negligible), but this pro-portion decreased throughout the simulation. Until day 10, most of the DDN was transferred to the DON pool, which contained about 35 % of the total DDN on day 10, followed by, in their order of importance, NH+4 (up to 10 % on day 5), DET (12 % on day 10) and the components of the micro-bial loop. Until day 10, the proportion of DDN in each com-partment except TRI, either increased with time or reached a maximum around day 5, consistent with the decrease in N2
Figure 7. Patterns of change over time of DDN proportion (%) in (a) Trichodesmium (TRI), (b) unicellular N2-fixing cyanobacte-ria (Group C) (UCYN-C), (c) dissolved organic nitrogen (DON), (d) ammonium (NH+4), (e) nitrate (NO−3), (f) detrital nitrogen (DETN), (g) heterotrophic bacteria (BAC), (h) small phytoplankton
(PHYS), (i) large phytoplankton (PHYL), (j) hetero-nanoflagellates (HNF), (k) ciliates (CIL), (l) copepods (COP) and (m) in traps (TRAP) in SIME. Red vertical lines distinguish the three periods P0 (before the DIP enrichment), P1 (diatom–diazotroph associa-tions dominate the diazotrophic community) and P2 (unicellular N2-fixing cyanobacteria (Group C) dominate the diazotrophic com-munity).
fixation rates during that period. After day 10, the proportion of DDN increased in all living organisms, thereby indicat-ing the transfer of DDN to non-diazotrophic organisms. The proportion of DDN increased almost until the end of the sim-ulation in CIL and HNF but only until day 18 in BAC, PHYS and COP before decreasing again. In the non-living compart-ments, the proportion of DDN decreased after day 10 (day 12 for DON) until the end of the simulation. Finally, the pro-portion of DDN in traps was almost zero during the first 10 days of the experiment, before increasing and then stabiliz-ing around 4 %. The percentage of DDN with respect to total particulate N contained in the traps was also plotted (Fig. 8). This percentage increased quite linearly with time from 0 to nearly 0.4 % between day 2 and day 10. On day 10, the per-centage increased much more rapidly until day 12 and then rose gradually to a plateau around 1.2 % before increasing again at the very end of the experiment.
Figure 8. Patterns of change over time of the nitrogen fixation con-tribution (%) to particulate matter export in SIME.
4 Discussion
Nitrogen (N) input by N2 fixation in the upper SW Pacific
Ocean is thought to be controlled by dissolved inorganic phosphate (DIP) availability because of the presence of re-pleted trace metals concentrations compared to the adjacent South Pacific central gyre (Moutin et al., 2005, 2008). The aim of the VAHINE experiment (Bonnet et al., 2016b) was to (i) investigate the fate of the diazotroph-derived nitrogen (DDN) in oligotrophic ecosystems by removing any poten-tial DIP limitation for diazotrophs and thereby potenpoten-tially stimulate the growth of organisms (in particular diazotrophs), (ii) enhance N2fixation and DDN fluxes through the entire
ecosystem, and (iii) study the dynamics of biogeochemical C, N and P fluxes. N2fixation is expected to rapidly deliver new
N to other organisms than diazotrophs, thus reducing pos-sible N growth limitation or co-limitation in the ecosystem. Our goal was to monitor the dynamics of this new N toward the food chain, the inorganic and organic N pools, as well as in the exported particulate matter. The discussion will focus on expected and unexpected results obtained in this study af-ter the DIP enrichment, as well as the fate of DDN in the ecosystem.
4.1 An expected enhancement of biogeochemical fluxes after the DIP enrichment
The mesocosms DIP enrichment performed at the end of day 4 associated with the provision of new N by diazotrophy led to a strong increase in diazotrophs (especially UCYN-C) abundances (Fig. 5a and b), biomass (data not shown) and N2
fixation fluxes during P2, and a significant development of UCYN-C occurred during that period. Whereas a strong in-crease in N2fixation was observed in SIMEduring P2
(con-sistent with the data indicating a near 3-fold higher mean N2 fixation rate in P2 than P1; Fig. 4a), N2 fixation rates
gradually decreased in SIMC, indicating strong differences between the mesocosm conditions and those encountered in lagoon waters. During the experiment, hydrological parame-ters such as temperature and biogeochemical conditions were
all similar inside and outside the mesocosms, except the DIP conditions (Bonnet et al., 2016b), confirming that the DIP en-richment stimulated N2fixation in the mesocosms.
Neverthe-less, a slight increase in N2fixation rates was observed
out-side the mesocosms during P2 (+35 %), which could be ex-plained by a provision of external DIP sources to the lagoon, by growth on DOP sources (Dyhrman et al., 2006) and/or by the increasing seawater temperature over the 25-day experi-ment as experi-mentioned in Bonnet et al. (2016b), which provided favorable conditions for diazotroph growth (Carpenter et al., 2004). A rapid decrease in TDIP was observed on day 5
af-ter the DIP enrichment, suggesting a rapid consumption of the DIP by the planktonic community both in observed data and in the model outputs. Diazotrophs were the first to re-spond to the DIP enrichment in term of abundance, even if this response did not lead to an immediate increase in the N2
fixation rate. The latter significantly increased during P2 in relation to the development of UCYN-C (Turk-Kubo et al., 2015). In the model results, other autotrophic organisms and heterotrophic bacteria declined until the middle of P1 and started to grow 5–10 days after the DIP enrichment (except PHYL). Despite this time lag between the DIP enrichment and the planktonic response, the DIP enrichment resulted in an increase in the abundances of all planktonic groups in the model outputs except PHYL and COP (Fig. 5). The DIP lim-itation at the beginning of the experiment was represented in the model by setting the P cell contents of all organisms at their minimum value, which led to an immediate uptake of DIP after the enrichment at the end of day 4 (Fig. 7c and d). On the cellular scale, this immediate DIP uptake resulted in a rapid increase in intracellular P contents of autotrophs and heterotrophic bacteria up to their maximum quota (Fig. 7c and d for diazotrophs). After N2fixation by diazotrophs, the
DDN inputs were of benefit to non-diazotrophic organisms. Autotrophic PP and heterotrophic BP increased in the model after the DIP enrichment (+262 and +181 %, from day 5 to day 23 for PP and BP, respectively). The enhanced PP (Fig. 5e) led to an increase in total suspended matter (Fig. 3e and f) and finally in exported particulate material (Fig. 4d, f and h). The contribution of N2fixation to PP (up to 10.0 %
for SIME and 6.0 % for SIMC) is in good agreement with corresponding measured contributions, which were equal to 10.9 ± 5.0 % inside the mesocosms and 5.7 ± 2.0 % in the lagoon waters (Berthelot et al., 2015b). Hence, the DIP en-richment not only stimulated N2fixation and PP but also the
percentage of PP sustained by N2fixation. The newly
syn-thesized biomass had two possible fates, namely remineral-ization or export.
Throughout the experiment, Turk-Kubo et al. (2015) has shown that DDAs were the most abundant diazotrophs in the mesocosms during P1. However, it has been shown by Berthelot et al. (2015b) that they did not represent a signif-icant biomass, and the associated export flux was low com-pared to the export flux measured during P2. Moreover, due to their rapid settling (Villareal et al., 1996), DDN produced
by DDAs were not of benefit to the system. For these reasons, we decided not to include DDAs in the model.
During P1, the export in SIME is unexpectedly in good
agreement with data, probably due to the overestimation of UCYN-C by the model (Fig. 5b). The export during P1 was however lower than during P2, during which we observed a higher increase in suspended particulate matter (Fig. 4d, f and h) enhanced by the more significant UCYN-C growth, not clearly noticeable with the logarithmic scale in Fig. 5b. Moreover, the presence of large (100–500 µm) UCYN-C ag-gregates in the mesocosms facilitated their export into the traps where UCYN-C accounted for up to 22.4 ± 4.0 % of total C export at the height of their extensive development (Bonnet et al., 2016a). This indicates that UCYN-C cannot only contribute to direct export but promote indirect export. The high content of TEP measured in traps by Berman-Frank et al. (2016) on days 15 and 16 in correlation with the in-crease in UCYN-C abundances observed by Turk-Kubo et al. (2015) led to the assumption that the presence of TEP in the field would facilitate export flux and especially the sinking of UCYN-C during P2. This phenomenon was taken into ac-count in the model by allowing, each day from day 10, the settling of 10 % of all the model compartments (living and non-living, particulate and dissolved) in addition to the de-trital particulate matter. C, N and P export in SIME closely follows the mesocosm trap measurements (Fig. 6d, f and h). SIME shows higher C, N and P exports (+28, +35 and +158 %, respectively) compared to SIMC. Large-size N2
-fixing organisms are known to directly contribute to C export in coastal and oceanic environments (Subramaniam et al., 2008; Karl and Letelier, 2008), but small-size UCYN-C, al-though very few studies have focused on them, were con-sidered less efficient at promoting export due to their small size (typically 1–6 µm) associated with low individual sink-ing rates and the tight grazsink-ing control that leads to high re-cycling rates in the euphotic zone. In the present study, both our experimental and model results indicated that UCYN-C also significantly contributed to export under DIP repleted conditions, both directly by the sinking of UCYN-C cells and indirectly after the transfer of DDN to non-diazotrophic plankton, which was subsequently exported.
4.2 An unexpected delay for UCYN-C development and biogeochemical fluxes enhancement
The new N provided by N2 fixation after the DIP
enrich-ment resulted in high PP and BP rates, as well as in an in-crease in export and planktonic abundances. However, these responses were not observed immediately after the DIP en-richment on day 4 but 5–10 days later (Figs. 3 and 5). The massive UCYN-C development occurred during P2, with a maximum population growth on day 21 in the model, con-sistent with the observation of the maximum in the UCYN-C abundances reported in Turk-Kubo et al. (2015), on days 20, 15 and 19 in M1, M2 and M3, respectively (Fig. 5b).
4.2.1 What factor may explain the 5–10-day delay between the DIP enrichment and the large UCYN-C development?
On the cellular scale (Fig. 6a), the DIP enrichment had an immediate influence on cell-specific growth rate of UCYN-C, with a 4-fold increase in a few hours. However, this im-mediate response was not observed on the population scale (Fig. 6a). At the beginning of the simulation, the P cell quota of UCYN-C was at a minimum, and UCYN-C cell-specific growth rate was therefore equal to zero. Though DIP and DOP were very low at the beginning of the sim-ulation, UCYN-C could however take up part of this avail-able P, thereby increasing their P quota and their growth rate. UCYN-C reached their maximum cellular P quota the day after the DIP enrichment (Fig. 6c) and DIP did not further limit the UCYN-C growth until day 17. The peak in cell-specific growth rate at day 5 (Fig. 6c) corresponds to the temporary absence of significant nutrient limitation, while oscillations during the following days correspond to the day– night rhythm in UCYN-C C quota associated with C starva-tion during the night (the specific growth rate is modulated by the lowest intracellular quota). When C is the most lim-iting nutrient, the night–day oscillations are passed on to the growth rate. The strong increase in the cell-specific growth rate on day 5 led to an increase in UCYN-C abundances (Fig. 5b). After day 5, photosynthesis and N uptake were then not rapid enough to sustain the increased C and N needs, and N, and mostly C at night, became limiting (Fig. 6c). As a consequence, UCYN-C cell-specific growth rate de-creased slightly after day 5 and more rapidly after day 18 when DIP once again became limiting (Fig. 6a). Figure 6 il-lustrates the time lag between the variations at the cellular level for specific growth rate and growth at the population level. The growth rate of the UCYN-C population also in-creased from the beginning of the simulation since the spe-cific growth rate and the abundance of UCYN-C increased, but this was almost imperceptible until the exponential in-crease started around day 11. From day 18, when the spe-cific growth rate began to strongly decrease, the population growth rate still increased but more slowly and finally de-creased after the maximum of 5.107cell L−1s−1reached on day 22 (Fig. 6a). TRI abundance was less influenced by the DIP enrichment than UCYN-C abundance. However, the DIP enrichment led to an increase in TRI growth rate on day 5 on both the population and trichome scale (Fig. 6c). Since a trichome includes 100 cells of Trichodesmium, the time lag between the responses at the trichome and population lev-els was therefore far less than that evidenced for UCYN-C. Furthermore, although TRI growth was not nutrient-limited from day 5 to day 15 as the three cellular quotas (C, N and P) were at their maximum value (Fig. 6d), the TRI population did not increase significantly because of its low maximum division rate as compared to the timescale of the experiment (3 weeks; consistent with in situ data).
4.2.2 Discussion on the time duration of enrichment experiments
The aforementioned time lag between cellular and popula-tion responses is also useful for understanding what may be viewed as a contradiction: on one hand, we observed a clear and net increase in PP, BP and export productions after the DIP enrichment, both in the mesocosms and in the SIME, but on the other hand, oligotrophic waters are generally known to be more DIN- than DIP-limited. After reviewing the main studies conducted on nutrient limitation, and especially on N and P limitation in oligotrophic waters, Moore et al. (2013) concluded that N was the first limiting nutrient for phyto-plankton in nutrient-depleted areas as nutrient-addition ex-periments did not lead to a significant increase in autotrophic activity after P additions, whereas it did after N additions (Thingstad et al., 2005; Moore et al., 2008; Tanaka et al., 2011; Zohary et al., 2005). Similar results were obtained in the South Pacific gyre for autotrophs (Bonnet et al., 2008) and heterotrophs (Van Wambeke et al., 2008). Van Wambeke et al. (2016) also observed a proximal N limitation of BP at the beginning of the present mesocosm experiment (be-fore the DIP enrichment) on short timescales (days). This apparent contradiction regarding DIP limitation may there-fore be explained by the time duration of the athere-forementioned DIP enrichment experiments that was not long enough to ev-idence the response of the planktonic ecosystem. The enrich-ment mesocosm experienrich-ment conducted during the VAHINE project made it possible to monitor the ecosystem and the associated biogeochemical fluxes over a longer period of time (23 days) compared to the nutrient-addition experiments cited above. Since we observed a significant increase in PP and BP about 5–10 days after the DIP enrichment in both experimental (M2 and M3, 5 days for M1) and simulation results, we may conclude that around 5–10 days are neces-sary for the newly fixed N by diazotrophs to sustain the ob-served high production rates and to see an effective change in the planktonic populations (in term of abundances, structure and function). In the light of the foregoing, two conclusions may therefore be drawn. First, 5 days may be the lowest time limit to characterize the real nutrient-limiting primary, bacte-rial and export productions, at least in marine areas where N2 fixation is a significant process. Therefore, short-term
(∼ 2 days) nutrient-addition experiments may not be well-suited to studying nutrient limitation in marine ecosystems. Second, the initial DIP limitation considered in the model clearly indicates that DIP limitation observed at the cellular level does not reflect the response on the population scale (in terms of primary, bacterial and export productions), which may be delayed. Therefore, in order to correctly assess the nutrient limitation during short-term nutrient-addition exper-iments, nutrient limitation diagnostics operating at a cellular level (such as enzymatic responses) need to be applied rather than classical measurements of PP or BP increase after the enrichment.
4.3 The fate of DDN in the planktonic ecosystem and exported matter
At the start of the simulation, DDN was almost exclusively in TRI since the flux of N2fixation by UCYN-C was
negli-gible compared to that of TRI, and the situation was reversed at the end of the simulation when UCYN-C abundance be-came predominant. Due to DON exudation and NH+4 release by TRI, the proportion of DDN first increased in the DON and NH+4 pools and then in the NO−3 pool due to nitrifica-tion. Before day 10, planktonic organisms did not signif-icantly benefit from the DDN, as its proportion decreased in BAC and PHYS between days 4 and 8 and in HNF be-tween days 6 and 10. For BAC and PHYS, this was mainly due to the decrease (which is overestimated by the model) in abundance of these two groups between days 5 and 8 due to grazing by HNF and CIL. After day 10, the DDN proportion increased in all the non-diazotrophic plankton groups, while it decreased in the non-living pools, though somewhat later (i.e., from day 13) in DON. This decrease in DDN propor-tion in the non-living pools is both due to the assimilapropor-tion of mineral and organic nutrients by phyto- and bacterioplank-ton and to the sinking of the produced organic matter through aggregation processes. Since mineral N is first taken up, the uptake of DON occurs later, namely during P2, as shown in Berthelot et al. (2015b). As a consequence, the decrease in DDN–DON percentage was also delayed as compared to that of NO−3 and NH+4. DDN–DET increased quite regularly un-til day 10 as long as the sinking rate was constant and then decreased with the increase in this sinking rate. As a result, DDN in the particulate matter collected in traps increased from day 10 to the end, consistent with the δ15N budget per-formed by Knapp et al. (2016), thereby indicating a higher contribution of N2fixation to export production during P2
(56 ± 24 % and up to 80 % at the end of the experiment) compared to P1 (47 ± 6 and up to 60 %). mDON appeared to be the pool which mainly benefitted from the DDN. This is due to the DON release by diazotrophs, especially TRI, which was at its maximum N quota throughout the simula-tion (Fig. 8c and d). Since the TRI maximum cell division rate was low, their N2 fixation rate is indeed high enough
to allow Trichodesmium to fulfill their N reserves and reach their maximum N quota (Fig. 6d). The same is not true for UCYN-C, for which the division rate (boosted by the P en-richment) was too high, as compared to their N fixation rate, to reach their N maximum quota. However, in the model, DDN exudation by diazotrophs released equal amounts of NH+4 and DON. During P1, DDN accumulated in DON (up to almost 40 % on day 13; Fig. 7c), whereas DDN in NH+4 decreased rapidly from day 5 as it was immediately used by heterotrophic bacteria and phytoplankton (Fig. 7d). DDN in DON decreased later (i.e., during P2, when the DON pool began to be used) as the inorganic N pool was depleted. Fi-nally, though DDN transited in the same proportions in NH+4
and DON, it mostly accumulated in DON since DDN–NH+4 was taken up more rapidly, these results substantiating those found by Berthelot et al. (2015b). Among the living com-partments, PHYS, BAC, HNF and CIL were the main ben-eficiaries of DDN. PHYS and BAC were indeed the main consumers of NH+4 and labile DON (while PHYL was not allowed by the model to uptake DON), and HNF and CIL, re-spectively, feed on BAC and PHYS and on PHYS and HNF. DDN therefore mainly transited through the actors of the mi-crobial loop, which is consistent with nanoSIMS measure-ments performed after 24 h of incubation with15N2on
wa-ter sampled on day 17, showing that 18 ± 4 % of the DDN was found in picophytoplankton against 3 ± 2 % in diatoms (Bonnet et al., 2016a). According to the model, only 5 % of the total DDN were recovered in the traps at the end of the simulation. This proportion is likely underestimated by the fact that UCYN-C sinking is probably underestimated in the model. The contribution of UCYN-C to POC export on day 17 during P2 was indeed 0.25 % in the model simulation, against up to 22.4 ± 4.0 % in the data during the same pe-riod as reported in Bonnet et al. (2016a). In the same way, the ratio DDN / total N in traps was equal to 1 % at the end of the simulation, which is dramatically lower than the mea-sured value, which is equal to 80 % (Knapp et al., 2016). This discrepancy is partially due to the different methodologies used to make these estimations. In the post-processing treat-ment, we considered that the initial DDN was zero in every compartment, which is obviously not true, but this hypothe-sis was constrained by the fact that the initial DDN in all the model compartments was unknown, and arbitrary allocations of DDN in compartments would have added additional un-certainty to the model results. As a consequence, our results are necessarily underestimated as compared to the measured values since the latter include the history of previous N2
fix-ation in the field (i.e., before the beginning of the mesocosm experiment). If we consider that an initial content of DDN in the traps equals 30 % as measured by Knapp et al. (2016), the final modeled DDN content would be 31 %, which is still underestimated but more realistic. This approximation of the initial zero DDN content in organisms is therefore not suf-ficient to explain the huge difference to observations con-cerning the DDN proportion in traps. Another source of er-ror lies in the implicit representation of the aggregation pro-cess given in this study. It has been considered that from day 10, 10 % of all the model variables are allowed to sink in addition to the detrital particulate compartment. However, it seems that this leads to an underestimation of UCYN-C sink-ing. As already mentioned, Bonnet et al. (2016a) showed that the UCYN-C contribution to the particulate C collected in traps on day 17 was up to 22.4 ± 4.0 % as against 0.25 % for the model. The in situ value has been estimated using a value of the intracellular C content per cell of 22 pgC cell−1, determined according to the measured UCYN-C cell size in the mesocosms and the equations of Verity et al. (1992) . However, the modeled C intracellular content of UCYN-C