Publisher’s version / Version de l'éditeur:
Philosophical magazine letters, 80, 8, pp. 535-541, 2000
READ THESE TERMS AND CONDITIONS CAREFULLY BEFORE USING THIS WEBSITE. https://nrc-publications.canada.ca/eng/copyright
Vous avez des questions? Nous pouvons vous aider. Pour communiquer directement avec un auteur, consultez la
première page de la revue dans laquelle son article a été publié afin de trouver ses coordonnées. Si vous n’arrivez pas à les repérer, communiquez avec nous à PublicationsArchive-ArchivesPublications@nrc-cnrc.gc.ca.
Questions? Contact the NRC Publications Archive team at
PublicationsArchive-ArchivesPublications@nrc-cnrc.gc.ca. If you wish to email the authors directly, please see the first page of the publication for their contact information.
NRC Publications Archive
Archives des publications du CNRC
This publication could be one of several versions: author’s original, accepted manuscript or the publisher’s version. / La version de cette publication peut être l’une des suivantes : la version prépublication de l’auteur, la version acceptée du manuscrit ou la version de l’éditeur.
For the publisher’s version, please access the DOI link below./ Pour consulter la version de l’éditeur, utilisez le lien DOI ci-dessous.
https://doi.org/10.1080/09500830050110468
Access and use of this website and the material on it are subject to the Terms and Conditions set forth at
The surface topography of cracks in strained In0.72Ga0.28P films
Wu, X.; Weatherly, G. C.
https://publications-cnrc.canada.ca/fra/droits
L’accès à ce site Web et l’utilisation de son contenu sont assujettis aux conditions présentées dans le site LISEZ CES CONDITIONS ATTENTIVEMENT AVANT D’UTILISER CE SITE WEB.
NRC Publications Record / Notice d'Archives des publications de CNRC:
https://nrc-publications.canada.ca/eng/view/object/?id=f8cfdd04-53da-41ae-ace2-4aa63a2f0883 https://publications-cnrc.canada.ca/fra/voir/objet/?id=f8cfdd04-53da-41ae-ace2-4aa63a2f0883The surface topography of cracks in strained In
0:72Ga
0:28P
®lms
X
.
WUandG.
C.
WEATHERLYyDepartment of Materials Science and Engineering, McMaster University, Hamilton, Ontario ON L8S 4L7, Canada
[Received 5 November 1999 and accepted 4 April 2000]
ABSTRACT
Cracks in a 2% tensile strained In0:72Ga0:28P ®lm grown on an InP substrate by molecular-beam epitaxy have been studied by cross-section transmission electron microscopy and scanning probe microscopy. A dislocation analogue (i.e. replacing the crack by an array of equivalent in®nitesimal edge dis-locations) is employed to account for the ratio of the crack-opening displacement to the normal surface displacement associated with the crack.
}1. INTRODUCTION
Highly strained epitaxial ®lms can relax by surface roughening, by plastic defor-mation or by cracking (if the ®lm is under tension). The latter mechanism is also commonly found in ®lms where the strains are associated with a thermal mismatch between the ®lm and substrate (Hutchinson and Suo 1991). Cracking of strained compound semiconductor ®lms has been reported by Murray et al. (1996) and Wu and Weatherly (1999). Murray et al. (1996) noted that the cracking process was associated with a normal displacement of the free surface of the ®lm in the vicinity of the crack, and used this observation to estimate the amount of stress (strain) relaxation associated with ®lm cracking.
In this letter we report a combined transmission electron microscopy (TEM) and scanning probe microscopy (SPM) investigation of cracks in a 2% tensile-strained In0:72Ga0:28P ®lm 100 nm thick grown on an InP(100) substrate. We demonstrate that both the crack-opening displacement and the normal displacement of the free surfaces in the crack vicinity can be understood by considering the equivalent dis-location analogue of the surface crack.
}2. EXPERIMENTAL DETAILS
A lattice-mismatched In0:72Ga0:28P ®lm 100 nm thick with a 2% tensile strain was grown on an n-type InP (100) substrate at 4808C using gas-source molecular beam epitaxy (Okada et al. 1997). [011] and
‰
011-Š
cross-section samples were prepared for TEM following standard procedures and examined in a Philips CM12 operating at 120 kV. SPM studies were performed in air using a Digital Instruments Nanoscope III system.Philosophical Magazine L etters ISSN 0950±0839 print/ISSN 1362±3036 online#2000 Taylor & Francis Ltd
http://www.tandf.co.uk/journals
536 X. Wu and G. C. Weatherly
(a)
(b)
(c)
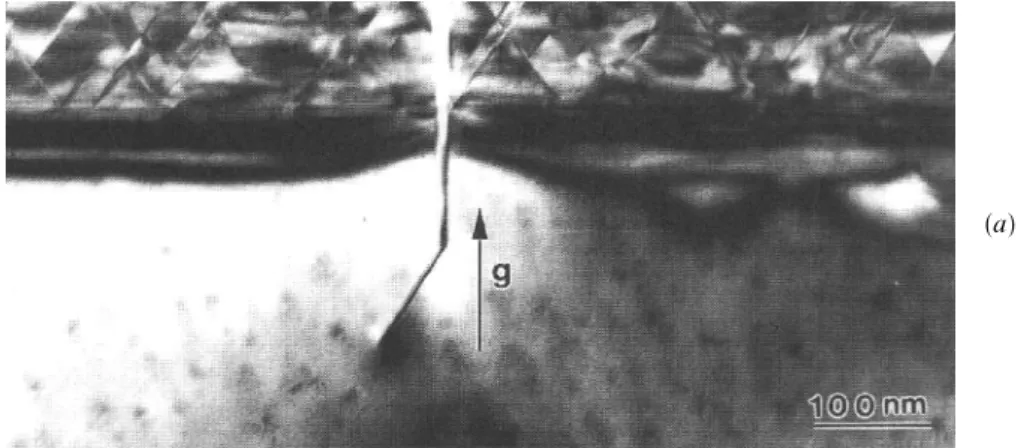
Figure 1. gˆ 400 cross-section TEM images. (a) The crack arrests on the…111- †plane after
penetrating into the substrate along…011- † in the [011] cross-section. (b) The crack arrests on the…011- †plane after penetrating into the substrate along in…011- †in the [011] cross-section. (c) Planar defects and surface undulation in the‰011
}3. OBSERVATIONS
A variety of crack morphologies were found in the ®lms, as shown by the [011] cross-section TEM observations in ®gure 1. The majority of the cracks penetrated some distance into the substrate along the
…
011-†
plane, before deviating and arresting on the…
111-†
or…
1-11-†
planes (®gure 1 (a)). However, on occasion, cracks were observed to arrest after penetrating into the substrate only along the…
011-†
plane (®gure 1 (b)). The stress relaxation mechanisms observed in the orthogonal‰
011-Š
section were a combination of surface roughening and twinning (®gure 1 (c)). The reasons for this behaviour have been discussed by Wu and Weatherly (1999) .The SPM observations from the same set of cracks are summarized in ®gures 2 and 3. If a relatively large area (10 mm £ 10 mm) was scanned, the normal surface
(a)
(b)
Figure 2. SPM image and surface pro®le. (a) Eight cracks (indicated by arrowheads) running along the [011] direction. The normal surface displacement associated with the cracks is visible. (b) Surface pro®le along the direction perpendicular to the [011] direction.
displacement associated with the cracks was readily detected, but the cracks them-selves (and the crack-opening displacement) were not seen. The positions of the cracks are indicated by arrowheads in ®gure 2 (a), and the corresponding surface topography, as measured in a direction normal to the plane of the crack, are shown in ®gure 2 (b). The assessment of the overall surface morphology in these ®lms is complicated by the roughening associated with surface faceting on (411) and
…
41-1-†
planes (Okada et al. 1997). This phenomenon is clearly seen in the image in ®gure 3 (a). However, measurements of the surface displacement associated with cracking were obtained from line traces where there was no interference from the surface roughening. SPM images taken at a higher magni®cation showed both the crack-opening displacement and the normal displacement (®gures 3(a) and (b)).538 X. Wu and G. C. Weatherly
(a)
(b)
Figure 3. SPM image and surface pro®le. (a) A crack running along [011] direction. The crack opening displacement is visible. (b) Surface pro®le along the direction perpendi-cular to the [011] direction.
Table 1 summarizes measurements of the crack-opening displacement ¯0 and maximum normal surface displacement (l) obtained from a number of SPM images of cracks in the In0:72Ga0:28P ®lm 100 nm thick. The average value of ¯0=l is approxi-mately three.
}4. DISCUSSION
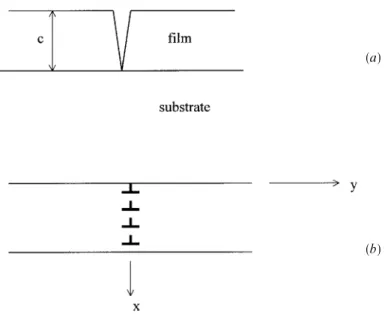
We start the discussion by ®rst considering the use of a dislocation analogue for a surface crack in a thin epitaxial ®lm, within the framework of isotropic elasticity. The geometry of the crack is shown in ®gure 4 (a), with the dislocation analogue in ®gure 4 (b). This analogy has been used in a recent theoretical study of grain-bound-ary `diusion wedges’ by Gao et al. (1999), although they concentrated on time-dependent stress relaxation phenomena rather than cracking per se. These workers used Head’s (1953) approach to describe the stress ®eld of an array of in®nitesimal
Table 1. Summary of SPM observations on an In0:72Ga0:28P ®lm 100 nm thick. ¯0 l (nm) (nm) 18.5 5.2 19.5 5.2 20.5 6.0 20.5 6.3 19.5 7.1 19.7 7.5 6.0 7.1 5.2 6.0 19:7 § 0:7 6:2 § 0:8 (a) (b)
edge dislocations, b
…
x0†
dx0, extending from the free surface (x ˆ 0) to the tip of the diusion wedge (or crack) at x ˆ c. For a dislocation at a distance h from the free surface, Head’ s solutions for ¼xxand ¼yy are¼xxˆ ·b
…
x0†
dx0 2p…
1 ¡ ¸†
…
x¡ h†
‰
…
x¡ h†
2 ¡ y2Š
‰
…
x¡ h†
2‡
y2Š
2 ¡…
x¡ h†
‰
…
x¡ h†
2 ¡ y2Š
‰
…
x‡
h†
2‡
y2Š
2…
‡
2h…
3x‡
h†…
x‡
h†
3 ¡ 6x…
x‡
h†
y2¡ y4‰
…
x‡
h†
2‡
y2Š
3†
;…
1 a†
¼yyˆ ·b…
x0†
dx0 2p…
1 ¡ ¸†
…
x¡ h†
‰
…
x¡ h†
2‡
3y2Š
‰
…
x¡ h†
2‡
y2Š
2 ¡…
x¡ h†
‰
…
x¡ h†
2‡
3y2Š
‰
…
x‡
h†
2‡
y2Š
2…
¡ 2h…
x¡ h†…
x‡
h†
3 ¡ 6x…
x‡
h†
y2‡
y4‰
…
x‡
h†
2‡
y2Š
3†
;…
1 b†
where · and ¸ are the shear modulus and Poisson’s ratio respectively.When y ˆ 0, these two expressions reduce to ¼xxˆ ·b
…
x0†
dx0 2p…
1 ¡ ¸†
1 x¡ h¡ 1 x‡
h‡
2h 3x‡
h…
x‡
h†
3…
†
…
2 a†
¼yyˆ ·b…
x0†
dx0 2p…
1 ¡ ¸†
1 x¡ h¡ 1 x‡
h¡ 2h x¡ h…
x‡
h†
3…
†
…
2 b†
The dislocation array will be equivalent to the crack if the stress ¼ remote from the crack annuls the stress associated with the dislocation array at y ˆ 0, that is
¼ ˆ · 2p
…
1 ¡ ¸†
…c 0 b…
x0†
1 x¡ x0¡ 1 x‡
x0¡ 2x 0 x¡ x0…
x‡
x0†
3…
†
dx0:…
3†
Gao et al. (1999) have given the solution to equation (3). They showed that the crack-opening displacement „0cb
…
x0†
dx0 at the free surface, is approximately 5:8¼c=E, where E is Young’s modulus. This result, as expected, is identical with the classical fracture mechanics result for ¯0 for a surface crack given by Tada etal. (1985).
The dislocation analogy can also be used to estimate the surface displacements,
ux and uy. Using Head’ s equations (1 a) and (1 b), we can show that at the free
surface (x ˆ 0) the normal displacement ux is given by uxˆ ¡
b
…
x0†
dx0 ph2
h2
‡
y2:…
4†
(The negative sign indicates that the surface relaxation corresponds to a local bulging of the surface, as observed. )
The total displacement at y ˆ 0 is obtained by superposition, leading to the ®nal result that u ˆ¡1 p …c 0 b
…
x0†
dx0:…
5†
540 X. Wu and G. C. Weatherlyjuj is identically equal to the experimental measurement l ; so this simple analogy suggests that j¯0=lj ˆ p. This is in excellent agreement with the average ¯0=l ratio of 3.2 found experimentally (see table 1).
The analysis leading to the conclusion ¯0=l ˆ p will still hold for cracks that penetrate into the substrate without deviating (®gure 1(b)), but an asymmetry in the surface pro®le would be expected for cracks that deviate on to
{
111}
planes before arresting. Indeed we have often observed a small asymmetry in the surface pro®les (see for example ®gure 3 (b)) but, as most of the contribution to l comes from the b…
x0†
dx0components nearest to the surface, this will have little overall eect on the magnitude of l or on the ratio ¯0=l.Finally, it should be noted that the surface relaxation associated with the cracks is entirely consistent with the state of strain in the ®lm prior to cracking. The ®lm is in a state of biaxial tension prior to stress relief, so that the through-thickness strain (in the x direction) is given by ¡
‰
¸=…
1 ¡ ¸†
Š
…
"zz‡
"yy), where ¸ is Poisson’s ratio. It isthe local relaxation of this strain in the neighbourhood of the crack that leads to the surface pro®les found by SPM. The elastic strain energy released by cracking must be evaluated from the integral ¡1
2 „¯0
¯b ¼¯
…
x†
dx, where ¯b and ¯0 are the crack openingdisplacements at the ®lm±substrate interface and free surface respectively (Hutchinson and Suo 1991, Ye et al. 1992, Wu and Weatherly 1999).
ACKNOWLEDGEMENT
The authors are gratef ul to National Sciences and Engineering Research Council (Canada) for support of this work.
REFERENCES GAO
,
H.,
ZHANG,
L.,
NI X,
W.
D.,
TH OMP SON,
C.
V.,
andARZ T,
E.,
1999, Acta mater., 47,2865.
HEAD
,
A.
K.,
1953, Proc. phys. Soc. B, 66, 793. HUTCH INSON,
J.
W.,
andSUO,
Z.,
1991, Adv. appl. Mech., 29, 63.MURRAY
,
R.
T.,
KI ELY,
C.
J.,
andHOP KI NSON,
M.,
1996, Phil. Mag. A, 74, 383. OKADA,
T.,
WEATHERLY,
G.
C.,
andMCCOMB,
D.
W.,
1997, J. appl. Phys., 81, 2185. TADA,
H.,
PARIS,
P.
C.,
andIRW I N,
G.
R.,
1985, T he Stress Analysis of Cracks Handbook (StLouis, Missouri: Del Research), p. 8.1a.
WU
![Figure 2. SPM image and surface pro®le. (a) Eight cracks (indicated by arrowheads) running along the [011] direction](https://thumb-eu.123doks.com/thumbv2/123doknet/14204759.480677/4.621.44.577.271.884/figure-image-surface-cracks-indicated-arrowheads-running-direction.webp)
![Figure 3. SPM image and surface pro®le. (a) A crack running along [011] direction. The crack opening displacement is visible](https://thumb-eu.123doks.com/thumbv2/123doknet/14204759.480677/5.621.46.573.278.888/figure-image-surface-running-direction-opening-displacement-visible.webp)