Publisher’s version / Version de l'éditeur:
Vous avez des questions? Nous pouvons vous aider. Pour communiquer directement avec un auteur, consultez la première page de la revue dans laquelle son article a été publié afin de trouver ses coordonnées. Si vous n’arrivez pas à les repérer, communiquez avec nous à PublicationsArchive-ArchivesPublications@nrc-cnrc.gc.ca.
Questions? Contact the NRC Publications Archive team at
PublicationsArchive-ArchivesPublications@nrc-cnrc.gc.ca. If you wish to email the authors directly, please see the first page of the publication for their contact information.
https://publications-cnrc.canada.ca/fra/droits
L’accès à ce site Web et l’utilisation de son contenu sont assujettis aux conditions présentées dans le site
LISEZ CES CONDITIONS ATTENTIVEMENT AVANT D’UTILISER CE SITE WEB.
Internal Report (National Research Council of Canada. Institute for Research in
Construction), 2002-01-08
READ THESE TERMS AND CONDITIONS CAREFULLY BEFORE USING THIS WEBSITE. https://nrc-publications.canada.ca/eng/copyright
NRC Publications Archive Record / Notice des Archives des publications du CNRC :
https://nrc-publications.canada.ca/eng/view/object/?id=57dbff41-7b93-4621-bd17-ae2c6ab6c7e0 https://publications-cnrc.canada.ca/fra/voir/objet/?id=57dbff41-7b93-4621-bd17-ae2c6ab6c7e0
NRC Publications Archive
Archives des publications du CNRC
For the publisher’s version, please access the DOI link below./ Pour consulter la version de l’éditeur, utilisez le lien DOI ci-dessous.
https://doi.org/10.4224/20386211
Access and use of this website and the material on it are subject to the Terms and Conditions set forth at
Sound insulation of load bearing shear resistant wood and steel stud
walls
Wood and Steel Stud Walls
Nightingale, T.R.T.; Halliwell, R.E.; Quirt, J.D.;
Birta, J.A.
www.nrc.ca/irc/ircpubs
IRC-IR-832
Council Canada
IRC-IR-832 8 January, 2002
EXECUTIVE SUMMARY
The IRC Acoustics Laboratory has completed the measurement phase of a study of sound transmission through gypsum board walls, which is part of the project "Fire Resistance and Sound Performance of Wall Assemblies - Phase II" The project was supported by a consortium that included:
• Canadian Home Builders Association (CHBA),
• Canadian Sheet Steel Building Institute (CSSBI),
• Canadian Wood Council (CWC),
• Cellulose Insulation Manufacturers Association of Canada (CIMAC),
• Forintek Canada Corp. (FORINTEK),
• Gypsum Manufacturers of Canada (GMC),
• Institute for Research in Construction of the
National Research Council Canada (IRC/NRCC),
• Owens Corning (OC), and
• Roxul Inc. (ROXUL).
A linked study of fire resistance of wall assemblies has also been completed. The results have been published as a series of IRC Internal Reports:
IR-729 and IR-806 for wood-framed assemblies, and IR-833 for steel-framed assemblies.
This report presents the sound transmission class (STC) data for a series of walls constructed with industry-standard details. Although some of the specimens were chosen by individual clients to demonstrate performance of specific products, these were combined with a structured series established collectively by the consortium.
The combined set of 58 constructions from this project, together with a similar set of specimens evaluated in a preceding project completed in 1995, provide a database for consistent comparisons of the sound transmission through gypsum board wall systems.
This set of data also provides a basis for empirical prediction methods and for development of improved constructions. More immediately, they provide STC data needed by builders and regulators to select constructions suitable for party walls in multi-family dwellings.
INTRODUCTION
The purpose of this report is to provide information on the airborne sound insulation of load-bearing gypsum board wall assemblies, most of which had shear-resistant elements. These were divided almost equally between wood-and steel-stud framing. These types of assemblies extend the range considered in the earlier study of gypsum board walls, which was documented in IRC
Internal Reports IR-693 and IR-761.
A Consortium Steering Committee was formed to ensure that the construction details and materials employed were typical of normal practice. A total of 58 different wall assemblies were examined in this study. The sound transmission class (STC) ratings for these assemblies are given in the section Measurement
Results.
Midway through the project, IRC/NRC performed a necessary renovation of the test facility. This had the effect of breaking the project into two parts, each with fully self-consistent data. In the short term, the renovations have made it more difficult to compare results between the wood- and steel-framed specimens. This complication has been overcome through systematic re-testing of several types of wall assemblies, to provide a framework for harmonizing the results.
Throughout the project a number of reference walls were built using nominally identical materials and using the same contractor for construction. This served three important purposes:
1. The reference specimens provided a measure of the repeatability of results (assuming the same laboratory but a complete rebuild of the specimen) for assemblies that were typical of this study, thereby providing an estimate of what constitutes a significant difference when comparing measured results. This is discussed in the section Measurement Process and Precision. 2. Since the reference specimens were measured both before and after the
chamber renovations they could also be used to quantify the systematic bias introduced by the changes to the facility. This facilitated adjustments to compensate for facility effects, when creating the harmonized data set for regression analysis, as discussed in Analysis of Trends in the Results. 3. By comparing specimens in the same stud set, effects due to small changes
(such as replacing the gypsum board or the cavity insulation without altering the studs and shear membrane) could be more accurately assessed. This provides the basis for the section Analysis of Individual Variables. For this reason the stud set associated with each construction is indicated in the tables of measured data for the wood-framed specimens.
Regression expressions have been developed for the harmonized set of data, in which data measured before chamber renovation have been adjusted to reflect the systematic change in measured transmission loss for similar constructions. The regression results can be thought of as being estimates that are harmonized to a common facility; the renovated chambers.
Council Canada Introduction and Index
IRC-IR-832 8 January, 2002
The regression expressions may be used to estimate the single number ratings for consistent constructions that were not tested. Due to the limited scope of the experimental study, it is not possible to provide estimates for all similar
constructions. The regression expressions should be applied only within the range of parameters for the set of specimens that were evaluated.
Measured STC values from this report should not be used to estimate
performance of an assembly unless the material properties - especially surface density - of the gypsum board used in the proposed construction is similar to that used in this study (see Table A2 and its footnotes). Given the gypsum board surface density, the regression expressions presented on pages 18 and 21 should be used to estimate expected performance.
The report is organized as follows:
EXECUTIVE SUMMARY ...1
INTRODUCTION ...2
MEASUREMENT RESULTS ...4
Wood-Framed Assemblies ...4
Steel-Framed Assemblies...6
MEASUREMENT PROCESS AND PRECISION...11
Precision, Repeatability, and Significance of Observed Differences ...11
Rebuild Repeatability for Wood-Framed Walls ...13
Rebuild Repeatability for Steel-Framed Walls...14
Establishing a Harmonized Set of STC Ratings: ...15
The Facility Signature Adjustment...16
ANALYSIS OF TRENDS IN THE RESULTS...17
Regression Estimates for Wood-Framed Specimens...18
Regression Estimates for Steel-Framed Specimens ...21
ANALYSIS OF INDIVIDUAL VARIABLES ...24
Construction Details Affecting Structure Borne Transmission ...25
Construction Details Affecting Airborne Transmission...30
Cavity Absorption ...30
Layer Mass and Type ...34
Stud Spacing ...37
Fastener Spacing ...37
APPENDIX: SPECIMEN DETAILS...39
Properties of Materials Used in Wall Specimens...39
Fibrous Cavity Insulation ...39
Gypsum Board ...40
Shear Panels and Framing...41
MEASUREMENT RESULTS
The following tables present brief descriptions of the specimens evaluated, together with the measured Sound Transmission Class (STC) value for each construction. In some cases, more than one test was made for a given wall design. In those cases, the mean value for the group of tests is presented. As discussed in the following section on Measurement Process and Precision, some uncertainty in the experimental results is inevitable, because of variations in the construction and because of the inherent precision limits of the test method. The subsequent section on Analysis of Trends in the Results explains the process to systematically minimize such variability and to provide a self-consistent set of estimates of expected performance for walls matching these generic details. Some of those adjusted estimates differ slightly from the experimental results listed in this section. It should be stressed that all the values tabulated in this section are legitimate test results conforming to all requirements of the pertinent technical standards.
Wood-Framed Assemblies
Table WSS-1: Wood studs with a shear bracing element plus one layer of gypsum board on one side, and resilient furring channels plus one layer of gypsum board on the other side
one layer of gypsum board, shear bracing element (as noted), 38x89 mm wood studs at 406 mm o.c., absorptive material (as noted) in stud cavity 13 mm resilient steel furring channels spaced at 610 or 406 mm o.c. one layer of gypsum board.
a) Resilient channels spaced at 406 mm o.c.
Gypsum Board1 Shear Bracing Absorptive Material Stud Set2 Test Number STC 12.7 mm regular 12.7 mm OSB (nailed) glass fibre, 89 mm R12 batt 1 TLA-96-059/060 42 12.7 mm Type X 12.7 mm OSB (nailed) glass fibre, 89 mm R12 batt 1 TLA-96-047/048 47 b) Resilient channels spaced at 610 mm o.c.
12.7 mm regular 12.7 mm OSB (nailed) glass fibre, 89 mm R12 batt 1 TLA-96-055/056 48 12.7 mm Type X 12.7 mm OSB (nailed) glass fibre, 89 mm R12 batt 1 TLA-96-051/052 52 " 9.5 mm plywood (nailed) glass fibre, 89 mm R12 batt 4 TLA-97-062/063 50 15.9 mm Type X 12.7 mm OSB (nailed) glass fibre, 89 mm R12 batt 1 TLA-96-041/042 53 " " glass fibre, 89 mm R13 batt 5 TLA-97-078/079 53 " " rock fibre, 90 mm R13 batt 5 TLA-97-074/075 52 Note: 1. See note on classification and properties of gypsum board on page 40
Council Canada Measurement Results
IRC-IR-832 8 January, 2002
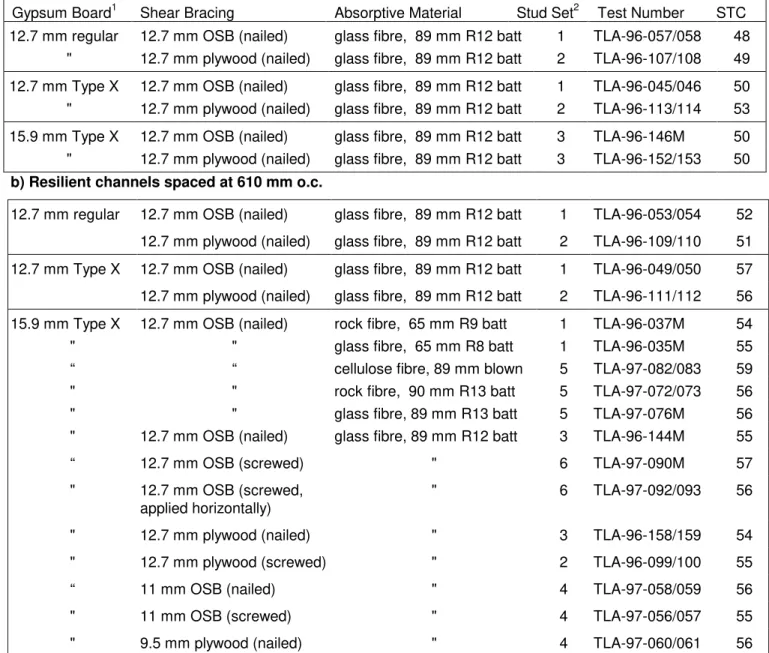
Table WSS-2: Wood studs with one layer of gypsum board plus a shear bracing element on one side, and resilient furring channels plus two layers of gypsum board on the other side
one layer of gypsum board, shear bracing element (as noted), 38x89 mm wood studs at 406 mm o.c., absorptive material (as noted) in stud cavity, 13 mm resilient steel furring channels spaced at 610 or 406 mm o.c., two layers of gypsum board. a) Resilient channels spaced at 406 mm o.c.
Gypsum Board1 Shear Bracing Absorptive Material Stud Set2 Test Number STC 12.7 mm regular 12.7 mm OSB (nailed) glass fibre, 89 mm R12 batt 1 TLA-96-057/058 48
" 12.7 mm plywood (nailed) glass fibre, 89 mm R12 batt 2 TLA-96-107/108 49 12.7 mm Type X 12.7 mm OSB (nailed) glass fibre, 89 mm R12 batt 1 TLA-96-045/046 50 " 12.7 mm plywood (nailed) glass fibre, 89 mm R12 batt 2 TLA-96-113/114 53 15.9 mm Type X 12.7 mm OSB (nailed) glass fibre, 89 mm R12 batt 3 TLA-96-146M 50 " 12.7 mm plywood (nailed) glass fibre, 89 mm R12 batt 3 TLA-96-152/153 50 b) Resilient channels spaced at 610 mm o.c.
12.7 mm regular 12.7 mm OSB (nailed) glass fibre, 89 mm R12 batt 1 TLA-96-053/054 52 12.7 mm plywood (nailed) glass fibre, 89 mm R12 batt 2 TLA-96-109/110 51 12.7 mm Type X 12.7 mm OSB (nailed) glass fibre, 89 mm R12 batt 1 TLA-96-049/050 57 12.7 mm plywood (nailed) glass fibre, 89 mm R12 batt 2 TLA-96-111/112 56 15.9 mm Type X 12.7 mm OSB (nailed) rock fibre, 65 mm R9 batt 1 TLA-96-037M 54 " " glass fibre, 65 mm R8 batt 1 TLA-96-035M 55 “ “ cellulose fibre, 89 mm blown 5 TLA-97-082/083 59 " " rock fibre, 90 mm R13 batt 5 TLA-97-072/073 56 " " glass fibre, 89 mm R13 batt 5 TLA-97-076M 56 " 12.7 mm OSB (nailed) glass fibre, 89 mm R12 batt 3 TLA-96-144M 55
“ 12.7 mm OSB (screwed) " 6 TLA-97-090M 57
" 12.7 mm OSB (screwed, applied horizontally)
" 6 TLA-97-092/093 56 " 12.7 mm plywood (nailed) " 3 TLA-96-158/159 54 " 12.7 mm plywood (screwed) " 2 TLA-96-099/100 55
“ 11 mm OSB (nailed) " 4 TLA-97-058/059 56
" 11 mm OSB (screwed) " 4 TLA-97-056/057 55
" 9.5 mm plywood (nailed) " 4 TLA-97-060/061 56 Note: 1. See note on classification and properties of gypsum board on page 40
Steel-Framed Assemblies
Table LBSS-1: 41x92 mm load-bearing steel studs spaced 406 mm o.c., with one layer gypsum board on one side, resilient steel furring channels spaced 406 or 610 mm o.c. plus one layer gypsum board on other side
one layer of gypsum board,
41x92 mm load-bearing steel studs of
16 gauge (1.52 mm), 18 gauge (1.22 mm), or 20 gauge (0.91 mm),
absorptive material (as noted) in stud cavity, 13 mm resilient steel furring channels spaced at 610 mm o.c.,
one layer of gypsum board.
a) Resilient channels spaced at 406 mm o.c.
Gypsum Board1 Stud Details Absorptive Material Stud Set2 Test Number STC 12.7 mm Type X 20 gauge at 406 mm o.c. glass fibre, 89 mm R12 batt A TLA-00-105/106 45 b) Resilient channels spaced at 610 mm o.c.
12.7 mm Type X 20 gauge at 406 mm o.c. glass fibre, 89 mm R12 batt B TL-94-022 48 " 20 gauge at 406 mm o.c. glass fibre, 89 mm R12 batt A TLA-00-095/096 47 15.9 mm Type X 16 gauge at 406 mm o.c. glass fibre, 89 mm R12 batt B TL-93-355 49 " 18 gauge at 406 mm o.c. glass fibre, 89 mm R12 batt B TL-93-354 50 " 20 gauge at 406 mm o.c. glass fibre, 89 mm R12 batt B TL-94-025 49 " 20 gauge at 406 mm o.c. glass fibre, 89 mm R12 batt A TLA-00-089/090 49 Notes: 1. See note on classification and properties of gypsum board on page 40
Council Canada Measurement Results
IRC-IR-832 8 January, 2002
Table LBSS-2(a): 41x92 mm load-bearing steel studs (spaced 406 or 610 mm o.c.), 16 gauge (1.52 mm) or 20 gauge (0.91 mm), with one layer gypsum board on one side, resilient steel furring channels (spaced 406 or 610 mm o.c.) plus two layers gypsum board on other side
one layer of gypsum board,
41x92 mm load-bearing steel studs
16 gauge (1.52mm) or 20 gauge (0.91 mm), absorptive material (as noted) in stud cavity, 13 mm resilient steel furring channels spaced at 406 or 610 mm o.c., two layers of gypsum board. a) Resilient channels spaced at 406 mm o.c.
Gypsum Board1 Stud Details Absorptive Material Set2 Test Number STC 12.7 mm Type X 20 gauge @406 mm o.c. glass fibre, 89 mm R12 batt A TLA-00-103/104 51
" 20 gauge @406 mm o.c. rock fibre, 90 mm R13 batt A TLA-99-127/128 51 " 20 gauge @406 mm o.c. cellulose fibre, 92 mm blown A TLA-00-067/068 51 12.7 mm Type X 20 gauge @610 mm o.c. rock fibre, 90 mm R13 batt A TLA-99-137/138 55 15.9 mm Type X 16 gauge @406 mm o.c. glass fibre, 89 mm R12 batt A TLA-00-083/084 50 20 gauge @406 mm o.c. glass fibre, 89 mm R12 batt A TLA-00-069/070 51 b) Resilient channels spaced at 610 mm o.c.
12.7 mm Type X 16 gauge @406 mm o.c. glass fibre, 89 mm R12 batt B TL-94-018 53 " 20 gauge @406 mm o.c. glass fibre, 89 mm R12 batt B TL-94-021 54 " 20 gauge @406 mm o.c. glass fibre, 89 mm R12 batt A TLA-00-097/098 54 " 20 gauge @406 mm o.c. rock fibre, 90 mm R13 batt A TLA-99-123/124 52 15.9 mm Type X 20 gauge @406 mm o.c. glass fibre, 89 mm R12 batt A TLA-00-091/092 54 Note: 1. See note on classification and properties of gypsum board on page 40
2. Set A or B denotes measurement results from after or before the facility modification, respectively. Table LBSS-2(b): 41x92 mm load-bearing steel studs (spaced 406 mm o.c.), 16 gauge (1.52 mm) or 20
gauge (0.91 mm), with two layers of gypsum board on one side, resilient steel furring channels (spaced 610 mm o.c.) plus one layer of gypsum board on other side
two layers of gypsum board, 41x92 mm load-bearing steel studs
16 gauge (1.52mm) or 20 gauge (0.91 mm), absorptive material (as noted) in stud cavity, 13 mm resilient steel furring channels spaced at 610 mm o.c.,
one layer of gypsum board.
Gypsum Board1 Stud Details Absorptive Material Set2 Test Number STC 12.7 mm Type X 16 gauge @406 mm o.c. glass fibre, 89 mm R12 batt B TL94-016 53
" 16 gauge @406 mm o.c. rock fibre, 90 mm R13 batt B TL94-013 53 " 20 gauge @406 mm o.c. glass fibre, 89 mm R12 batt B TL94-019 54 " 20 gauge @406 mm o.c. rock fibre, 90 mm R13 batt B TL94-023 54 Note: 1. See note on classification and properties of gypsum board on page 40
Table LBSS-3: 41x92 mm load-bearing steel studs spaced at 406 mm o.c., 16 gauge (1.52 mm) or 20 gauge (0.91 mm), with two layers gypsum board on one side, resilient steel furring channels spaced 406 or 610 mm o.c. plus two layers gypsum board on other side
two layers of gypsum board, 41x92 mm load-bearing steel studs
16 gauge (1.52mm) or 20 gauge (0.91 mm), absorptive material (as noted) in stud cavity, 13 mm resilient steel furring channels spaced at 406 or 610 mm o.c., two layers of gypsum board.
a) Resilient channels spaced at 406 mm o.c.
Gypsum Board1 Stud Details Absorptive Material Set2 Test Number STC 12.7 mm Type X 16 gauge @406 mm o.c. glass fibre, 89 mm R12 batt A TLA-00-079/080 57
" 16 gauge @406 mm o.c. rock fibre, 90 mm R13 batt A TLA-00-081/082 56 " 20 gauge @406 mm o.c. glass fibre, 89 mm R12 batt A TLA-00-065/066 57 15.9 mm Type X 16 gauge @406 mm o.c. glass fibre, 89 mm R12 batt A TLA-00-085/086 57 " 20 gauge @406 mm o.c. glass fibre, 89 mm R12 batt A TLA-00-071/072 58 b) Resilient channels spaced at 610 mm o.c.
12.7 mm Type X 16 gauge @406 mm o.c. glass fibre, 89 mm R12 batt B TL-94-017 59 " 16 gauge @406 mm o.c. rock fibre, 90 mm R13 batt B TL-94-014 59 " 20 gauge @406 mm o.c. glass fibre, 89 mm R12 batt B TL-94-020 60 " 20 gauge @406 mm o.c. rock fibre, 90 mm R13 batt B TL-94-024 60 " 20 gauge @406 mm o.c. glass fibre, 89 mm R12 batt A TLA-00-099/100 59 " 20 gauge @406 mm o.c. none A TLA-00-063/064 50 15.9 mm Type X 20 gauge @406 mm o.c. glass fibre, 89 mm R12 batt A TLA-00-073/074 59 " 20 gauge @406 mm o.c. glass fibre, 89 mm R12 batt A TLA-00-093/094 59 " 20 gauge @406 mm o.c. none A TLA-00-075/076 51 Note: 1. See note on classification and properties of gypsum board on page 40
2. Set A or B denotes measurement results from after or before the facility modification, respectively. 3. TLA-00-093/094 is a rebuild of TLA-00-073/074 to assess construction and measurement
Council Canada Measurement Results
IRC-IR-832 8 January, 2002
Table LBSS-4: 41x92 mm load-bearing steel studs, 20 gauge (0.91 mm), spaced at 406 mm o.c., with one layer of gypsum board and a shear bracing element on one side, resilient steel furring channels spaced 406 mm o.c. plus two layers gypsum board on other side
one layer of gypsum board, shear bracing element (as noted), 41x92 mm load-bearing steel studs
20 gauge (0.91 mm) spaced 406 mm o.c., absorptive material (as noted) in stud cavity, 13 mm resilient steel furring channels spaced at 406 mm o.c.,
two layers of gypsum board. a) Resilient channels spaced at 406 mm o.c.
Gypsum Board1 Shear Bracing Absorptive Material Set2 Test Number STC 12.7 mm Type X steel X-bracing straps + end
cavities blocked at mid-height
rock fibre, 90 mm R13 batt A TLA-99-129/130 52 " steel X-bracing straps rock fibre, 90 mm R13 batt A TLA-99-131/132 51 " 11.7* mm OSB panel rock fibre, 90 mm R13 batt A TLA-99-135/136 57 Note: 1. See note on classification and properties of gypsum board on page 40
2. Set A or B denotes measurement results from after or before the facility modification, respectively. 3. See Appendix, Figures A-4 to A-6 for more information about specimen details.
* Denotes nominal thickness.
Table LBSS-5: 2 rows 41x92 mm load-bearing 20 gauge (0.91 mm) steel studs, spaced at 406 mm o.c., the two rows are spaced 25 mm apart, no absorptive material in stud cavity and two layers of gypsum board on the exposed faces
two layers of gypsum board,
41x92 mm loadbearing 20 gauge (0.91 mm) steel studs
25 mm airspace.
41x92 mm loadbearing 20 gauge (0.91 mm) steel studs
two layers of gypsum board.
a) Both sets of steel studs spaced at 406 mm o.c.
Gypsum Board1 Shear Bracing Absorptive Material Set2 Test Number STC
12.7 mm Type X None None A TLA-00-061/062 52
Note: 1. See note on classification and properties of gypsum board on page 40
Table LBSS-6: 41x92 mm load-bearing 20 gauge (0.91 mm) steel studs, spaced at 406 mm o.c.,
with one layer of gypsum board on each side, with an adjacent furring section comprising non-load-bearing 25 gauge (0.50 mm) steel studs spaced 406 mm o.c. with absorptive material in stud cavity and one layer of gypsum board on the exposed face
Furring section comprising: one layer of gypsum board,
65 mm non-load-bearing 25 gauge (0.50 mm) steel studs
with absorptive material in stud cavity, 25 mm airspace.
Structural section comprising: one layer of gypsum board,
41x92 mm load-bearing 20 gauge (0.91 mm) steel studs
with absorptive material in stud cavity, one layer of gypsum board.
a) Both sets of steel studs spaced at 406 mm o.c.
Structural Section Furring Section Test Number STC
Gypsum Board1 Absorptive Material Gypsum Board1 Absorptive Material 15.9 mm Type X
(both sides)
Glass fibre, 89 mm R12 batt
12.7 mm Regular (exterior face only)
Glass fibre, 89 mm R12 batt
TLA-00-077/078 48 Note: 1. See note on classification and properties of gypsum board on page 40
Council Canada Measurement Process and Precision
IRC-IR-832 8 January, 2002
MEASUREMENT PROCESS AND PRECISION
The acoustical measurements were made in the suite of reverberation chambers in building M-27 of IRC/NRCC. Wall specimens are mounted in a removable test frame between two chambers, without rigid contact to either reverberation
chamber. Tests are conducted in accordance with the requirements of ASTM E90, Standard Method for Laboratory Measurement of Airborne Sound
Transmission Loss of Building Partitions.
In presenting and evaluating the results of this series of measurements, three basic aspects must be considered:
1. Repeatability of sound transmission results when specimens are replicated with nominally equivalent materials.
2. The effect on the sound transmission results due to modifications to the test facility, during the course of this project.
3. The design of the measurement series and the analysis of the experimental results to provide a basis for accurate estimates of the effect of specific changes in specimens.
This section of the report presents information primarily on the first two of these issues. All three are addressed further in later sections on analysis of results.
Precision, Repeatability, and Significance of Observed Differences
As shown in the preceding project on gypsum board walls (documented in IRC Internal Report IRC-IR-693, October 1995), the acoustical effect of specific changes in wall details can be assessed most precisely by making a series of small modifications to a wall specimen.
With this approach, meaningful effects can be shown, if the changes exceed a repeatability criterion based on the variability in results when a given specimen is repeatedly tested over a short period of time. Figure 1 presents the variability in sound transmission loss observed in repeated testing of a gypsum board wall, with no modifications to the specimen.
Figure 1:
Variability observed in repeated testing of a
specimen over several days, with no modifications to the specimen. The curves for 10 tests are presented here to illustrate the small range in the results. The results vary by only a few tenths of a decibel at most frequencies (standard deviation from 0.2 to 0.8 dB). This is believed to be independent of specimen type.
No Specimen Change Test Repeatability
10 20 30 40 50 60 70 63 125 250 500 1k 2k 4k Frequency, Hz Transm ission Loss, dB
The variability in the measurement results depends on implementation of the test method - number of microphone and sound source positions and consistency of their locations, calibration effects, temperature stability, etc. These data
presented in Figure 1 represent the characteristic repeatability for the automated system used for all the measurements reported here.
The standard deviation in most frequency bands is only a few tenths of a decibel. Thus, variability due to random effects in the measurement process would not interfere with identifying a change of 1dB or greater and smaller changes can also be identified in detailed comparisons (as in the section on Analysis of Individual Variables) where consistent deviations are observed in several adjacent frequency bands.
In addition to measurement uncertainty, however, a second aspect of repeatability needs to be considered in assessing which differences are significant. In practice, the variability observed when nominally identical
specimens are constructed (even with materials from the same batches) is much greater than the repeatability in the measurement process. This variation seems to depend to some degree on the type of construction, and on the type of
changes.
When the changes in construction were small, then the uncertainty associated with the change was rather small. To facilitate reliable evaluation of parametric effects, and to support interpolation to wall designs other than those actually tested, the set of specimens for each type of studs was structured so that only one component was changed while others were held constant. For example, the effect due to different types of insulation was evaluated in a wood stud wall where the studs, shear membrane, and the type and attachment of the gypsum board were all held constant. Changes were implemented without altering the more sensitive elements of the construction, such as the studs and shear membrane. A similar methodology was used for the steel-framed assemblies, although the parametric variations were more limited. This provided the basis for evaluating the effect of specific parameters, as discussed further in the section on Dependence on Individual Variables.
For such comparisons (where neither the specimen framing nor the laboratory was changed) the uncertainty is only slightly greater than the test repeatability discussed above. The consistency of trends in such comparisons suggests that when changes in excess of 1 dB are observed in a number of adjacent bands, they are physically meaningful.
Greater uncertainty was inherent in more significant changes. In this project, variability in the individual measurement results was introduced both by changes in the specimen construction, and by changes to the test facility part way through the evaluation of the steel-framed specimens. Because such variations might mask systematic changes due to construction details, reference specimens with nominally identical construction were included in the set of wall variants tested for each set of studs, to provide an estimate of the variation due to replacing the framing. A second set of comparison specimens was used to assess the effect of facility changes.
Council Canada Measurement Process and Precision
IRC-IR-832 8 January, 2002
Rebuild Repeatability for Wood-Framed Walls
In the case of the wood-framed walls, an extensive set of data was gathered. To avoid cumulative effects due to stud damage when attaching the shear
membranes and gypsum board, six sets of wood studs were used. The test results are presented both in Table WSR-1 and in Figure 2 below.
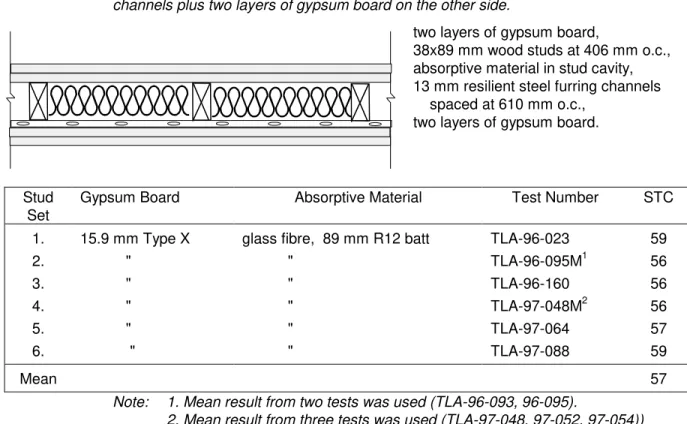
Table WSR-1: Reference specimen, with wood studs, two layers of gypsum board (in place of shear bracing element and face layer of gypsum board on that side), and resilient furring channels plus two layers of gypsum board on the other side.
two layers of gypsum board,
38x89 mm wood studs at 406 mm o.c., absorptive material in stud cavity, 13 mm resilient steel furring channels spaced at 610 mm o.c.,
two layers of gypsum board.
Stud Set
Gypsum Board Absorptive Material Test Number STC 1. 15.9 mm Type X glass fibre, 89 mm R12 batt TLA-96-023 59 2. " " TLA-96-095M1 56 3. " " TLA-96-160 56 4. " " TLA-97-048M2 56 5. " " TLA-97-064 57 6. " " TLA-97-088 59 Mean 57
Note: 1. Mean result from two tests was used (TLA-96-093, 96-095).
2. Mean result from three tests was used (TLA-97-048, 97-052, 97-054))
Figure 2:
Variability in repeated tests of a specific wood stud wall design, with complete rebuild of the specimen each time, using nominally identical components. The shaded area represents the range of one standard deviation about the mean value. The STC ratings are controlled by performance in the 125 Hz band, and the standard deviation of 1.3 dB at that frequency is
responsible for the range of 3 dB observed in the STC
Rebuild Repeatability
(Complete reconstruction, wood stud wall)
10 20 30 40 50 60 70 80 63 125 250 500 1k 2k 4k Frequency, Hz Transm issi on Loss, dB
Although the general shape of the sound transmission results is very similar for all six of the reference specimens with wood studs, the differences evident in
Figure 2 are clearly greater than the range expected due to variability in the measurement process shown in Figure 1.
The STC ratings for these reference wood-framed specimens are controlled by the performance in the 125 Hz band, and the standard deviation of 1.3 dB at that frequency is responsible for the range of 3 dB observed in the STC ratings for nominally identical wood-framed specimens.
Rebuild Repeatability for Steel-Framed Walls
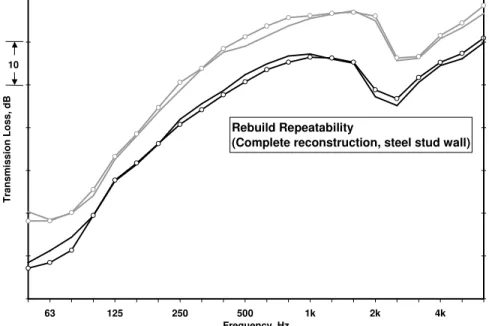
In the case of the steel-framed assemblies, the modification of the facility midway through the series complicates assessment of the variability due to replicating specimens. Two constructions were rebuilt and tested to directly assess the “rebuild repeatability.” Similar results were observed in both cases; the data are shown in Figure 3. The STC values were the same, and the curves agreed quite well at most frequencies. These data were insufficient for statistical evaluation of the rebuild repeatability, but the mean absolute difference of 1.0 dB was significantly smaller than the variance exhibited by the wood-framed
specimens in Figure 2.
The observed variation seems slightly smaller for rebuild of the steel-framed walls, but the data are too limited for a serious quantitative comparison. Figure 3:
Variability observed in repeat testing of matching steel stud wall specimens in the same laboratory, with complete rebuild of the specimen using nominally identical components. The transmission loss axis for the two cases was arbitrarily offset to permit comparison of the two sets of data on one graph. Note that STC values were the same.
Rebuild Repeatability
(Complete reconstruction, steel stud wall)
10 20 30 40 50 60 70 80 63 125 250 500 1k 2k 4k Frequency, Hz Transmission Loss, dB 0 10 20 30 40 50 60 70 10
A more substantial basis for evaluating the repeatability is obtained by combining these results with those for the four steel-framed constructions that were tested both before and after the facility renovation, using nominally identical materials. The STC results are listed in Tables LBSS-1 to LBSS-3. In two cases the STC changed by 1, but in all other cases the STC was unchanged. Thus a change of 1 in the listed STC value should not be interpreted as significant, but a change of 2 or more should indicate a meaningful difference for the steel-framed
constructions.
A similar criterion seems reasonable for the STC values of wood-framed specimens based on the same set of wood studs. However, for specimens chosen at random from the tables, even a difference of 3 in the STC is not clear
Council Canada Measurement Process and Precision
IRC-IR-832 8 January, 2002
evidence of meaningful change. It is more reliable to use the regression expressions presented in the following section of the report as a basis for assessing the significance of changes.
Establishing a Harmonized Set of STC Ratings:
At the heart of the plan for this project was the acquisition of a consistent set of data, which could be used to predict the STC values for a larger set of wall designs.
As noted before, the study dealt with two sets of specimens – one with wood studs and the other with load-bearing steel studs. There were specific barriers to obtaining a consistent set of data:
1. For the wood-framed specimens, it was expected that variability among the stud assemblies would introduce differences between the sound transmission results for sets of specimens. On the assumption that the same bias would apply to all specimens constructed on a given set of studs, nominally identical reference specimens were included in the series for each stud set. It was found, however, that correcting for this expected bias provided
negligible improvement in the regression expressions. Therefore no relative adjustment was made within the set of data for all the wood-framed
specimens.
2. For the steel-framed specimens, it was intended to combine the sound transmission data for a new set of set of specimens with the data for nine specimens studied in the previous project. Unfortunately, there were major delays in the project, and IRC proceeded with a much-needed renovation of the acoustics facility in 1998. Part of the acoustics measurements for steel-framed specimens in this project were performed after the renovation. Thus to establish a coherent set of data for steel-framed specimens, it was
necessary to determine how the renovation affected sound transmission results, and then apply appropriate adjustments to one of the two sets of data. For consistency with future studies, it was decided that the data from the preceding project should be adjusted to conform to the new “facility signature”, as discussed on the next page.
3. Harmonizing data for the two sets of specimens posed an additional problem. It was also necessary to have the final estimates for wood-framed and steel-framed specimens directly comparable. All of the former specimens had been evaluated before the laboratory renovation. For purposes of developing consistent regression expressions, all the results for the wood-framed
specimens were therefore adjusted by adding the correction to allow for the change in facility bias.
In practice, the adjustment to allow for facility signature had only marginal effect on the STC ratings and the subsequent regression expressions – in most cases the predicted STC was unchanged, and in no case did the change exceed 1 dB. However, in the interest of minimizing sources of bias, the harmonization
process described above was used.
The details of the bias associated with the facility change are presented below, and the following section on Analysis of Trends in Results presents the
regression expressions obtained after these adjustment were used in the data processing.
The Facility Signature Adjustment
The details of the changes in the facility and pertinent qualification testing are presented in the report, "Renovations of the IRC/NRC transmission loss facility for walls, and their effects", IRC Internal Report IR-826.
The change in facility signature was determined by building and testing a set of wall assemblies that replicated specimens evaluated before the renovation, and included a cross-section of the wall designs for this project. Although there is some variability, which may depend partly on the type of specimen, consistent trends were observed.
Figure 4 presents the mean difference between results observed before the renovation in 1998 and the corresponding results for nominally identical
specimens tested after the renovation. This comparison has been restricted to cases where there was good assurance of equivalent materials for all
components of the replicate constructions. Figure 4:
Mean change observed between sound transmission for a set of wall specimens evaluated after renovation of the IRC laboratory, versus corresponding pre-renovation results for nominally identical specimens.
Average Transmission Loss Change due to Renovations
-4.0 -3.0 -2.0 -1.0 0.0 1.0 2.0 3.0 4.0 63 125 250 500 1k 2k 4k Frequency, Hz Tr ansm issi on Loss, dB
This adjustment has been developed specifically for analysis of the data for this project, with emphasis on specimen designs of concern in this project, and should not be blindly applied to all previous data from the IRC laboratory. Note that where traceable test results are required, either configuration of the IRC/NRCC laboratory (pre- or post-renovation) provides acceptable sound transmission loss results that fully conform to the applicable ASTM standards, and fall within the range established in round robin testing by the major North American laboratories.
Council Canada Analysis of Trends in the Results
IRC-IR-832 8 January, 2002
ANALYSIS OF TRENDS IN THE RESULTS
Trends in the data were analyzed using multi-variate linear regression. Two general constraints must be noted:
1. Representative regression equations that are generally applicable are
obtained only when there is a reasonably uniform distribution of the values of each predictor (independent variable). This was not always possible in this study, so some anomalous results are to be expected. To minimize such effects, the application of the regression equations should be restricted to conditions matching the range of variables that was tested.
2. A regression analysis of all the measured results as one collection of data would not be fruitful. The variations in construction that are included have too great an influence on sound insulation, and the range of variables was not consistent between sets for wood-framed and steel-framed walls. Therefore, the steel-framed assemblies were analyzed as one set, and the wood-framed walls were treated as a separate set.
The regression analysis was performed using commercial software (SigmaStat Version 2.03). The specific technical criteria and process should be noted:
• All analyses used multiple stepwise regression, in a two-pass process. The first pass was an analysis of variables (ANOVA) to determine the most important independent variables and identify variables that are correlated. If correlation between variables was significant, second-pass regressions were used to determine the most appropriate variable to be included.
• In the first-pass, the F-statistic was used to gauge the contribution of the independent variables in predicting the dependent variable, STC. The criterion for considering the variable significant was “F>4.0”. Typically the ANOVA indicated that STC was most highly dependent on the mass of the surface layers, but other variables were also significant. This did not always identify all the variables that were known to be important. This could occur because the range in the values tested for that variable was too small.
• Where basic theory suggested variables were important, but they marginally failed the F-statistic test, a second set of criteria was used. These included the VIF (variance inflation factor), P-value (probability of being wrong), “R-squared” and the standard error. VIF greater than 1.5 indicates variables that are correlated. (An example would be thickness, bending stiffness and surface density of the shear membrane - all depend directly or indirectly on the thickness, so only one should be included). Once the correlated variables have been identified using the VIF, the P-value is used to identify the variables most likely to be wrong. The variable with the lowest P-value is retained. No variables with P-values in excess of 0.20 were retained.
• After using the P-value and VIF criteria to choose the most appropriate independent variables, a second multi-variate regression was conducted to determine the variable coefficients. In this second-pass, the quality of estimate of the regression expression is judged by the R-squared and standard error estimates. The final regression was determined by the
expression that offered the lowest standard error while also satisfying the criteria for F, VIF, and P-value.
Regression Estimates for Wood-Framed Specimens
For the specimens with a single row of wood studs and an attached shear
membrane, the data for regression analysis were obtained from the experimental results by application of the corrections for facility signature. The subsequent regression analysis yielded the following equation:
STC = 36.07 + 7.16Log(DirectDensity) + 13.40Log(ResGypDensity) + 0.045(InsThick) – 1.842(RCContacts)
Standard error = 1.19 dB R-squared =0.902
Valid only within specified range of variables (see Table 1 on next page)
The variables in the regression equation were dependent on specific properties of the components of the specimen (identified in Figure 5) as follows:
DirectDensity = total surface density of the shear membrane layer and
gypsum board layer that are directly attached to the studs (kg/m2). There was a single layer of each.
ResGypDensity = total surface density of the gypsum board that is resiliently
attached to the studs (kg/m2). There may be one or two layers.
InsThick = thickness of the fibrous cavity insulation (mm)
RCContacts = total number of points at which the resilient channels were
fastened to the studs divided by the total area of the wall (number/m2)
Figure 5: Variables in the multi-variate expression for the STC are associated with important physical properties of specific components of the wall specimens. 38x89mm wood studs 400 mm o.c. Cavity Insulation (InsThick) Resilient Channels (RCContacts) Resiliently Attached Gypsum Board one or two layers (ResGypDensity) Direct Attached Layers
Gypsum Board
and Shear Membrane, one layer each
Council Canada Analysis of Trends in the Results
IRC-IR-832 8 January, 2002
The linear regression expression is a simple first-order representation of a complex non-linear problem, and must be applied with care. The regression expression is valid only to estimate STC for specimens of the same basic type, whose components fall within the range of properties of the specimens tested.
Independent Minimum Intermediate Maximum
Variable Value Values Value
Resilient Channel
Spacing (mm o.c.) 406 610, 1220 2440
Number of contacts per square meter 2.4 3.6, 6.1 8.5 Cavity Absorption
Type Glass, Rock, Cellulose
Thickness (mm) 65 none 90
Surface Density (kg/m2) 0.67 0.87, 1.16, 3.02 4.65 Direct-Attached Gypsum Board
Type Regular, Type X
Number of Layers 1 none 1
Total Surface Density (kg/m2) 7.4 13.3
Resiliently-Attached Gypsum Board
Type Regular, Type X
Number of Layers 1 none 2
Total Surface Density (kg/m2) 7.4 22.9
Studs
Spacing (mm o.c.) 406 none 406
Depth (mm) 89 none 89
Shear element
Type OSB, Plywood
Surface Density (kg/m2) 4.5 8.2
Thickness (mm) 9.5 11, 12, 12.5, 12.7 13
Fastener spacing (mm o.c.) 75 none 152
Fastener type nails, screws
Table 1: The variables and their range that were considered in the regression analysis for the specimens with a single row of wood studs and an attached shear membrane.
It should be noted that in conducting the regression analysis it was found that the range in shear membrane thickness or surface density was insufficient to
determine a meaningful functional dependence. (This is discussed in greater detail in the section entitled Analysis of Individual Variables). Consequently, the shear element is not treated independently, but is considered as contributing to the total surface density of the direct attached layers.
Resilient 12.7mm 12.7mm Type X 15.9mm Type X Channel Shear Membrane Absorption 1S&R1 1S&R2 1S&R1 1S&R2 1S&R1 1S&R2
406 mm o.c. 12.7mm OSB nailed 90mm rock fibre R13
90mm glass fibre R12 -2 0 0 0 -1
12.7mm Plywood nailed 1 3 -1
610 mm o.c. 12.7mm OSB nailed blown cellulose 3
65mm rock fibre R9 -1 65mm glass fibre R8 1 90mm rock fibre R13 0 0 90mm glass fibre R13 1 0 90mm glass fibre R12 -1 -1 1 2 2 -1 12.7mm OSB screwed 1 12.7mm OSB – perpendicular 0 12.7mm Plywood nailed -1 1 -1 12.7mm Plywood screwed 0 11mm OSB nailed 1 11mm OSB screwed 0 9.5mm Plywood 0 0
Table 2: Regression residuals for the specimens with a single row of wood studs and an attached shear membrane. Residuals are the difference between measured STC values and those predicted by the regression expression. Wall configuration is summarized by the identifier at the top of each column, 1 or 2 denotes the number of layers of gypsum board, S denotes a shear membrane, & denotes the framing, and R resilient channels. The regression expression for the wood stud shear walls was determined using a population of 44 walls. This population included two walls with the resilient channels spaced at 1220 and 2440 mm o.c. These non-standard constructions, which are not shown in the table above, allowed for a more accurate
determination of the dependence on channel spacing. This population also included approximately 7 assemblies that were complete rebuilds where
materials from different batches introduced a significant variation in one or more of the dependent variables. For these constructions, the mean residual is indicated in Table 2. (Note that since some cells contain an average, and others do not, one cannot simply sum the residuals listed in Table 2 and expect zero.) The accuracy of the regression expression can be gauged by comparing the residuals (measured STC minus the regression estimate). The predicted result should be within a range of 2 standard deviations of the prediction (i.e. 2.4 dB), nineteen times out of twenty. Inspection of the individual residuals indicates that only two of the 44 predictions are outside this range. One exception is the wall with cellulose fibre insulation which is shown in Figure 16 to exhibit a small and localized improvement in the 125 Hz one-third octave band, causing the larger single number rating. The other case is the wall with studs 406 mm o.c. and 1+2 layers of 12.7 mm Type X gypsum board, for which perhaps second order
effects such as stiffness of the gypsum board may be of importance.
The data indicate that there is no consistent over or underestimation associated with a particular variable. Thus the expression is a reasonable predictor for the walls in this study.
Council Canada Analysis of Trends in the Results
IRC-IR-832 8 January, 2002
Regression Estimates for Steel-Framed Specimens
For the steel-framed specimens, the data for regression analysis were obtained from the experimental results by application of the corrections for facility
signature to the pre-renovation data. The subsequent regression analysis yielded the following equation:
STC = 10.40 + 18.75Log(DirectGypDensity) + 15.26Log(ResGypDensity) + 0.0969(InsThick) – 0.901(RCContacts)
Standard error = 1.41 dB R-squared =0.891
Valid only within specified range of variables (see Table 3 on next page)
The variables in the regression equation were dependent on specific properties of the components of the specimen (identified in Figure 6) as follows:
DirectGypDensity = total surface density of the gypsum board that is directly
attached to the studs (kg/m2). There may only be one or two layers;
ResGypDensity = total surface density of the gypsum board that is resiliently
attached to the studs (kg/m2). There may only be one or two layers.
InsThick = thickness of the fibrous cavity insulation (mm);
RCContacts = total number of points at which the resilient channels are
fastened to the studs divided by the total area of the wall (number/m2).
Figure 6: Variables in the multivariate expression for the STC are
associated with important physical properties of specific components of the wall specimens.
41x92 mm 16 or 20 Ga. Steel studs, 400 mm o.c.
Cavity Insulation (InsThick) Resilient Channels (RCContacts) Resiliently Attached Gypsum Board one or two layers (ResGypDensity) Direct Attached
Gypsum Board one or two layers (DirectGypDensity)
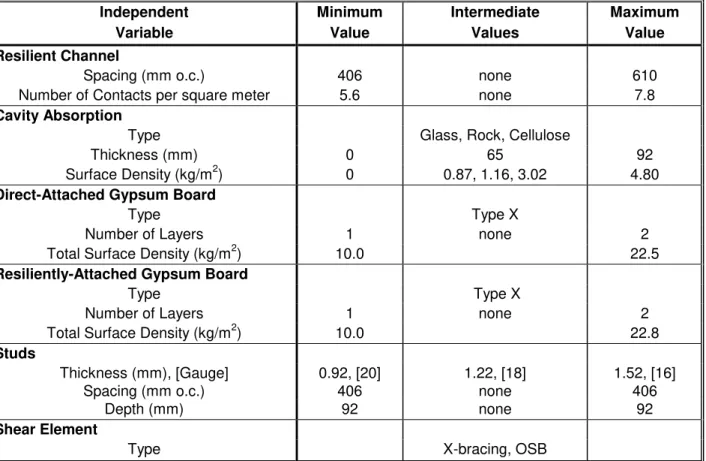
The linear regression expression is a simple first-order representation of a complex non-linear problem, and must be applied with care. The regression expression is valid only to estimate STC for specimens of the same basic type, whose components fall within the range of properties of the specimens tested.
Independent Minimum Intermediate Maximum
Variable Value Values Value
Resilient Channel
Spacing (mm o.c.) 406 none 610
Number of Contacts per square meter 5.6 none 7.8
Cavity Absorption
Type Glass, Rock, Cellulose
Thickness (mm) 0 65 92
Surface Density (kg/m2) 0 0.87, 1.16, 3.02 4.80 Direct-Attached Gypsum Board
Type Type X
Number of Layers 1 none 2
Total Surface Density (kg/m2) 10.0 22.5
Resiliently-Attached Gypsum Board
Type Type X
Number of Layers 1 none 2
Total Surface Density (kg/m2) 10.0 22.8
Studs Thickness (mm), [Gauge] Spacing (mm o.c.) 0.92, [20] 406 1.22, [18] none 1.52, [16] 406 Depth (mm) 92 none 92 Shear Element
Type X-bracing, OSB
Table 3: The variables and their range that were considered in the regression analysis for the specimens with load-bearing steel studs.
Council Canada Analysis of Trends in the Results
IRC-IR-832 8 January, 2002
16 Gauge Steel Studs 406 mm oc
Resilient 12.7mm Type X 15.9mm Type X Channel Shear Membrane Absorption 1&R1 1&R2 2&R2 1&R1 1&R2 2&R2
406 mm o.c. none 90 mm glass fibre R12 0 -3 -1
90 mm rock fibre R13 -1
610 mm o.c. none 90 mm glass fibre R12 1 1 0
90 mm rock fibre R13 1
20 Gauge Steel Studs 406 mm oc
Resilient 12.7mm Type X 15.9mm Type X
Channel Shear Membrane Absorption 1&R1 1&R2 2&R2 1&R1 1&R2 2&R2
406 mm o.c. none 90 mm glass fibre R12 -2 -1 0 -2 0
90 mm rock fibre R13 0
none
90 mm blown cellulose 0 Cross brace - blocking 90 mm rock fibre R13 1
cross brace 0
610 mm o.c. none 90 mm glass fibre R12 -2 0 0 -1 -1 -1
90 mm rock fibre R13 -1 3
none 0 0
Table 4: Regression residuals, the difference between measured STC values and those predicted by the regression expression for the steel stud assemblies. Wall configuration is
summarized by the identifier at the top of each column, 1 or 2 denotes the number of layers of gypsum board, & denotes the framing, and R resilient channels.
The regression expression for the structural steel stud walls was determined using a population of 27 walls. This population did not include any rebuild assemblies.
The accuracy of the regression expression for the steel stud assemblies can be gauged by comparing the residuals (measured STC minus the regression estimate). The sum of the residuals is zero, which indicates that on average there is no bias in the estimation. Inspection of the individual residuals indicates that there is no consistent over or underestimation associated with a particular variable. Thus the expression is a reasonable predictor for the walls in this study.
ANALYSIS OF INDIVIDUAL VARIABLES
This section reports on the trends in the transmission loss observed for each type of stud where a structured a succession of small changes were introduced to one component while all others were held constant. These trends (exhibited by observable changes in pair-wise transmission loss comparisons) are used explain the presence or absence of physical parameters in the regression expressions for the single number STC rating derived for the set of walls in tis study.
For example, the effect due to different types of insulation was evaluated in a wood stud wall where the studs, shear membrane, and the type and attachment of the gypsum board were all held constant. A similar approach was used for the 20 gauge steel-framed assemblies, although the parametric variations were more limited. This provided a basis for evaluating the changes due to specific parameters.
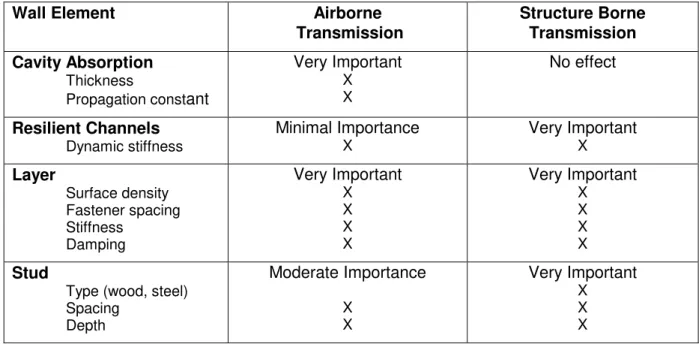
The transmission loss of a double leaf construction (a wall or floor) is determined by the sum of two transmission paths; an airborne path through the cavity and a structure borne path via the framing. Walls and floors that have high sound insulation have, by design, elements that control both of these paths. Table 5 relates the elements of the wall to the two transmission paths. The series of pair-wise comparisons of this section is used to explore the importance of these construction elements and details.
Wall Element Airborne
Transmission
Structure Borne Transmission Cavity Absorption
Thickness
Propagation constant
Very Important X X No effect Resilient Channels Dynamic stiffness Minimal Importance X Very Important X Layer Surface density Fastener spacing Stiffness Damping Very Important X X X X Very Important X X X X Stud
Type (wood, steel) Spacing Depth Moderate Importance X X Very Important X X X
Table 5: The construction elements of the wall and their relation to the two transmission paths. The physical characteristics that determine the sound insulation are also identified.
Council Canada Analysis of Individual Variables
IRC-IR-832 8 January, 2002
The construction of the assemblies in the pair-wise comparisons given in the following section are identified using a short hand description, the key to which is given below:
Surface Layers:
nGxx ‘n’ layers of Gypsum board with a nominal thickness of ‘xx’ mm.
OSBxx Oriented strand board with a nominal thickness of ‘xx’ mm.
PLYxx Plywood with a nominal thickness of ‘xx’ mm. Framing
WSxx(ss) Wood studs with a nominal depth of ‘xx’ mm spaced ‘ss’ mm apart.
SSxx(ss) Steel studs with a nominal depth of ‘xx’ mm spaced ‘ss’ mm apart.
RCxx(ss) Resilient channels with a thickness of ‘xx’ mm and spaced ‘ss’ mm apart.
Contents of the Cavity
GFBxx Glass fibre batts with a nominal thickness of ‘xx’ mm.
MFBxx Rock fibre batts with a nominal thickness of ‘xx’ mm.
CFLxx Blown cellulose fibre with a nominal thickness of ‘xx’ mm.
AIRxx Air space with a nominal depth of ‘xx’ mm.
Note that for this key, all dimensions are rounded to the nearest millimetre. Thus, for example 12.7 mm gypsum board is listed as G13.
Construction Details Affecting Structure Borne Transmission
Simple impedance-based theory suggests that the structural power flow between the stud and gypsum board is determined by the impedance of the gypsum board, the stud, and fasteners. The effective impedance of the fasteners is proportional to their number in the high frequencies where the wavelength (in either the stud or the gypsum board) is much smaller than the fastener spacing. This high-frequency approximation proves to be adequate to rank the effect of most construction changes involving resilient channels since their spacing is rather large compared to the wavelength for most frequencies of interest in this report.
Resilient channels are often used to isolate (create an impedance mismatch between) the stud and gypsum board thereby reducing the power flow. Increasing the spacing between the channels further reduces structure borne transmission and the transmission loss increases until the structural transmission path is no longer the most important path, as shown in Figure 7.
Figure 7:
Change in transmission loss associated with increasing the spacing of the resilient channels on a wood stud shear wall. (Construction details are identified below the figure title).
Effect of Resilient Channel Spacing
G16_OSB13_WS89(406)_GFB90_RC13(xxxx)_2G16 15 25 35 45 55 65 75 63 125 250 500 1k 2k 4k Frequency, Hz Tr ansm issi on Loss, dB 2440 mm o.c. STC 63 406 mm o.c. STC 50 610 mm o.c. STC 55 1220 mm o.c. STC 61
Increasing the channel spacing from 1200 to 2400 mm o.c. is of minimal benefit over a considerable frequency range (100-630 Hz) because airborne
transmission through the cavity becomes dominant.
The improvement due to adding resilient channels, or increasing their spacing, is expected to differ for walls with different types of framing. The effect of resilient channels should be less for steel studs, because they are more compliant than wood studs of the same nominal depth. This is shown by the relative magnitude of the coefficients describing the resilient channels in each of the regression expressions. The coefficient for the 2x4 wood stud assemblies is twice that in the expression for the steel stud assemblies.
Figure 8 provides the comparison of sound insulation for the nominally identical wall with structural steel studs and with wood studs.
Figure 8:
Change in transmission loss associated with changing the gauge of the structural steel studs from 16 to 20 gauge
(Construction details are identified below the figure title).
Comparison of Stud Type, Steel or Wood in a nominally identical wall
2G13_xx90(406)_MFB90_RC13(610)_2G13 15 25 35 45 55 65 75 63 125 250 500 1k 2k 4k Frequency, Hz 20 Ga steel 41x92 mm STC 60 16 Ga steel 41x92 mm STC 59 38x89 mm wood stud STC 56
Figure 8 indicates that over a considerable portion of the low frequency range (100-500 Hz), the wall with steel studs of gauge of 16 or 20 offered greater transmission loss when compared to the nominally identical wall with wood studs. The STC rating for these walls is controlled by the transmission loss at
Council Canada Analysis of Individual Variables
IRC-IR-832 8 January, 2002
125 Hz, so the improvement in low frequency transmission loss is reflected in the improved STC rating. At frequencies above 1250 Hz, the wood stud and 20 gauge steel stud walls offer very similar sound transmission but the wall with the 16 gauge studs has considerably lower transmission loss. The reason for this was not established; it may be characteristic only of the single 16 gauge stud assembly tested in this project.
Comparing the results of the steel stud walls of the same figure, it appears that there is a slight improvement due to decreasing the thickness of the studs from 16 and 20 gauge when the gypsum board on one side of the wall is mounted on resilient channels. To examine this more reliably, data for several pairs of specimens were evaluated.
Figure 9 shows the mean improvement as a result of changing the stud gauge from 16 to 20 for six different pairs of gypsum board walls all having resilient channels and an STC of 49 or greater. The figure suggests that there may be some frequencies at which there is little or no improvement as a result of changing the gauge from 16 to 20 when the wall has resilient channels . (The effect of stud gauge is expected to be considerably more pronounced if there are no resilient channels. In this case, the gypsum board is direct-attached to both sides of the studs and the compliance of the studs determines the degree of structural coupling.) In terms of a single number rating, the STC increased, on average, by 1.2 with a standard deviation of 1.2. Thus, the STC for some walls may not change while for others there may be a small change.
Figure 9:
Mean improvement as a result of changing the stud gauge from 16 to 20 for six different gypsum board walls all having resilient channels and an STC of 49, or greater. The dashed lines indicate the range of one standard deviation about the mean.
Effect of Changing the Stud Gauge from 16Ga. to 20Ga.
average of 6 walls -4.0 -3.0 -2.0 -1.0 0.0 1.0 2.0 3.0 4.0 63 125 250 500 1k 2k 4k Frequency, Hz Change to STC 1.2 +/- 1.2
In the companion study of fire resistance, walls were made using both MSG 20 (0.912 mm) and MSG 20 light studs (0.840 mm). This represents a difference in the nominal thickness of approximately 9 percent. Given the characteristic change of 1.2 ± 1.2 in the STC as a result of reducing the actual thickness by 59% (16 to 20 gauge actual thickness as shown in Table A5), it is clear that a change of only 9% due to the light designation should be insignificant. Thus, for practical purposes the results of this report are equally applicable to walls with
steel studs bearing the light designation. (This was not true for the companion fire resistance study).
Theory predicts that structural power flow between the direct attached layers will increase proportionally with the number of fasteners (screws and/or nails) when the spacing between the fasteners is large compared to the wavelength. (In this regime the layers are connected to the studs by a series of locally acting points). When the fastener spacing becomes smaller, the layer is effectively
"line-connected" to the studs and increasing the number of fasteners does not increase power flow. However, the standard installation cases tested in this project do not illustrate this transition.
Figure 10:
Effect associated with doubling the number of fasteners securing the shear membrane to the wood studs. (Construction details are identified below the figure title).
Effect of Doubling the Number of Fasteners for the Shear-Membrane
G16_PLY13_WS89(406)_GFB90_RC13(610)_2G16 15 25 35 45 55 65 75 63 125 250 500 1k 2k 4k Frequency, Hz Tr ansm issi on Loss, dB Double Density STC 55 75 mm around panel edges 150 mm in the field Normal Density STC 55 150 mm around panel edges 300 mm in the field
Figure 10 indicates that there is no appreciable effect associated with doubling the number of fasteners in the OSB shear membrane. This implies that with the normal density of fasteners in the shear membrane, plus those of the gypsum board layer on top of it, the layers were effectively line-connected to the wood studs.
Similarly, no appreciable effect associated with changing the fastener type from nails to screws was observed, as shown in Figure 11.
Council Canada Analysis of Individual Variables
IRC-IR-832 8 January, 2002
Figure 11:
Effect associated with changing the type of fasteners (nails or screws) used to secure the shear membrane to the studs. (Construction details are identified below the figure title).
Effect of Fastener Type for Shear Membrane Screws Vs. Nails G16_OSB13_WS90(406)_GFB90_RC13(610)_2G16 15 25 35 45 55 65 75 63 125 250 500 1k 2k 4k Frequency, Hz Tr ansm issi on Loss, dB Screws STC 55 Nails STC 56
It might be expected that the cross bracing and blocking which are common elements in a shear resistant steel stud wall might have an effect on the
transmission loss since these structural elements distribute forces across all the studs. Figure 12 indicates that cross bracing and blocking did not appreciably change the transmission loss. Thus, the steel stud walls presented in this report will likely exhibit a similar single number STC rating, with or without cross bracing and blocking. The figure also shows that if a shear membrane, in the form of an OSB panel, is used instead of the cross bracing and blocking, then a significant improvement can be realized because of the increased mass of the direct-attached layers. This additional mass has a significant effect because it reduces the structure borne component by increasing the impedance of the direct applied layers, and also the airborne component (as discussed in the next section). Figure 12:
Effect associated with introducing blocking, and/or shear resistant cross bracing in a 20 gauge (0.91 mm) structural steel stud wall. Also shown is the same wall with an OSB shear membrane to illustrate that the additional mass of the shear panels improves the transmission loss. (Construction details are identified below the figure title).
Effect of Shear Elements
G13_SS92(406)_MFB89_RC13(406)_2G13 15 25 35 45 55 65 75 63 125 250 500 1k 2k 4k Frequency, Hz Tr ansm issi on Loss, dB
no cross bracing or blocking, STC 51 cross bracing, STC 51
cross bracing and blocking, STC 52 OSB shear
membrane STC 57
Summary, Structure Borne Transmission:
An effective method of controlling structure borne transmission must break the structural connection between the gypsum board layers on the two faces of the wall. This is best done using double stud construction. However, if this is not possible and a single stud wall must be used, the layers on one side of the wall should be resiliently mounted.
Increasing the mass of the direct attached layers will improve the sound insulation but not as significantly as reducing the vibration transfer through the studs. This can be accomplished using resilient channels, which should be spaced as far apart as possible to minimize the number of connections to the studs. Similarly, the largest acceptable stud spacing should be used, because this also reduces the number of connections.
Construction Details Affecting Airborne Transmission
Conceptually, airborne transmission through a cavity wall seems very simple -incident sound waves cause pressure fluctuations on the source side of the wall, which force the gypsum board layer(s) into motion. The motion of the gypsum board causes pressure fluctuations in the cavity, which in turn forces the gypsum board on the other side of the cavity into motion and sound is radiated into the receive space.
To discuss the functional dependence of the various elements that form the wall it is necessary to recognize that there will be two mechanisms of energy
transport across the air cavity. They are resonant transmission and non-resonant transmission, respectively. Unfortunately these transmission
mechanisms are not separable and can not be measured independently, so the measured transmission loss curves will most likely exhibit trends defined by the sum of the energies due to both mechanisms.
The various parameters used to generate the regression expressions are now investigated using pair-wise comparisons.
Cavity Absorption
Experimental studies have shown that adding fibrous material to the cavity of a wall can significantly enhance the attenuation of airborne sound. The
improvement in the airborne transmission loss is a complex function of many variables, several of which are interrelated and can not be fully separated. Unfortunately, there has not been a thorough systematic study of fibrous materials in gypsum board walls, however the following macroscopic properties of the material are known to be factors:
• Portion of the cavity filled (for walls this is usually determined by the thickness of the fibrous material);