Surface Temperature Response to Westerly Wind Trends
The MIT Faculty has made this article openly available. Please share
how this access benefits you. Your story matters.
Citation
Doddridge, Edward W., John Marshall, Hajoon Song, Maxwell
Kelley, and Larissa Nazarenko, "Eddy Compensation Dampens
Southern Ocean Sea Surface Temperature Response to Westerly
Wind Trends." Geophysical Research Letters 46, 8 (April 2019): p.
4365-77 doi 10.1029/2019GL082758 ©2019 Author(s)
As Published
10.1029/2019GL082758
Publisher
American Geophysical Union (AGU)
Version
Original manuscript
Citable link
https://hdl.handle.net/1721.1/124780
Terms of Use
Creative Commons Attribution-Noncommercial-Share Alike
Eddy compensation dampens Southern Ocean SST response to
1
westerly wind trends
2
Edward W. Doddridge1, John Marshall1, Hajoon Song1,2, Maxwell Kelley3, and Larissa
3
Nazarenko3
4
1Earth, Atmospheric and Planetary Science, Massachusetts Institute of Technology, 77 Massachusetts Avenue, Cambridge, 5
02139, USA 6
2Department of Atmospheric Sciences, Yonsei University, 134 Sinchon-dong, Seodaemun-gu, Seoul, 120-749, Korea 7
3NASA Goddard Institute for Space Studies, 2880 Broadway, New York, NY 10025 USA 8
Key Points:
9
• Antarctic circumpolar surface cooling is a robust response to enhanced westerly
10
winds in models and observations
11
• Mesoscale eddy compensation prevents sustained upwelling of warm water beneath
12
the seasonal ice zone (SIZ)
13
• Mesoscale eddy processes damp the response of the SIZ to enhanced westerly winds
14
Abstract
15
Anthropogenic influences have led to a strengthening and poleward shift of the westerly
16
winds blowing over the Southern Ocean (SO), especially during the austral summer months.
17
We use observations, an idealized high-resolution eddying-sea-ice channel model, and a
18
global coupled climate model to explore the response of the SO to a step-change in the
19
westerly wind. Previous work has hypothesized a two timescale response for sea surface
20
temperature. Initially, horizontal Ekman transport away from Antarctica cools the
sur-21
face before sustained upwelling of warm subsurface water leads to warming on decadal
22
timescales. We find that the fast timescale response is robust across our two models and
23
in accord with our analysis of observations: it consists of Ekman driven cooling in the
24
mixed layer, warming at the temperature inversion due to anomalous upwelling, and
warm-25
ing in the seasonal thermocline due to enhanced vertical mixing. The long-term response
26
is inaccessible from observations. However, neither of our models shows a long term
sub-27
surface warming. In our eddying channel this is a consequence of an eddy-driven
circu-28
lation opposing the wind induced upwelling. This "eddy compensation" is also a feature
29
of, although less pronounced in, our coupled climate model. Our results highlight the
im-30
portance of accurately representing the mesoscale eddy contribution to the residual
over-31
turning circulation. We conclude that climate models which exhibit pronounced
subsur-32
face warming due to wind-induced upwelling are inconsistent with our understanding of
33
SO dynamics and eddy compensation, and are unlikely to be able to capture the observed
34
multi-decadal cooling SST trend around Antarctica.
35
1 Introduction
36
Over the satellite era the surface of the Southern Ocean around Antarctica has been
37
observed to cool, in contrast to much of the rest of the earth’s surface [see e.g. Armour
38
et al., 2016; Marshall et al., 2015, and references therein]. There has also been a striking
39
trend in the Southern Annular Mode (SAM) over the same period, with the SAM
trend-40
ing upwards [Marshall, 2003; Jones et al., 2016], especially during the austral summer
41
months of December, January, and February. Several modeling studies have suggested that
42
the equilibrium response to a positive shift in the SAM is expected to be warming at the
43
sea surface and a reduction in ice cover [Bitz and Polvani, 2012; Sigmond and Fyfe, 2010,
44
2013]. To reconcile the observed cooling and the modeled equilibrium warming Ferreira
45
et al. [2015] and Marshall et al. [2014] proposed that the Southern Ocean responds to a
step in the SAM on two distinct timescales; a rapid cooling, followed by a much slower
47
warming trend. The mechanism behind this two-timescale response invokes surface
Ek-48
man transports to initially cool the sea surface, with Ekman upwelling eventually bringing
49
warmer subsurface water, from below the wintertime mixed layer, up to the surface in the
50
seasonal ice zone. Other recent studies have suggested additional processes that contribute
51
to the formation of the cold SST anomaly, including atmospheric changes that alter the
52
surface radiation budget [Seviour et al., 2017a] and upwelling of cold water from the
pre-53
vious winter’s mixed layer [Purich et al., 2016].
54
Analysis of the models within the CMIP5 archive reveals substantial agreement on
55
the initial cooling in response to a zonal wind change, but a range of long-term responses
56
from continued cooling to rapid warming. The state of affairs is shown in Figure 1 a)
57
adapted from Kostov et al. [2017, 2018]. Kostov et al. [2018] conclude that models which
58
rapidly cross over from cooling to warming in response to a step change in the westerly
59
winds are incompatible with the observed cooling of SST over the past 40 years, given the
60
upward trending SAM over the same period. It should be noted that the historical
simu-61
lations from the CMIP5 archive models underestimate the trend in westerly winds when
62
compared with observations [Purich et al., 2016]. While this should not bias the results
63
of Kostov et al. [2017, 2018], since those analyses present temperature changes per unit
64
change in the SAM, the underestimation of the westerly wind trend likely contributed to
65
the inability of CMIP5 models to capture observed Antarctic sea ice trends [Purich et al.,
66
2016].
67
The long term subsurface warming trend discussed by Ferreira et al. [2015] is driven
68
by an intensification of the Deacon Cell due to enhanced westerly winds. However, the
ex-69
pected long-term response of the SO overturning circulation to changes in wind stress is
70
not a sustained strengthening of the Deacon Cell [see e.g. Downes and Hogg, 2013; Gent,
71
2016; Marshall and Radko, 2003; Viebahn and Eden, 2010]. It is instead the residual
be-72
tween an intensification of the wind-driven Deacon Cell and an opposing change in the
73
eddy-driven circulation. The resulting change to the residual overturning circulation is
ex-74
pected to be much smaller than the initial perturbation to the Deacon Cell, and to have
75
a different spatial structure. The horizontal resolution of CMIP5 models is too coarse to
76
resolve mesoscale eddies, which must therefore be parameterized [Gent and Mcwilliams,
77
1990; Gent et al., 1995]. Previous research has shown that mesoscale eddy effects are
cru-78
cial for accurately simulating the behavior of the residual overturning circulation [Downes
and Hogg, 2013; Marshall and Radko, 2003] and the strength of the Antarctic
Circum-80
polar Current [Munday et al., 2013]. Using a mesoscale eddy parameterization
coeffi-81
cient that varies in time and space substantially improves solutions of non-eddy-resolving
82
ocean models, and perhaps how they respond to perturbations [Danabasoglu and Marshall,
83
2007; Ferreira et al., 2005; Gent, 2016]. We might therefore expect that the response of
84
ocean models to changes in the wind depends critically on whether they resolve the eddies
85
responsible for the compensation or, if not, whether they have sufficiently skillful eddy
86
parametrizations to faithfully simulate eddy compensation.
87
2 Observed response of the Southern Ocean to SAM
97
The expected short term response in the two timescale framework proposed by
Fer-98
reira et al. [2015] is a surface cooling and a warming at the temperature inversion1 below
99
the seasonal ice zone. Can we detect this signal in observations? Taking the average sea
100
surface temperature (SST) between 55S and 70S from Reynolds et al. [2002], we can
as-101
sess the short term response by comparing the DJF SST anomaly, Figure 1 b) blue line,
102
and the DJF SAM value, Figure 1 b) orange line. Following Marshall [2003] the DJF
103
SAM values are labeled for the year in which the December occurred. A linear regression
104
of the DJF SAM values and the DJF SST yields a strong negative correlation (R2 =0.36,
105
p ⇡ 9 ⇥ 10 5). This supports the idea that the initial response to a SAM is a surface
cool-106
ing in the Southern Ocean close to Antarctica, as has been shown previously in
observa-107
tions [Ciasto and Thompson, 2008; Doddridge and Marshall, 2017] and modeling studies
108
[Ferreira et al., 2015; Seviour et al., 2016, 2017a].
109
Using gridded data from the Argo array [Roemmich and Gilson, 2009] we can
ex-110
plore the initial zonal mean response to SAM anomalies below the surface of the Southern
111
Ocean. However, there are several observational limitations that should be noted. Firstly,
112
the gridded Argo dataset does not extend southwards into the seasonal ice zone, and so
113
we are unable to assess the subsurface warming at the temperature inversion, which is a
114
crucial component of the long timescale proposed by Ferreira et al. [2015]. Secondly, the
115
time series is relatively short, which limits the statistical significance of the results.
De-116
spite these limitations, a regression analysis of zonal mean February temperatures from
117
1The temperature inversion is the region below the seasonal ice zone where dT/dz < 0, and hence upwelling leads to warming. This region is clearly visible in the temperature contours in the left hand side of Figure 1 c)
0 5 10 15 20 25 30 35 Time (years) 0.2 0.1 0.0 0.1 0.2 0.3 T emp erature anomaly ( C) a) 1980 1985 1990 1995 2000 2005 2010 2015 Time (year) 0.6 0.4 0.2 0.0 0.2 0.4 DJF SST anomaly ( C) b) 60 55 50 45 40 Latitude 400 350 300 250 200 150 100 50 0 Depth (m)
c) Zonal mean Argo temperature anomaly from 1 SAM
4 2 0 2 4 DJF SAM 0.08 0.06 0.04 0.02 0.00 0.02 0.04 0.06 0.08 T emp erature anomaly p er unit SAM ( C) ACCESS1-0 ACCESS1-3 BCC CanESM CCSM4 CESM (CAM5) CMCC CM CNRM CM GFDL CM3 GFDL ESM2G GFDL ESM2M GISS E2 H GISS E2 R IPSL CM5A LR IPSL CM5A MR IPSL CM5B LR MIROC5 MIROC-ESM MPI-ESM-LR MPI-ESM-MR MRI CGCM3 NorESM1M GISS E2.1
Figure 1. a) Climate response functions of the SST to a 1 step change in the SAM index inferred from many different coupled CMIP5 climate models, modified from Kostov et al. [2017]. The response of the cou-pled model used here, developed at GISS and described in the supplementary information, is shown by the thick black line. b) DJF SAM time series from Marshall [2003] (blue line, right axis), and DJF sea surface temperature anomaly between 55S and 70S calculated from Reynolds et al. [2002] data (orange line, left axis). c) Zonal mean temperature anomaly in February due to a 1 DJF SAM anomaly, estimated from gridded Argo data [Roemmich and Gilson, 2009] and a time series of observed SAM values [Marshall, 2003]. The black line is the climatological zonal mean mixed layer depth from Holte et al. [2017], and the gray contours show the zonal mean temperature field with a contour interval of 1 C.
88 89 90 91 92 93 94 95 96
the Argo dataset against the DJF SAM time series [Marshall, 2003] reveals a signal of
118
cooling in the mixed layer and warming below, as shown in Figure 1 c). The vertical
119
dipole in Figure 1 c) is centered just beneath the climatological February mixed layer
depth from Holte et al. [2017], shown in black; this is consistent with the strengthened
121
westerly winds enhancing mixing and deepening the mixed layer. This enhanced mixing
122
moves heat downward through the water column, strengthening the cold anomaly in the
123
mixed layer and warming the fluid below the mixed layer. This warming below the mixed
124
layer is not part of the long term warming mechanism of Ferreira et al. [2015]. Rather, it
125
is an as yet undescribed feature of the short term response. In later sections we will see
126
that this vertical dipole is a robust feature across models, and show that it is caused by
127
enhanced vertical mixing associated with stronger winds. The Argo data also reveal a
re-128
duction in salinity below the mean mixed layer depth (not shown); this is also consistent
129
with enhanced vertical mixing drawing fresh water down from the surface.
130
3 Response of an eddying-ice ocean channel model to a step change in the westerly
131
wind
132
We use a high resolution idealized eddy-resolving channel model to explore the
im-133
portance of resolved mesoscale variability and eddy compensation in the response of the
134
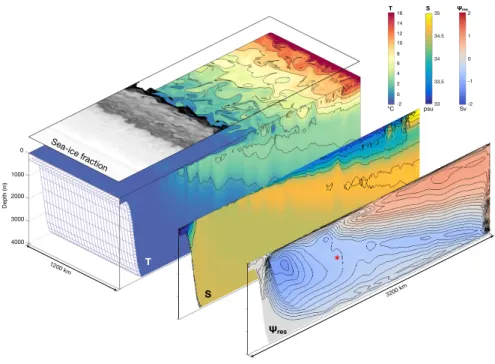
SO to a step change in the westerly wind. An overview of our idealized model is shown
135
in Figure 2 and a more detailed description of the model configuration is given in the
136
supplementary information. The model captures the dynamics of the seasonal ice zone
137
and its interaction with a Circumpolar Current and its overturning cells. The domain is
138
a reentrant channel 1200 km long and 3200 km wide. There is a continental shelf at the
139
southern edge, and a flat bottom elsewhere in the domain. A sponge region at the
north-140
ern boundary allows for a meridional overturning circulation. A meridional slice of the
141
monthly mean CORE normal year forcings from 30 E is used for the external forcing
142
fields. The meridional slice is tiled in the zonal direction to cover the entire domain, and
143
hence there is no zonal variation in the surface forcings. The residual overturning
stream-144
function, shown in the outermost panel of Figure 2, exhibits both an upper cell and a
145
lower cell, with the upwelling in the interior occurring along density surfaces, as expected
146
[Marshall and Speer, 2012].
147
Once the channel model has reached a statistical equilibrium, we run two ensembles:
153
a control ensemble using the same forcing as the spin up, and a perturbation ensemble in
154
which the zonal wind speed, surface air temperature and specific humidity are altered in
155
the austral summer months by the addition of a SAM-like anomaly. The perturbation is
156
described in the supplementary information. We perturb the surface air temperature and
0 1000 2000 3000 4000 Depth (m) 1200 km 3200 km Sea-ice fraction T S Ψres 16 14 12 10 8 6 4 2 0 -2 35 34.5 34 33.5 33 2 1 0 -1 -2 ℃ psu Sv T S Ψres
Figure 2. Overview of the idealized re-entrant channel eddying-ice control solution showing the instanta-neous winter time sea ice concentration, temperature, and salinity fields, as well as the time-averaged residual overturning circulation. The model is driven by CORE normal year winds and fluxes. Note the presence of cold, fresh water at the surface in the region of the SIZ and a pronounced temperature inversion below. The red star denotes the position where a timeseries of residual-overturning strength in plotted in figure 3.
148 149 150 151 152
specific humidity so as to prevent unrealistic damping of SST anomalies after the
applica-158
tion of the zonal wind perturbation; if these atmospheric fields are left unaltered then the
159
SST anomaly decays much faster than observational estimates suggest is realistic [Ciasto
160
and Thompson, 2008; Doddridge and Marshall, 2017; Hausmann et al., 2016]. We find
161
that four ensemble members are sufficient to obtain a robust response.
162
Above, we hypothesized that our eddy resolving model might not exhibit long term
163
subsurface warming because the eddy-driven overturning circulation would spin up to
164
compensate for the wind-driven change to the residual overturning circulation. The
sur-165
face of our idealized channel model initially cools by approximately 0.05 C, as shown in
166
Figure 3 a). While the magnitude of the SST anomaly decreases during the 10 year
simu-167
lation, we do not see sustained long term warming. The initial cooling is consistent with
168
that found in the CMIP5 models by Kostov et al. [2017]. Our model does not exhibit long
169
term warming at the temperature inversion. The lack of a long term subsurface warming
can be understood by considering the response of the residual overturning streamfunction.
171
Figure 3 a) shows a time series of the anomalous residual overturning circulation extracted
172
at the red star in the outermost panel of Figure 2. The star is located underneath the
sea-173
sonal ice zone and ideally placed to provide an estimate of the anomalous upwelling
re-174
sponsible for the long warming predicted by Ferreira et al. [2015].
175
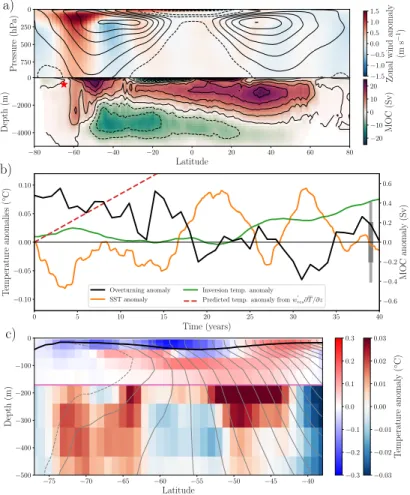
We find that the imposed wind anomaly initially strengthens the Deacon Cell and
189
increases the upwelling through the temperature inversion, as shown in Figure 3 a) and
190
b). However, within three years the eddy-driven overturning circulation strengthens to
op-191
pose this residual circulation change, as shown by the decrease in the overturning anomaly
192
given by the black line in Figure 3 a). At equilibrium there is a relatively small net change
193
in the residual overturning streamfunction at this location, see Figure 3 a). Such a rapid
194
compensation timescale is consistent with previous estimates of the eddy spinup timescale
195
from observations [Meredith and Hogg, 2006] and idealized models [Screen et al., 2009;
196
Sinha and Abernathey, 2016]. Without sustained upwelling through the temperature
inver-197
sion the mechanism proposed by Ferreira et al. [2015] cannot lead to long term warming.
198
In addition to these anticipated responses, we also find a warm anomaly below the
199
zonal mean mixed layer depth, as shown in Figure 3 b). This is very similar to the signal
200
in the observations shown in Figure 1c. Heat budgets for the two rectangles in 3 b) are
201
shown in c) and d). These indicate that the warming in the temperature inversion is due
202
to enhanced upwelling as expected, while the warming below the mixed layer is due to
203
enhanced vertical mixing. Further evidence for enhanced vertical mixing can be found in
204
the salt distribution (not shown) and the mixed layer depth; the zonal mean mixed layer is
205
consistently deeper in the perturbation ensemble than the control ensemble.
206
In summary we find that the initial response of the idealized channel model is
con-207
sistent with the short timescale response proposed by Ferreira et al. [2015]: we see a
cool-208
ing at the surface driven by horizontal Ekman transport, and a warming at the level of the
209
temperature inversion due to enhanced upwelling. However, we do not observe the
sub-210
surface long-term warming hypothesized by Ferreira et al. [2015] because the residual
211
overturning circulation required to create it rapidly (within a few years) damps away.
4 Response to a step ozone perturbation in a comprehensive coupled climate model
213
In this section we present results from simulations using the most recent NASA
214
GISS coupled climate model, Model E2.1. Details of the model setup can be found in
215
the supplementary information. From a long equilibrium pre-industrial control, we spawn
216
perturbation experiments in which a seasonal hole in the stratospheric Antarctic ozone
217
distribution is imposed to mimic conditions in the 1990s. Eight ensemble members are
av-218
eraged to reduce the impact of internal variability. The ozone perturbation leads to a
pole-219
ward shift of the jetstream, with enhanced summertime westerly winds around Antarctica
220
and reduced westerlies further north. The upper panel of Figure 4 a) shows the
climato-221
logical zonal wind (contours) and anomalies reaching down to the surface (colors). This
222
enhancement of westerly winds during the austral summer is a well known consequence of
223
stratospheric ozone depletion [see e.g. Gerber and Son, 2014; Polvani et al., 2011; Seviour
224
et al., 2017b]. What happens in the underlying ocean?
225
The strengthened surface westerly winds initially cause cold SST anomalies through
226
enhanced equatorward Ekman transport in the underlying ocean. A time series of the SST
227
anomalies is shown by the orange line in Figure 4 b). We also observe anomalous
up-228
welling due to a Deacon Cell-like perturbation to the residual overturning circulation. A
229
time series of the anomalous overturning streamfunction is shown by the black line in
230
Figure 4 b). Note that there is considerably more variability in these fields compared to
231
the channel model, even though twice as many ensemble members were averaged. This is
232
because of internal variability in the coupled model that is not present in the ocean-only
233
model despite the presence of intense mesoscale variability in the latter. Note that the
234
anomalous residual overturning circulation decays away over time, on the same time-scale
235
as that of the SST and inversion temperature anomaly, all three exhibiting synchronous
os-236
cillations. Beyond 15 years or so natural variability of the coupled system dominates, the
237
amplitude of which is indicated by the vertical gray bar in figure 4 b).
238
Figure 4 c) shows the vertical structure of the temperature anomalies in February of
239
the second year of the simulation. We see a vertical cooling-warming dipole centered on
240
the mixed layer depth, and a weak warming in the temperature inversion, which is
strik-241
ingly similar to that found in the channel model in Figure 3 b) and in the observations,
242
Figure 1 c). Much as in the eddying channel model, the warm anomaly at the level of the
243
temperature inversion does not grow substantially during the first 20 years of the
bation, see the green line in Figure 4 b). After 20 years the temperature anomaly at the
245
inversion does increase, but anomalous upwelling cannot be the causal mechanism since
246
the overturning anomaly is small by this time, see blue line in Figure 4 b). As discussed
247
previously, the initial SST response reveals a cooling, but the long term evolution of SST
248
is less clear. Despite analyzing an ensemble of simulations the presences of internal
vari-249
ability with a magnitude of approximately 0.1 K from year 15 onwards makes it difficult
250
to identify whether a warming trend is present in the latter part of the time series. Taking
251
an average of the SST anomaly between years 20 and 40 shows a small warming,
consis-252
tent with the climate response function shown in Figure 1 a). Despite the variability in the
253
latter part of the time series, the lack of warming at the temperature inversion during the
254
time period with anomalous upwelling rules out the mechanism proposed by Ferreira et al.
255
[2015] as a source of any long term warming in this model.
256
We conclude that, just as in the eddying channel model, the GISS coupled model
257
does not exhibit a pronounced warming trend, either at the surface or at depth. This is
258
consistent with the SST CRF deduced (by lagged regression between SAM and SST) from
259
a long control run of the GISS model shown by the thick black line in Figure 1c. The
260
cross-over from cooling to warming is barely evident, even after 30 years.
261
5 Discussion and Conclusions
277
Ferreira et al. [2015] proposed a two timescale mechanism drawing together
ob-278
servational evidence that strengthening westerly winds were associated with a cooling
279
of the sea surface and an expansion of sea ice, and modeling evidence that suggested
280
stratospheric ozone depletion would eventually lead to warmer SSTs and a loss of sea ice.
281
However, the mechanism proposed by Ferreira et al. [2015] relies on a persistent
intensi-282
fication of the Deacon Cell and a growing subsurface temperature anomaly that is
even-283
tually entrained into the mixed layer thereby warming the sea surface. While we are
un-284
able to address the long term changes from observations, we do not find this mechanism
285
at work in either of our numerical experiments. Instead, we see a transient intensification
286
of the Deacon Cell, which then fades and does not lead to subsurface warming below the
287
seasonal ice zone. While atmospheric processes may also be important, as suggested by
288
Seviour et al. [2017a], the mechanism we have focused on here is an oceanic one, and we
289
find no evidence of a subsurface warming driven by anomalous upwelling. Instead, we
290
find that anomalous upwelling fades over time.
The initial response to strengthened westerly winds is consistent between the
obser-292
vations, an idealized eddying ocean sea-ice model, and a global coupled model. In each
293
of these cases we observe a vertical cooling-warming dipole centered on the zonal mean
294
mixed layer depth. The warming just below the mixed layer is driven by anomalous
verti-295
cal mixing and is unrelated to the mechanism proposed by Ferreira et al. [2015]. The
ob-296
servations and the coupled model also show a warming to the north, in the region where
297
the westerly winds weaken due to a poleward shift in the atmospheric jet.
298
The long timescale is inaccessible from observations but can be addressed in our
299
models. In both we initially find a small warming at the temperature inversion under the
300
seasonal ice zone. However, this anomaly does not continue to grow, and the models do
301
not exhibit persistent anomalous upwelling in this region. In our idealized channel model,
302
the lack of persistent upwelling is due to a change in the eddy-driven overturning
circula-303
tion which compensates for the altered wind-driven overturning; a process known as eddy
304
compensation [see e.g. Downes and Hogg, 2013; Gent, 2016; Viebahn and Eden, 2010].
305
Since the GISS model is a complex global coupled model, the lack of substantial
long-306
term warming could be due to many different physical processes. We can however say that
307
the anomalous overturning circulation induced by the ozone hole decays away over time
308
and does not lead to subsurface warming in the seasonal ice zone.
309
The global coupled model includes a parameterization for mesoscale eddies that
re-310
lates the slope of the isopycnals to the strength of the eddy-induced overturning
circula-311
tion. In the simplest parameterizations, where G M is a monolithic constant, the strength
312
of the eddy-induced circulation is directly proportional to the slope. The
parameteriza-313
tion used by GISS Model version 2.1 dynamically assigns G M based on the flow and
314
isopycnal slope. This means that the strength of the eddy-induced overturning circulation
315
is proportional to the isopycnal slop raised to the power n, where 2 n 3 (see
sup-316
plemental information for details of the parameterization). Since the eddy-induced
over-317
turning depends on the isopycnal slope raised to some power, small changes in the slope
318
produce relatively large changes in the eddy-induced overturning circulation. This
sensi-319
tivity helps to prevent wind perturbations causing large changes to the isopycnal slopes; a
320
process known as eddy compensation.
321
Our results contrast with those of Bitz and Polvani [2012] who found that their
eddy-322
resolving coupled-climate model did warm in response to an ozone perturbation. But,
figure 3 in Bitz and Polvani [2012] shows that the zonal mean ocean warming does not
324
occur near the temperature inversion. Rather, they find warming further north, and
at-325
tribute it anomalous downwelling. However, it should be noted that their figure 4 shows
326
the Eulerian-mean overturning, rather than the more pertinent residual overturning
circula-327
tion [Marshall and Radko, 2003].
328
Finally, it should be noted that Kostov et al. [2018] show that CMIP5 models have a
329
wide range of responses to a step change in the SAM. They conclude that models which
330
exhibit strong warming are incompatible with the observational record. Furthermore, long
331
term warming caused by a persistent intensification of the Deacon Cell, as hypothesized
332
by Ferreira et al. [2015], is inconsistent with our current understanding of SO dynamics.
333
Here we have presented two numerical simulations that do not exhibit long term
warm-334
ing and shown that this is related to a reduction in anomalous upwelling. Our results lend
335
support to the conclusions of Kostov et al. [2018] and identify an important ocean
mecha-336
nism at work that damps the response of the SIZ to anomalous winds.
337
Acknowledgments
338
EWD acknowledges support from the NSF’s FESD program. JM acknowledges support
339
from the MIT-GISS collaborative agreement and the NSF Polar Antarctic Program.
340
We are grateful to Douglas Kinnison for assitance with the ozone perturbation for
341
the GISS simulations. The National Center for Atmospheric Research (NCAR) is
spon-342
sored by the U.S. National Science Foundation (NSF). WACCM is a component of NCAR’s
343
Community Earth System Model (CESM), which is supported by the NSF and the
Of-344
fice of Science of the U.S. Department of Energy. Computing resources were provided by
345
NCAR’s Climate Simulation Laboratory, sponsored by NSF and other agencies. This
re-346
search was enabled by the computational and storage resources of NCAR’s Computational
347
and Information Systems Laboratory (CISL). The WACCM model output and data used in
348
this paper are listed in the references or available from the NCAR Earth System Grid.
349
References
350
Armour, K. C., J. C. Marshall, J. R. Scott, A. Donohoe, and E. R. Newsom (2016),
South-351
ern Ocean warming delayed by circumpolar upwelling and equatorward transport, Nat.
352
Geosci., 9(7), 549–554, doi:10.1038/ngeo2731.
Bitz, C. M., and L. M. Polvani (2012), Antarctic climate response to stratospheric ozone
354
depletion in a fine resolution ocean climate model, Geophys. Res. Lett., 39(20), 1–5, doi:
355
10.1029/2012GL053393.
356
Ciasto, L. M., and D. W. J. Thompson (2008), Observations of large-scale
ocean-357
atmosphere interaction in the Southern Hemisphere, J. Clim., 21(6), 1244–1259, doi:
358
10.1175/2007JCLI1809.1.
359
Danabasoglu, G., and J. C. Marshall (2007), Effects of vertical variations of thickness
360
diffusivity in an ocean general circulation model, Ocean Model., 18(2), 122–141, doi:
361
10.1016/j.ocemod.2007.03.006.
362
Doddridge, E. W., and J. C. Marshall (2017), Modulation of the Seasonal Cycle of
Antarc-363
tic Sea Ice Extent Related to the Southern Annular Mode, Geophys. Res. Lett., 44(19),
364
9761–9768, doi:10.1002/2017GL074319.
365
Downes, S. M., and A. M. C. C. Hogg (2013), Southern Ocean Circulation and Eddy
366
Compensation in CMIP5 Models, J. Clim., 26(18), 7198–7220,
doi:10.1175/JCLI-D-367
12-00504.1.
368
Ferreira, D., J. C. Marshall, and P. Heimbach (2005), Estimating Eddy Stresses by Fitting
369
Dynamics to Observations Using a Residual-Mean Ocean Circulation Model and Its
370
Adjoint, J. Phys. Oceanogr., 35(10), 1891–1910, doi:10.1175/JPO2785.1.
371
Ferreira, D., J. C. Marshall, C. M. Bitz, S. Solomon, and A. Plumb (2015), Antarctic
372
ocean and sea ice response to ozone depletion: A two-time-scale problem, J. Clim.,
373
28(3), 1206–1226, doi:10.1175/JCLI-D-14-00313.1.
374
Gent, P. R. (2016), Effects of Southern Hemisphere Wind Changes on the Meridional
375
Overturning Circulation in Ocean Models, Ann. Rev. Mar. Sci., 8(1), 79–94, doi:
376
10.1146/annurev-marine-122414-033929.
377
Gent, P. R., and J. C. Mcwilliams (1990), Isopycnal Mixing in Ocean
Cir-378
culation Models, J. Phys. Oceanogr., 20(1), 150–155,
doi:10.1175/1520-379
0485(1990)020<0150:IMIOCM>2.0.CO;2.
380
Gent, P. R., J. Willebrand, T. J. McDougall, and J. C. McWilliams (1995),
Parameteriz-381
ing Eddy-Induced Tracer Transports in Ocean Circulation Models, J. Phys. Oceanogr.,
382
25(4), 463–474, doi:10.1175/1520-0485(1995)025<0463:PEITTI>2.0.CO;2.
383
Gerber, E. P., and S. W. Son (2014), Quantifying the summertime response of the Austral
384
jet stream and hadley cell to stratospheric ozone and greenhouse gases, J. Clim., 27(14),
385
5538–5559, doi:10.1175/JCLI-D-13-00539.1.
Hausmann, U., A. Czaja, and J. C. Marshall (2016), Estimates of Air-Sea Feedbacks on
387
Sea Surface Temperature Anomalies in the Southern Ocean, J. Clim., 29(2), 439–454,
388
doi:10.1175/JCLI-D-15-0015.1.
389
Holte, J., L. D. Talley, J. Gilson, and D. Roemmich (2017), An Argo mixed layer
climatol-390
ogy and database, Geophys. Res. Lett., 44(11), 5618–5626, doi:10.1002/2017GL073426.
391
Jones, J. M., S. T. Gille, H. Goosse, N. J. Abram, P. O. Canziani, D. J. Charman,
392
K. R. Clem, X. Crosta, C. de Lavergne, I. Eisenman, M. H. England, R. L. Fogt,
393
L. M. Frankcombe, G. J. Marshall, V. Masson-Delmotte, A. K. Morrison, A. J.
394
Orsi, M. N. Raphael, J. A. Renwick, D. P. Schneider, G. R. Simpkins, E. J. Steig,
395
B. Stenni, D. Swingedouw, and T. R. Vance (2016), Assessing recent trends in
high-396
latitude Southern Hemisphere surface climate, Nat. Clim. Chang., 6(10), 917–926, doi:
397
10.1038/nclimate3103.
398
Kostov, Y., J. C. Marshall, U. Hausmann, K. C. Armour, D. Ferreira, and M. M. Holland
399
(2017), Fast and slow responses of Southern Ocean sea surface temperature to SAM in
400
coupled climate models, Clim. Dyn., 48(5-6), 1595–1609,
doi:10.1007/s00382-016-3162-401
z.
402
Kostov, Y., D. Ferreira, K. C. Armour, and J. C. Marshall (2018), Contributions of
green-403
house gas forcing and the Southern Annular Mode to historical Southern Ocean surface
404
temperature trends, Geophys. Res. Lett., doi:10.1002/2017GL074964.
405
Marshall, G. J. (2003), Trends in the Southern Annular Mode from
Obser-406
vations and Reanalyses, J. Clim., 16(24), 4134–4143,
doi:10.1175/1520-407
0442(2003)016<4134:TITSAM>2.0.CO;2.
408
Marshall, J. C., and T. Radko (2003), Residual-Mean Solutions for the Antarctic
Circum-409
polar Current and Its Associated Overturning Circulation, J. Phys. Oceanogr., 33(11),
410
2341–2354, doi:10.1175/1520-0485(2003)033<2341:RSFTAC>2.0.CO;2.
411
Marshall, J. C., and K. Speer (2012), Closure of the meridional overturning circulation
412
through Southern Ocean upwelling, Nat. Geosci., 5, doi:10.1038/NGEO1391.
413
Marshall, J. C., K. C. Armour, J. R. Scott, Y. Kostov, U. Hausmann, D. Ferreira, T. G.
414
Shepherd, and C. M. Bitz (2014), The ocean’s role in polar climate change:
asym-415
metric Arctic and Antarctic responses to greenhouse gas and ozone forcing,
Phi-416
los. Trans. R. Soc. A Math. Phys. Eng. Sci., 372(2019), 20130,040–20130,040, doi:
417
10.1098/rsta.2013.0040.
Marshall, J. C., J. R. Scott, K. C. Armour, J.-M. Campin, M. Kelley, and A. Romanou
419
(2015), The ocean’s role in the transient response of climate to abrupt greenhouse gas
420
forcing, Clim. Dyn., 44(7-8), 2287–2299, doi:10.1007/s00382-014-2308-0.
421
Meredith, M. P., and A. M. Hogg (2006), Circumpolar response of Southern Ocean eddy
422
activity to a change in the Southern Annular Mode, Geophys. Res. Lett., 33(16), 2–5,
423
doi:10.1029/2006GL026499.
424
Munday, D. R., H. L. Johnson, and D. P. Marshall (2013), Eddy Saturation of
Equili-425
brated Circumpolar Currents, J. Phys. Oceanogr., 43(3), 507–532,
doi:10.1175/JPO-D-426
12-095.1.
427
Polvani, L. M., D. W. Waugh, G. J. P. Correa, and S.-W. Son (2011), Stratospheric Ozone
428
Depletion: The Main Driver of Twentieth-Century Atmospheric Circulation Changes in
429
the Southern Hemisphere, J. Clim., 24(3), 795–812, doi:10.1175/2010JCLI3772.1.
430
Purich, A., W. Cai, M. H. England, and T. Cowan (2016), Evidence for link between
mod-431
elled trends in Antarctic sea ice and underestimated westerly wind changes, Nat.
Com-432
mun., 7, 10,409, doi:10.1038/ncomms10409.
433
Reynolds, R. W., N. A. Rayner, T. M. Smith, D. C. Stokes, and W. Wang (2002), An
im-434
proved in situ and satellite SST analysis for climate, J. Clim., 15(13), 1609–1625, doi:
435
10.1175/1520-0442(2002)015<1609:AIISAS>2.0.CO;2.
436
Roemmich, D., and J. Gilson (2009), The 2004-2008 mean and annual cycle of
temper-437
ature, salinity, and steric height in the global ocean from the Argo Program, Prog.
438
Oceanogr., 82(2), 81–100, doi:10.1016/j.pocean.2009.03.004.
439
Screen, J. A., N. P. Gillet, D. P. Stevens, G. J. Marshall, and H. K. Roscoe (2009), The
440
role of eddies in the Southern Ocean temperature response to the southern annular
441
mode, J. Clim., 22(3), 806–818, doi:10.1175/2008JCLI2416.1.
442
Seviour, W. J., A. Gnanadesikan, D. Waugh, and M. A. Pradal (2017a), Transient response
443
of the Southern Ocean to changing ozone: Regional responses and physical
mecha-444
nisms, J. Clim., 30(7), 2463–2480, doi:10.1175/JCLI-D-16-0474.1.
445
Seviour, W. J., D. W. Waugh, L. M. Polvani, G. J. Correa, and C. I. Garfinkel (2017b),
446
Robustness of the simulated tropospheric response to ozone depletion, J. Clim., 30(7),
447
2577–2585, doi:10.1175/JCLI-D-16-0817.1.
448
Seviour, W. J. M., A. Gnanadesikan, and D. W. Waugh (2016), The Transient Response
449
of the Southern Ocean to Stratospheric Ozone Depletion, J. Clim., 29(20), 7383–7396,
450
doi:10.1175/JCLI-D-16-0198.1.
Sigmond, M., and J. C. Fyfe (2010), Has the ozone hole contributed to increased
Antarc-452
tic sea ice extent?, Geophys. Res. Lett., 37(18), doi:10.1029/2010GL044301.
453
Sigmond, M., and J. C. Fyfe (2013), The Antarctic Sea Ice Response to the Ozone Hole
454
in Climate Models, J. Clim., 27, 1336–1342, doi:10.1175/JCLI-D-13-00590.1.
455
Sinha, A., and R. P. Abernathey (2016), Time Scales of Southern Ocean Eddy
Equilibra-456
tion, J. Phys. Oceanogr., 46(9), 2785–2805, doi:10.1175/JPO-D-16-0041.1.
457
Viebahn, J., and C. Eden (2010), Towards the impact of eddies on the response of
458
the Southern Ocean to climate change, Ocean Model., 34(3-4), 150–165, doi:
459
10.1016/j.ocemod.2010.05.005.
0 2 4 6 8 10 Time (years) 0.15 0.10 0.05 0.00 0.05 0.10 0.15 T emp erature anomaly ( C) a) Overturning anomaly SST anomaly
Inversion temp. anomaly Predicted temp. anomaly from wresT / z
0 500 1000 1500 2000 2500 3000 400 350 300 250 200 150 100 50 0 Depth (m)
b) Zonal mean temperature anomaly after one month
vertical diff usion horizon tal adv ection
vertical advection
sum 1.0 0.5 0.0 0.5 1.0 1.5 T endency anomaly ( Cs 1) 107 c)
Below mixed layer
vertical diff usion horizon tal adv ection
vertical advection
sum 1.0 0.5 0.0 0.5 1.0 1.5 109 d) Temperature inversion 0.3 0.2 0.1 0.0 0.1 0.2 0.3 MOC anomaly (Sv) -70 -65 -60 -55 -50 -45 -40
Latitude (km (upper), degrees (lower))
0.015 0.010 0.005 0.000 0.005 0.010 0.015 T emp erature anomaly ( C) 0.3 0.2 0.1 0.0 0.1 0.2 0.3
Figure 3. a) Time series of anomalous residual overturning circulation at the red "star" shown in figure 2 (black line, right axis), the average SST anomaly between y = 500 and 2500 km (orange line), the inversion temperature anomaly at 179 m depth between y = 1200 and 1600 km (green line), and the predicted inversion temperature anomaly calculated using the average anomalous upwelling in the first two years and the vertical temperature gradient (dashed red line). The temperature scale is shown on the left hand axis, and both tem-perature time series have been smoothed with 12 month running means. b) zonal mean temtem-perature anomaly after one month of perturbed forcing (colors, note the change in color scale at the horizontal pink line at 90 m depth), the light gray contours show the climatological model temperature field in February (1 C contour interval, negative contours dashed), and the thick black line shows the zonal mean mixed layer depth from the perturbation ensemble. c) and d) heat budgets showing that the anomalous warming below the mixed layer is due to enhanced vertical mixing, while the warming at the temperature inversion is due to enhanced upwelling. The colors of the bar plots are matched to the rectangles shown in b). The contribution from horizontal mixing is negligible, and thus not shown. Note the different vertical scales in c) and d).
176 177 178 179 180 181 182 183 184 185 186 187 188
0 5 10 15 20 25 30 35 40 Time (years) 0.10 0.05 0.00 0.05 0.10 T emp erature anomalies ( C) b) Overturning anomaly SST anomaly
Inversion temp. anomaly Predicted temp. anomaly from wresT / z
75 70 65 60 55 50 45 40 Latitude 500 400 300 200 100 0 Depth (m) c) 0 250 500 750 Pressure (hP a) a) 80 60 40 20 0 20 40 60 80 Latitude 4000 2000 0 Depth (m) 1.5 1.0 0.5 0.0 0.5 1.0 1.5 Zonal wind anomaly (m s 1) 20 10 0 10 20 MOC (Sv) 0.6 0.4 0.2 0.0 0.2 0.4 0.6 MOC anomaly (Sv) 0.03 0.02 0.01 0.00 0.01 0.02 0.03 T emp erature anomaly ( C) 0.3 0.2 0.1 0.0 0.1 0.2 0.3
Figure 4. a) Upper panel: zonal mean zonal wind in January (contours with 5 ms 1contour interval, zero
and negative contours dashed) and zonal mean zonal wind anomalies due to ozone perturbation (colors). Lower panel: time-averaged residual overturning circulation from the control simulation. b) time series of the anomalous residual overturning circulation (blue line, right axis) extracted at the red star in a) located at 65 S and 492 m depth. Time series of the anomalous temperature at the temperature inversion (73-63 S, 328 m depth, green line), the SST anomaly (70-55 S, orange line), and the anticipated temperature anomaly at the inversion calculated from the average anomalous upwelling and vertical temperature gradient (dashed red line), with temperature scale shown on the left hand axis. All lines represent ensemble means and have been smoothed with a five year running mean. The thin and thick gray vertical shaded regions show the variability of the control ensemble SST and represent 1 and 2 respectively. c) zonal mean temperature anomaly (col-ors) in February of the second year of the simulation, and the climatological temperature in February from the control ensemble (gray contours, contour interval 1 C, negative contours dashed). The vertical dipole of cool-ing and warmcool-ing centered on the mixed layer depth can be clearly seen, as can the warmcool-ing at the temperature inversion. The zonal mean mixed layer depth from the perturbation ensemble is shown by the black line. Note the change in color scale either side of the horizontal pink line at 171 m depth.
262 263 264 265 266 267 268 269 270 271 272 273 274 275 276
Supporting Information for
“Eddy compensation dampens Southern Ocean SST response to westerly
wind trends”
Edward W. Doddridge1, John Marshall1, Hajoon Song1,2, Maxwell Kelley3, and Larissa
Nazarenko3
1Earth, Atmospheric and Planetary Science, Massachusetts Institute of Technology, 77 Massachusetts Avenue, Cambridge, 02139, USA
2Department of Atmospheric Sciences, Yonsei University, 134 Sinchon-dong, Seodaemun-gu, Seoul, 120-749, Korea 3NASA Goddard Institute for Space Studies, 2880 Broadway, New York, NY 10025 USA
Contents
1. Text S1 - Configuration of the channel model
2. Text S2 - Configuration and numerical details of the GISS coupled model
3. Figure S1 - Annual mean temperature, salinity, and zonal velocity in channel model 4. Figure S2 - Meridional overturning circualtion in channel model
5. Figure S3 - Atmospheric perturbations applied to channel model Text S1.
An eddy-rich channel model is prepared using MIT general circulation model (MIT-gcm) [Marshall et al., 1997b,a; Adcroft et al., 1997; Marshall et al., 1998] to represent the Southern Ocean and the ACC. The domain has a size of 1200 km by 3200 km in zonal and meridional directions respectively, with 4 km horizontal resolution. There are 50 ver-tical levels from the surface to 4000 m. The top 50 m is resolved at every 10 m, and the intervals between levels increases to 100 m towards the bottom. There is a 300 m deep, 80 km wide shelf near the southern boundary that drops to the bottom within 300 km of the southern boundary.
Temperature and salinity from the World Ocean Atlas version 2 [Locarnini et al., 2013; Zweng et al., 2013] along 30 E were extended zonally within the model domain and used to initialize the model. The east and west boundaries are connected; when fluid
leaves from one side, it re-enters from the other. The northern and southern boundaries are closed, although there is an approximately 100 km wide sponge layer at the northern boundary where temperature and salinity are relaxed to the initial conditions with a 10 day timescale. This sponge region allows for the presence of a meridional overturning circula-tion within the model domain.
A sea-ice model is coupled to the MITgcm to simulate the change of the sea-ice properties such as concentration, thickness and velocity. The thermodynamics of the sea-ice model is based on the formulation by Winton [2000] where the sea-sea-ice and snow thick-ness are calculated using heat fluxes from the top and bottom surfaces. The sea-ice dy-namics is based on the elastic-viscous-plastic method by Hunke and Dukowicz [1997] where both atmospheric, oceanic and internal stresses drive the sea-ice movement. A de-tailed description of the sea-ice model can be found in Losch et al. [2010]. The sea-ice model was initialized with 1 m thick layer of sea-ice covering everywhere south of 56 S.
The ocean in the channel was forced by monthly mean atmospheric data from the Corrected Normal Year Forcing Version 2.0 product [Large and Yeager, 2009] through bulk formulae [Large and Pond, 1982]. As with the initial conditions, the values along 30 E were extended to cover the channel, so there is no zonal variation in surface forc-ing. The model was then integrated for 50 model years with the vertical mixing computed with the turbulent kinetic energy scheme by Gaspar et al. [1990] by which time the model reaches a quasi-equilibrium. Upon reaching a quasi-equilibrium, perturbation experiments are initiated in January by modifying the imposed atmospheric fields.
Tracer distributions
One of the important characteristics observed near the seasonal sea-ice zone is the temperature inversion; cold and fresh water sits above warm and salty water and insu-lates sea-ice from the warmth below. Our model reproduces this temperature inversion in the near surface ocean (figure S1(a)). The mass of warm (above 0 C) and salty (salin-ity greater than 34.7 psu) water reaches well beyond the winter time ice edge, and finishes close to 65 S. The upwelling branch of both overturning cells is responsible for the deliv-ery of this water-mass (figure S2). The presence of a temperature inversion indicates that salinity dominates the density field in this region.
The water-mass on the shelf is very fresh (< 34 psu) and light when compared with the water further offshore (figure S1(b)), resulting in a strong horizontal density gradient. As might be anticipated from thermal wind, we see a strong westward zonal flow in this region. To the north of 67 S, the density decreases with the latitude, and the zonal flow is eastward (figure S1(c)).
Overturning circulations
The channel model reproduces the two-cell structure well (figure S2). The upper cell and lower cell separate close to the location of zero zonal wind stress, where the merid-ional Ekman transports diverge (figure S2. Fluid upwells along the the interface between the two cells (Figure S2); this is what supplies the warm salty water to the subsurface in the seasonal ice zone. At the surface, the upper cell moves fluid equatorwards while the lower cell transports waters toward the pole. The subduction of dense water in the lower cell occurs near 67 S and sets the abyssal water properties of our model.
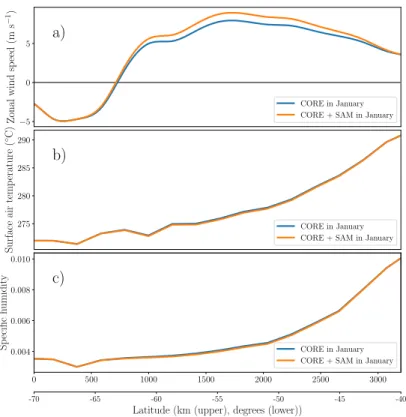
Imposed atmospheric anomalies
We mimic the effect of an increasingly positive Southern Annular Mode by impos-ing zonal wind speed, surface humidity, and surface temperature anomalies in the austral summer months. The use of specified atmospheric fields is equivalent to an atmosphere with an infinite heat capacity, which means that the atmosphere-ocean fluxes are too large if the temperature and humidity fields are left unmodified. The control and perturbed ver-sions of surface temperature, specific humidity, and zonal wind speed from January are shown in figure S3.
Text S2
This study employs GISS modelE version 2.1 (E2.1) in a configuration retaining the same horizontal and vertical resolutions as the version 2 described by Schmidt et al. [2014]. The atmospheric component is on a 2x2.5 degree latitude-longitude grid with 40 layers and a top at 0.1 hPa. The sea ice component is on the atmospheric grid. The ocean component is on a 1x1.25 degree latitude-longitude grid with 32 mass layers down to 4990 m; the nominal depths of the top 8 layer interfaces are at 12, 30, 56, 92, 140, 202, 280, and 376 m.
E2.1 features numerous updates to physical parameterizations and numerics which will be described as part of the documentation of GISS submissions to CMIP6. Primar-ily due to improvements to the ocean mesoscale scheme, its Southern Ocean climatology is significantly better than that of E2, which suffered from weak stratification and too lit-tle sea ice. The representation of eddy-induced circulation employs a Gent-McWilliams form [Gent and Mcwilliams, 1990; Gent et al., 1995], with a three-dimensional diffusivity
equal to that for isoneutral mixing of tracers [Redi, 1982]. This diffusivity Kmesohas an
interactive local dependence on the magnitude of density gradients, as well as their
verti-cal structure: Kmeso = K0PR. The surface diffusivity K0 follows Visbeck et al. [1997] in
its use of the spatially varying Eady growth rate but has been simplified to use a constant horizontal length scale (J. Marshall, pers. comm.):
K0=C(Teady) 1, (1)
where C = (38.7km)2 and (Teady) 1 ={|sN|}, where s is the slope of neutral surfaces, N
is the Brunt-Vaisala frequency, and {} denotes averaging over the upper D meters of ocean depth. D is calculated as
D = min(max(zbot,400m), 1000m), (2)
where zbot is the local ocean depth. This means that the average is always taken over at
least 400 m. When zbot is less than 400 m, the product sN is assumed to be zero between
400 m and zbot.
Vertical variation in the strength of the parametrized eddies in introduced through
the non-dimensional profile factor P = e z/zs c al e, which represents the surface
intensi-fication of eddy activity. The vertical scale characterizes the depth over which surface-connected eddies are active, and is calculated as
zscale=[|⇢hz|]
[|⇢h|], (3)
in which [] denotes vertical integration from min(zbot,3000m) to the surface, and ⇢h is
the horizontal gradient of density. A qualitative representation of the enhancement of eddy diffusivity at low latitudes (due to the larger Rossby radius and length scales there) is
in-cluded via R = 1/max(0.1, sin(|latitude|)). The eddy-induced streamfunction (not shown) has its largest magnitude and is deepest in the Southern Ocean, mostly canceling the Dea-con cell. Mainly by analogy to this climatological eddy compensation, we believe that the parametrized eddy response to a wind-perturbation tilting of high-latitude isopycnals is a negative feedback. The interactivity of the eddy diffusivity was designed for its ability to distinguish the Southern Ocean regime (slowly decaying P, large K0) from other basins and did not target apparent eddy compensation timescales there. The appearance of a
fac-tor of s in K0 causes the eddy-induced streamfunction = Kmesosto depend on s to the
second power, and the dependence of P on ⇢h likely further increases the exponent.
The ocean employs the KPP scheme for vertical mixing, with the addition of a diffu-sivity associated with tidal dissipation near the seafloor. Mixed-layer depths in the South-ern Ocean compare reasonably well to observations, peaking in the core of the ACC.
Prescription of the ozone hole in E2.1
A separate atmospheric chemistry model was used to create ozone fields for the GISS E2.1 simulations. The Community Earth System Model version 1 (CESM1), Whole Atmosphere Community Climate Model (WACCM), is a chemistry climate model from the Earth’s surface to the lower thermosphere [Garcia et al., 2007; Kinnison et al., 2007;
Marsh et al., 2013] . WACCM is superset of the Community Atmosphere Model,
ver-sion 4 (CAM4), and includes all of the physical parameterizations of CAM4 [Neale et al., 2013] and a finite volume dynamical core [Lin, 2004] for the tracer advection. The hor-izontal resolution is 1.9 latitude x 2.5 longitude. The vertical resolution in the lower stratosphere ranges from 1.2 km near the tropopause to about 2 km near the stratopause; in the mesosphere and thermosphere the vertical resolution is 3km. The version of CESM1 (WACCM) used in this work was updated for the Chemistry Climate Model Initiative (CCMI) assessment [Morgenstern et al., 2017]. Improvements in CESM1 (WACCM) for CCMI includes a modification to the orographic gravity wave forcing that reduced the cold bias in Antarctic polar temperatures [Garcia et al., 2017] and updates to the strato-spheric heterogeneous chemistry which improved the representation of polar ozone deple-tion [Solomon et al., 2015]. In this work, there are two scenarios examined which span the pre-industrial, 1850s period and the near present-day, 1995-2001 period. Both scenarios include forcing of greenhouse gases (CH4, N2O, and CO2), organic halogens, volcanic surface area density and heating, and 11-year solar cycle variability for their respective
pe-riods. In the pre-industrial period, a representation of the QBO is included as described in Marsh et al. [2013]. The sea surface temperatures are based on observations (i.e., this version is not coupled to an interactive ocean). The 1995-2001 period uses the specified dynamics (SD) option in WACCM [Lamarque et al., 2012]. Here, temperature, zonal and meridional winds, and surface pressure are used to drive the physical parameterization that control boundary layer exchanges, advective and convective transport, and the hydrologi-cal cycle. The meteorologihydrologi-cal analyses are taken from the National Aeronautics and Space Administration (NASA) Global Modeling and Assimilation Office (GMAO) Modern-Era Retrospective Analysis for Research and Applications (MERRA) [Rienecker et al., 2011] and the nudging approach is described in Kunz et al. [2011]. The QBO circulation is in-herent in the MERRA meteorological fields and is therefore synchronized with that in the
â realâ atmosphere. The horizontal resolution is the same as the pre-industrial
simu-lation and the vertical resolution follows the MERRA reanalysis up to 50km. The lower stratosphere ranges from 1 km near the tropopause to about 2 km near the stratopause. The meteorological fields are nudged from the surface to 50 km; above 60 km the model meteorological fields are fully interactive, with a linear transition in between. Both ver-sions of WACCM used in this study contain an identical representation of tropospheric and stratospheric chemistry [Kinnison et al., 2007; Tilmes et al., 2016]. The species in-cluded within this mechanism are contained within the Ox, NOx, HOx, ClOx, and BrOx chemical families, along with CH4 and its degradation products. In addition, 20 primary non-methane hydrocarbons and related oxygenated organic compounds are represented along with their surface emissions. There is a total of 183 species and 472 chemical re-actions; this includes 17 heterogeneous reactions on multiple aerosol types (i.e., sulfate, nitric acid trihydrate, and water-ice).
From the aforementioned simulations, daily climatologies of zonal-mean ozone were constructed for the "preindustrial" (PI) years 1850-1860 and "ozone-hole" (OH) years 1995-2001, and smoothed to remove temporal variability on scales shorter than 10 days. For each latitude, height, and day, the ozone from the E2.1 control run was multiplied by the ratio OH/PI, with a small adjustment to preserve the vertical integral of OH-PI. Due to inter-model differences in PI ozone climatology, direct use of the absolute ozone amounts from OH would have introduced responses unrelated to the OH-PI ozone change; specifi-cation of that change in (multiplicative) anomaly form isolates the desired signal.
Figure S1
Figure S1: Annual mean (a) temperature, (b) salinity and (c) zonal velocity are plotted in shad-ings. The annual mean zonal wind stress (⌧x) is also plotted on top of (a). Gray contours are
Figure S2 37.5 37.0 36.5 36.0 2 -0.700 -0.700 -0.500 -0.300 -0.100 0.100 0.300 0.500 0.700 0.900
Residual overturning circulation in the control ensemble
0 500 1000 1500 2000 2500 3000 3000 2000 1000 0 Depth (m) -0.900 -0.700 -0.700 -0.500 -0.300 -0.100 -0.100 -0.100 -0.100 0.100 0.300 0.500 0.700 0.900 0.900 -70 -65 -60 -55 -50 -45 -40
Latitude (km (upper), degrees (lower))
1.1 0.7 0.3 0.1 0.5 0.9 1.3 Ov erturning circulation (Sv)
Figure S3 5 0 5 Zonal wind sp eed (m s 1)
a)
CORE in January CORE + SAM in January275 280 285 290 Surface air temp erature ( C)
b)
CORE in January CORE + SAM in January0 500 1000 1500 2000 2500 3000 0.004 0.006 0.008 0.010 Sp ecific humidit y
c)
CORE in January CORE + SAM in January-70 -65 -60 -55 -50 -45 -40
Latitude (km (upper), degrees (lower))
Figure S3: Atmospheric forcing fields extracted from the CORE normal year forcing set. a) zonal wind speed b) surface air temperature c) specific humidity. All fields and perturbations are from January. The surface temperature and specific humidity anomalies are small enough that the lines largely plot over the top of each other.
References
Adcroft, A. J., C. Hill, and J. C. Marshall (1997), Representation of Topography by Shaved Cells in a Height Coordinate Ocean Model, Mon. Weather Rev., 125, 2293– 2315, doi:10.1175/1520-0493(1997)125<2293:ROTBSC>2.0.CO;2.
Garcia, R. R., D. R. Marsh, D. E. Kinnison, B. A. Boville, and F. Sassi (2007), Simula-tion of secular trends in the middle atmosphere, 1950-2003, J. Geophys. Res. Atmos.,
112(9), 1–23, doi:10.1029/2006JD007485.
Garcia, R. R., A. K. Smith, D. E. Kinnison, Á. de la Cámara, and D. J. Murphy (2017), Modification of the Gravity Wave Parameterization in the Whole Atmosphere Com-munity Climate Model: Motivation and Results, J. Atmos. Sci., 74(1), 275–291, doi: 10.1175/JAS-D-16-0104.1.
Gaspar, P., Y. Grégoris, and J.-M. Lefevre (1990), A simple eddy kinetic energy model for simulations of the oceanic vertical mixing: Tests at station Papa and long-term upper ocean study site, J. Geophys. Res., 95(C9), 16,179, doi:10.1029/JC095iC09p16179. Gent, P. R., and J. C. Mcwilliams (1990), Isopycnal Mixing in Ocean
Cir-culation Models, J. Phys. Oceanogr., 20(1), 150–155, doi:10.1175/1520-0485(1990)020<0150:IMIOCM>2.0.CO;2.
Gent, P. R., J. Willebrand, T. J. McDougall, and J. C. McWilliams (1995), Parameteriz-ing Eddy-Induced Tracer Transports in Ocean Circulation Models, J. Phys. Oceanogr.,
25(4), 463–474, doi:10.1175/1520-0485(1995)025<0463:PEITTI>2.0.CO;2.
Hunke, E. C., and J. K. Dukowicz (1997), An Elasticâ Viscousâ Plastic Model for Sea Ice Dynamics, J. Phys. Oceanogr., 27(9), 1849–1867, doi:10.1175/1520-0485(1997)027<1849:AEVPMF>2.0.CO;2.
Kinnison, D. E., G. P. Brasseur, S. Walters, R. R. Garcia, D. R. Marsh, F. Sassi, V. L. Harvey, C. E. Randall, L. Emmons, J. F. Lamarque, P. Hess, J. J. Orlando, X. X. Tie, W. Randel, L. L. Pan, A. Gettelman, C. Granier, T. Diehl, U. Niemeier, and A. J. Simmons (2007), Sensitivity of chemical tracers to meteorological parameters in the MOZART-3 chemical transport model, J. Geophys. Res. Atmos., 112(20), 1–24, doi: 10.1029/2006JD007879.
Kunz, A., L. L. Pan, P. Konopka, D. E. Kinnison, and S. Tilmes (2011), Chemical and dy-namical discontinuity at the extratropical tropopause based on START08 and WACCM analyses, J. Geophys. Res. Atmos., 116(24), 1–15, doi:10.1029/2011JD016686.
Lamarque, J. F., L. K. Emmons, P. G. Hess, D. E. Kinnison, S. Tilmes, F. Vitt, C. L. Heald, E. A. Holland, P. H. Lauritzen, J. Neu, J. J. Orlando, P. J. Rasch, and G. K. Tyn-dall (2012), CAM-chem: Description and evaluation of interactive atmospheric chem-istry in the Community Earth System Model, Geosci. Model Dev., 5(2), 369–411, doi: 10.5194/gmd-5-369-2012.
Large, W. G., and S. Pond (1982), Sensible and Latent Heat Flux Measurements over the Ocean, doi:10.1175/1520-0485(1982)012<0464:SALHFM>2.0.CO;2.
Large, W. G., and S. G. Yeager (2009), The global climatology of an interannually varying air - Sea flux data set, Clim. Dyn., 33(2-3), 341–364, doi:10.1007/s00382-008-0441-3.
Lin, S.-J. (2004), A â Vertically Lagrangianâ Finite-Volume Dynamical Core
for Global Models, Mon. Weather Rev., 132(10), 2293–2307, doi:10.1175/1520-0493(2004)132<2293:AVLFDC>2.0.CO;2.
Locarnini, R. A., A. V. Mishonov, J. I. Antonov, T. P. Boyer, H. E. Garcia, O. K. Bara-nova, M. M. Zweng, C. R. Paver, J. R. Reagan, D. R. Johnson, M. Hamilton, and D. Seidov (2013), World Ocean Atlas 2013, Volume 1: Temperature, Tech. rep. Losch, M., D. Menemenlis, J. M. Campin, P. Heimbach, and C. Hill (2010), On the
for-mulation of sea-ice models. Part 1: Effects of different solver implementations and pa-rameterizations, Ocean Model., 33(1-2), 129–144, doi:10.1016/j.ocemod.2009.12.008. Marsh, D. R., M. J. Mills, D. E. Kinnison, J. F. Lamarque, N. Calvo, and L. M. Polvani
(2013), Climate change from 1850 to 2005 simulated in CESM1(WACCM), J. Clim.,
26(19), 7372–7391, doi:10.1175/JCLI-D-12-00558.1.
Marshall, J., C. Hill, L. Perelman, and A. Adcroft (1997a), Hydrostatic, quasi-hydrostatic, and nonhydrostatic ocean modeling, J. Geophys. Res. Ocean., 102(C3), 5733–5752, doi: 10.1029/96JC02776.
Marshall, J., H. Jones, and C. Hill (1998), Efficient ocean modeling using non-hydrostatic algorithms, J. Mar. Syst., 18(1-3), 115–134, doi:10.1016/S0924-7963(98)00008-6. Marshall, J. C., A. Adcroft, C. Hill, L. Perelman, and C. Heisey (1997b), A finite-volume,
incompressible Navier Stokes model for studies of the ocean on parallel computers, J.
Geophys. Res. Ocean., 102(C3), 5753–5766, doi:10.1029/96JC02775.
Morgenstern, O., M. Hegglin, E. Rozanov, F. O’Connor, N. Luke Abraham, H. Akiyoshi, A. Archibald, S. Bekki, N. Butchart, M. Chipperfield, M. Deushi, S. Dhomse, R. Gar-cia, S. Hardiman, L. Horowitz, P. Jöckel, B. Josse, D. Kinnison, M. Lin, E. Mancini, M. Manyin, M. Marchand, V. Marécal, M. Michou, L. Oman, G. Pitari, D. Plummer,
L. Revell, D. Saint-Martin, R. Schofield, A. Stenke, K. Stone, K. Sudo, T. Tanaka, S. Tilmes, Y. Yamashita, K. Yoshida, and G. Zeng (2017), Review of the global models used within phase 1 of the Chemistry-Climate Model Initiative (CCMI), Geosci. Model
Dev., 10(2), 639–671, doi:10.5194/gmd-10-639-2017.
Neale, R. B., J. Richter, S. Park, P. H. Lauritzen, S. J. Vavrus, P. J. Rasch, and M. Zhang (2013), The Mean Climate of the Community Atmosphere Model (CAM4) in Forced SST and Fully Coupled Experiments, J. Clim., 26(14), 5150–5168, doi:10.1175/JCLI-D-12-00236.1.
Redi, M. H. (1982), Oceanic Isopycnal Mixing by Coordinate Ro-tation, J. Phys. Oceanogr., 12(10), 1154–1158, doi:10.1175/1520-0485(1982)012<1154:OIMBCR>2.0.CO;2.
Rienecker, M. M., M. J. Suarez, R. Gelaro, R. Todling, J. Bacmeister, E. Liu, M. G. Bosilovich, S. D. Schubert, L. Takacs, G. K. Kim, S. Bloom, J. Chen, D. Collins, A. Conaty, A. Da Silva, W. Gu, J. Joiner, R. D. Koster, R. Lucchesi, A. Molod, T. Owens, S. Pawson, P. Pegion, C. R. Redder, R. Reichle, F. R. Robertson, A. G. Ruddick, M. Sienkiewicz, and J. Woollen (2011), MERRA: NASA’s modern-era ret-rospective analysis for research and applications, J. Clim., 24(14), 3624–3648, doi: 10.1175/JCLI-D-11-00015.1.
Schmidt, G. A., M. Kelley, L. Nazarenko, R. Ruedy, G. L. Russell, I. Aleinov, M. Bauer, S. E. Bauer, M. K. Bhat, R. Bleck, V. Canuto, Y.-h. Chen, Y. Cheng, T. L. Clune, A. D. Genio, R. D. Fainchtein, G. Faluvegi, J. E. Hansen, R. J. Healy, N. Y. Kiang, D. Koch, A. A. Lacis, A. N. Legrande, J. Lerner, K. K. Lo, E. E. Matthews, S. Menon, R. L. Miller, V. Oinas, and A. O. Oloso (2014), Journal of Advances in Modeling Earth Sys-tems contributions to the CMIP5 archive, J. Adv. Model. Earth Syst., 6, 141–184, doi: 10.1002/2013MS000265.Received.
Solomon, S., D. Kinnison, J. Bandoro, and R. Garcia (2015), Simulation of po-lar ozone depletion: An update, J. Geophys. Res., 120(15), 7958–7974, doi: 10.1002/2015JD023365.
Tilmes, S., J. F. Lamarque, L. K. Emmons, D. E. Kinnison, D. Marsh, R. R. Garcia, A. K. Smith, R. R. Neely, A. Conley, F. Vitt, M. Val Martin, H. Tanimoto, I. Simpson, D. R. Blake, and N. Blake (2016), Representation of the Community Earth System Model (CESM1) CAM4-chem within the Chemistry-Climate Model Initiative (CCMI), Geosci.
Visbeck, M., J. Marshall, T. Haine, and M. Spall (1997), Specification of Eddy Transfer Coefficients in Coarse-Resolution Ocean Circulation Models*, J. Phys. Oceanogr., 27(3), 381–402, doi:10.1175/1520-0485(1997)027<0381:SOETCI>2.0.CO;2.
Winton, M. (2000), A reformulated three-layer sea ice model, J. Atmos. Ocean. Technol.,
17(4), 525–531, doi:10.1175/1520-0426(2000)017<0525:ARTLSI>2.0.CO;2.
Zweng, M. M., J. R. Reagan, J. I. Antonov, R. A. Locarnini, A. V. Mishonov, T. P. Boyer, H. E. Garcia, O. K. Baranova, D. R. Johnson, D.Seidov, and M. M. Biddle (2013), Salinity, in World Ocean Atlas 2013, 74, vol. 2, edited by S. Levitus, p. 39, NOAA Atlas NESDIS.