HAL Id: hal-01906008
https://hal.sorbonne-universite.fr/hal-01906008
Submitted on 26 Oct 2018HAL is a multi-disciplinary open access archive for the deposit and dissemination of sci-entific research documents, whether they are pub-lished or not. The documents may come from teaching and research institutions in France or abroad, or from public or private research centers.
L’archive ouverte pluridisciplinaire HAL, est destinée au dépôt et à la diffusion de documents scientifiques de niveau recherche, publiés ou non, émanant des établissements d’enseignement et de recherche français ou étrangers, des laboratoires publics ou privés.
Eric Martin, Dominique Leguillon, Oldřich Ševeček, Raúl Bermejo
To cite this version:
Eric Martin, Dominique Leguillon, Oldřich Ševeček, Raúl Bermejo. Understanding the tensile strength of ceramics in the presence of small critical flaws. Engineering Fracture Mechanics, Elsevier, 2018, 201, pp.167 - 175. �10.1016/j.engfracmech.2018.06.021�. �hal-01906008�
Understanding the tensile strength of ceramics in the presence of small critical flaws
E. Martin1*, D. Leguillon2, O. Sevecek3, R. Bermejo4,5
1 Laboratoire des Composites Thermo-Structuraux, Université de Bordeaux, CNRS UMR 5801,
F-33600, Pessac, France.
2 Institut Jean Le Rond ∂'Alembert, Sorbonne Université, CNRS UMR 7190, F-75005 Paris,
France.
3 Institute of Solid Mechanics, Mechatronics and Biomechanics, Faculty of Mechanical
Engineering, Brno University of Technology, 616 69 Brno, Czech Republic.
4 Institut fuer Struktur- und Funktionskeramik, Montanuniversitaet Leoben, A-8700 Leoben,
Austria.
5 Department of Materials Science and Engineering, The Pennsylvania State University,
University Park, Pennsylvania 16802, USA.
* Corresponding author: martin@lcts.u-bordeaux.fr
Abstract
The objective of this paper is to analyze the effect of small critical flaws on the strength of polycrystalline ceramic materials. For this purpose, a finite fracture approach based on the coupled criterion (CC) is used to describe the initiation of a crack near a stress concentrator. The initiation criterion combines both a stress and an energy condition. The required input fracture-mechanics parameters are the tensile strength and the fracture toughness. Both a blunt and a sharp geometry are studied. The size of the starter crack developing near the stress concentrator can be easily estimated in each case when the CC is fulfilled. Based on the calculations, if the size of the defect is smaller than the characteristic material length, numerical predictions reveal that the defect (either sharp or blunt) has no effect on the strength, reaching the intrinsic tensile strength of the material. This result is in a good agreement with experimental results obtained from the strength measurements of ceramic materials with controlled flaws. It is also shown that combining two fracture tests after introducing flaws with controlled sizes enables to identify the fracture parameters of the ceramic material.
Keywords : Crack nucleation; Coupled criterion; Finite Fracture Mechanics; Tensile strength; Ceramics
1. Introduction
The use of ceramic materials has been usually motivated by their outstanding structural properties such as oxidation and corrosion resistance, high temperature stability, hardness and wear resistance. Some examples are high temperature resistant parts for metallurgical processes, wear-resistant plates for paper machines, or bio-inert implants in medicine. Technical ceramics are also required in advanced systems due to their unique functional properties, e.g. extreme non-linear dependence of electrical resistance with temperature (used in thermistors), electric field (used in varistors), and a high piezo-electric coefficient (used in sensors and actuators).
A fundamental issue affecting the functionality, lifetime and mechanical reliability of such components and systems is the initiation and uncontrolled propagation of cracks in the brittle ceramic parts. Contrary to metals or polymers, crack propagation in ceramics is usually catastrophic due to the lack of plastic deformation upon tensile loading. Ceramics are said to have low tolerance to damage, due to their low resistance to the propagation of cracks (low fracture toughness). Another limitation for applications demanding high reliability is the inherent scatter in strength caused by the different size, type and location of critical flaws in the ceramic (e.g. pores, inhomogeneities, surface defects, contact cracks), introduced during processing, machining or in service. As a result, ceramic parts hold an inherent probability to failure upon loading, their strength being characterized by a distribution function described in most cases by the Weibull theory [1].
The tensile strength of ceramics is very sensitive to the presence of flaws, which usually act as crack initiators [2]. Common critical flaws are spherical pores generated during the ceramic processing [3,4] or sharp defects introduced by surface machining [5]. The relation between such extrinsic flaws and the ceramic strength is usually assessed by estimating an “equivalent crack length” at failure [6], also called Griffith crack length which is the basis of a linear elastic fracture mechanics analysis. For instance, in the case of a blunt defect like a rounded pore, the equivalent crack length is postulated to be a small radial crack in the vicinity around the pore [7]. In case of a sharp defect like a notch, it is assumed that an array of micro-cracks along the notch wedge develops during loading, thus triggering the fracture of the brittle material [8,9]. The latter is indeed the hypothesis for measuring fracture toughness in ceramics using the Single Edge V-Notched Beam testing protocol [10].
Despite the advances in fracture mechanics, prediction of crack initiation in ceramics and the role of microstructural features in governing the fracture is still a matter of research. In
this paper, we aim to analyze the effect of small flaws on the strength of polycrystalline ceramic materials. For this purpose, a coupled (stress-energy) criterion (CC) within the framework of finite fracture mechanics is employed. It requires strength and fracture toughness values to describe the initiation of a crack near a stress concentrator. An advantage of this approach is that the critical stress can be easily determined without requiring any assumption concerning the crack length at initiation. The paper is organized in the following way. The section 2 introduces the coupled stress-energy criterion to derive the material tensile strength versus the flaw size. We focus on flaws located at the surface, which are considered to be more critical than volume flaws [2]. Both a sharp and a blunt geometry are studied. Section 3 compares numerical predictions with various experimental results obtained from strength measurements of ceramic materials with controlled flaws. Further it is shown that the fracture-mechanics material parameters can be identified by combining two fracture tests after introducing flaws with a controlled size.
2. Crack initiation in the vicinity of a surface flaw
We assume that a small surface flaw (lengtha ) is located in a ceramic sample 0 submitted to traction
σ
(Figure 1). Bi-dimensional sharp and blunt geometries are studied including a V-notch (with an opening angle 2ω
) and a half-hole. The size of this defect is supposed to be small as compared to the specimen width. Upon the critical loading σ∗, it is admitted that a crack (length
∗) initiates in the vicinity of the flaw as a consequence of the stress concentration.2.1 The Coupled Criterion
To describe this fracture event, we apply the coupled criterion (CC) which was shown to describe accurately crack initiation for many loading and structural geometries [11,12] (see also the review papers [13,14]). Use of the CC will be illustrated in the following and we just recall that this criterion combines an energy and a stress conditions.
• The energy condition necessary for crack initiation stipulates that the change in potential energy should be greater than the energy dissipated during the nucleation of a crack of length
with( ) ( )
0 2 0,
0,
c inca
G
a
A a
G
E
σ
=
≥
, (1)where E is the Young’s modulus, Ginc is the incremental energy release rate in
which the infinitesimal energy rates of the classical Griffith approach are replaced by finite energy increments and G is the fracture energy. Equation (1) is written in c bi-dimensional form omitting the thickness of the specimen.
• The second necessary condition, i.e. the stress condition for crack initiation, states that the opening normal stress σxx along the prospective crack path should be greater
than the material’s strength σc:
( )
0,
( )
0,
for
c
xx
a y
k
xxa y
y
σ
=
σ σ
≥
≤
. (2)Considering the scaling coefficients A a
( )
0, and kxx(
a y0,)
to be respectivelyincreasing and decreasing functions of and y , Leguillon [11] demonstrated that the crack increment at nucleation is obtained by combining the equalities in (1) and (2) which leads to *
(
)
(
)
2( )
* 0 * 0 2 0 0 ,,
1
xx c c c k aA a
EG
L
a
σ
a
=
=
. (3)The length defines the size of the starter crack which develops near the defect. It is * determined by solving (3) which introduces the characteristic length
( )
2 c c c EG L σ = which is exclusively related to material properties. Inserting the fracture toughness cI K with
( )
2 21
c c IG
K
E
ν
−
=
(assuming plane strain condition) leads to(
)
2 2 1 c c I c K L
ν
σ
= − where ν is Poisson’s ratio. Typical values of the fracture parameters(
c, c)
I K
σ for ceramics indicate that
c
L ranges between 40 and 400 microns [15]. The applied stress σ* at initiation takes the form
( )
(
)
* 0 * 0, c xx a k aσ
σ
= , (4-1)which can also be written as
( )
( )
* 0 * 0 0, c EG a a A aσ
= . (4-2)Since it is subjected to a mode I loading, with the stress intensity factor increasing with the crack length, the initiated crack of length will then propagate unstably to induce the * fracture of the sample. The critical stress *
( )
0
a
σ is thus considered as the ceramic strength if the flaw of length a0 is taken into account while σc is the intrinsic tensile strength which could be attained for a material without any extrinsic defect.
Comparing *
( )
0 aσ and σc with the help of (4-2) provides
( )
(
)
* 0 * 0 0 1 , c c a L a A aσ
σ
= . (5)For a given geometry of the flaw (including shape and initial length a0), equations (3) and (5)
show that
*( )
a
0 and the strength ratioσ
*( )
a
0σ
c only depend on the characteristic lengthc
L
. It is to be noted that the value0 c
L
a is a brittleness number already introduced in the
formulation of the coupled criterion by Mantic [16]. This brittleness number governs the transition from brittle to tough configurations as small brittleness numbers correspond to brittle and large to tough configurations.
2.2 Numerical predictions
Numerical predictions are based on a full field analysis performed using the finite element method. It is to be noted that a matched asymptotic approach could also be employed [17]. Standard finite element tools are used to estimate the scaling coefficients A a
( )
0, and(
0,)
xx
k a y . One has to only consider a sufficiently refined mesh in the vicinity of the defect.
The analysis is bi-dimensional under plane strain condition assumption. The specimen width h is taken to be larger than the defect length with h>10a0. A first elastic calculation provides
(
0,)
xx
k a y and the potential energy W
( )
0 prior to fracture. Additional elastic solutions with a progressive release of nodes along the pre-supposed crack path give the potential energy W( )
of the cracked structure. Based upon these values an incremental energy release rate, as a
function of the crack length, can be calculated with Ginc
( )
=W( )
0 −W( )
. Additional details
Figure 2 plots kxx
(
a y0,)
versus y a0. It clearly illustrates the higher value of the stressconcentration in the vicinity of the V-notch as compared with the blunt geometry. This stress concentration disappears as soon as y>3a0 with kxx
(
a y0,)
=1. Figure 2 also reveals that theincremental energy release rate A a
( )
0, for a sharp or a blunt geometry reaches similar valuesfor >3a0. Solving (3) allows determining
*a
0 as a function of 0 cL a
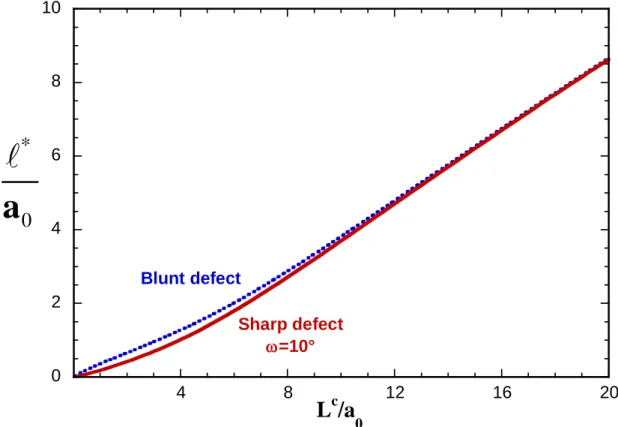
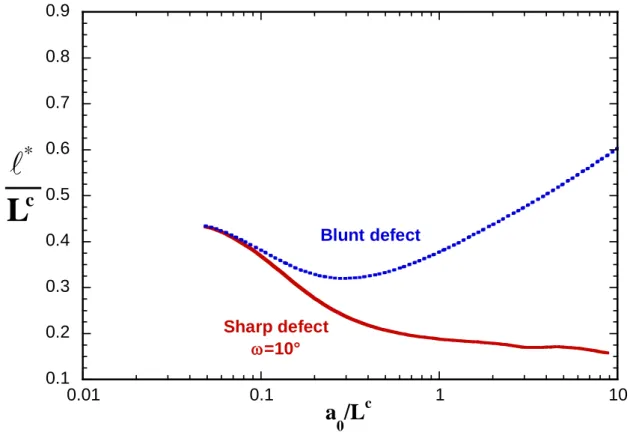
as plotted by Figure3a. This graph indicates that is proportional to * L . Figure 3b which plots c
*L
c versusa L
0 c reveals that for large values ofL
c such that Lc >10a0, similar values of the crack length at initiation are obtained for a sharp and a blunt defect with the limit *2 c
L →
.
Figure 4 represents the strength ratio
σ
*( )
a0σ
c versus the relative defect sizea L
0 c according to (5). As expected, the curve indicates a size effect whereby the strength decreases with increasing defect size. A plateau is observed withσ
*( )
a0 ≈σ
c for 0 0.1c
a < L . As previously pointed out, large values of L (and thus small values of c 0
c
a L ) induce large values
of the initiated crack length which results in * kxx
(
a0,*)
=1 and explains the presence of the plateau from (4-1). The strength value can thus reach the intrinsic strength if the flaw size is smaller than Lc 10.Conversely, for small values of L (and thus large values of c 0
c
a L ) the initiation crack
length is small. Applying an asymptotic analysis for a V-notch [19] reveals that *
( )
* 2 1 * 0 0 , A a k a λ− = , where
k
is a geometric parameter andλ
(0.5
≤ <
λ
1
) is the singularity exponent which depends on the opening angleω
[20]. Using (5) and reminding that is * proportional to L leads to c( )
1 * 0 0 c c a a L λσ
σ
− ≈ which corresponds to the straight curves observed in the Log-Log plot of Figure 4 for a V-notch with a0c 1
L > . A small value of the opening angle
45
ω < °
leads toλ
≈
0.5
with( )
1 2 * 0 0 c c a a Lσ
σ
− ≈ . In the limiting case
ω =
0
, the surface flaw reduces to an edge crack withλ
=
0.5
and the CC turns to the classical Griffith criterion with( )
(
)
1 2 * 0 0 2 1 1.12 1 c c a a Lσ
σ
π
ν
− = − (6)as also plotted (black dotted line) in Figure 4. A different behavior is obtained for the blunt
defect. For a large defect (
a
0>>
L
c), the limit is *3 c σ
σ → as already mentioned in a previous work [18]. Figure 4 also reveals that sharp and blunt geometries cannot be distinguished for a
small defect size such that 0 2
c
L a ≤ .
Figure 5 refrains from the normalized values to plot the strength σ*
versus the flaw size
0
a . To illustrate the influence of the characteristic length, the values σ1c =100 MPa and
2 200 MPa
c
σ = were selected with E=100 GPaand Gc=30 Jm-2 leading to
1 300μm
c
L = and
2 75μm
c
L = , respectively. This plot makes clear that the strength reaches the intrinsic strength provided that the defect size is small enough with 1
0 30μm
a < and 2
0 7.5μm
a < .
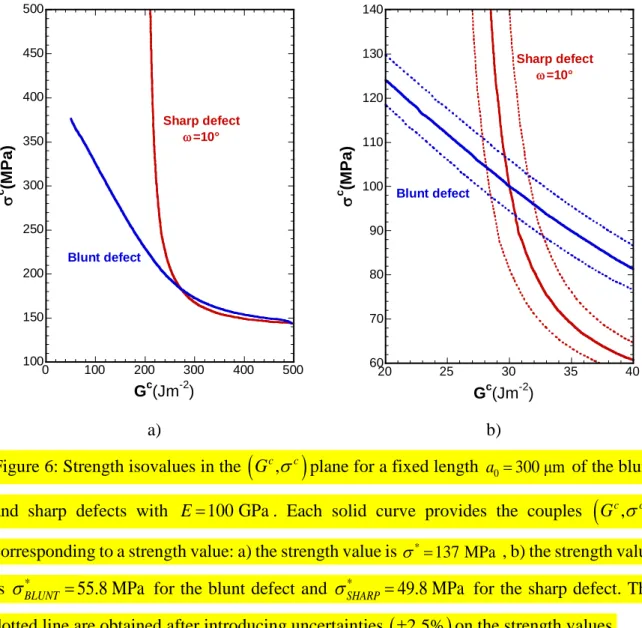
A different representation is given in Figure 6a which plots strength isovalues in the toughness-strength plane for a fixed length of the defect: each curve indicates all the couples
(
Gc,σc)
that correspond to the same strength σ*. It is observed that an isovalue combines i) an horizontal part for larger values of G as the strength c σ* mainly depends on σc, ii) a vertical part for smaller values of G as the strength c σ* mainly depends on G . As already c mentioned, the shape of the defect does not bring any difference for larger values of G and c thus higher values of L compared to c a . This representation suggests that by performing 0 fracture tests on two ceramic samples with introduced controlled flaws, the fracture parameters
(
Gc,σc)
of the material may be identified. Figure 6b represents two curves in the toughness-strength plane corresponding to a blunt and a sharp flaw of identical length a0=300 µm. ConsideringE=100 GPa, Gc =30 Jm and -2 σc=100 MPa, the strength values ( *BLUNT
σ , *
SHARP
σ ) were determined for each geometry with the help of the CC and used to plot two isovalues in the toughness-strength plane. As expected, those isovalues intersect for the chosen fracture parameters (see Fig. 6b). Experimental uncertainties
(
±2.5%)
are also plotted (dotted lines) and reveal in this case a strong influence(
±10%)
on the estimation of the fracture parameters. One can recommend to perform one of the strength test with a reduced initial length (smaller than0 300
a = µm). This will move the corresponding isovalue towards the horizontal branch and will thus reduce the influence of uncertainties.
3. Comparison with experimental results
Experimental results obtained from strength testing with controlled flaws are now compared with numerical predictions. We first refer to the study of Cook et al. which introduces indentation flaws in ceramic specimens before performing 4-point bending test [21]. Fracture data as indicated by the authors for alumina and barium titanate materials are reported in Table 1. As mentioned by the authors, special care was taken to examine the tested specimens in order to verify the site as origin of fracture. Additional micrographic observations were also performed to confirm that the size of the initial flaw which ranges from 10 to 200 microns is twice the indentation dimension. Plotting the strength ratio
σ
*( )
a0σ
c versus the relative defect sizea L
0 c allows to represent the experimental data obtained from several materials on one plot (Figure 7). A good agreement is observed with the CC prediction using a sharp V-notch (ω
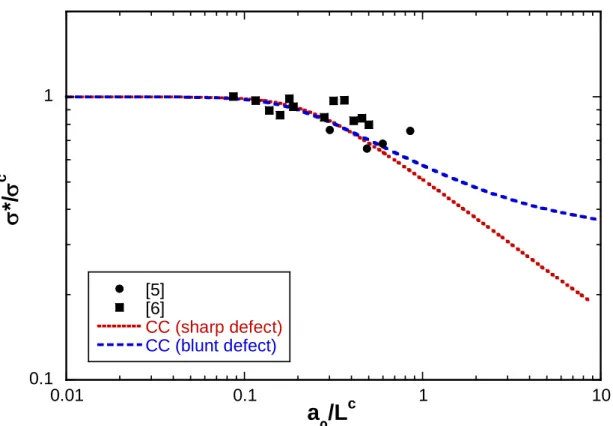
= 10°).Then the experimental data obtained on samples whose fracture originated from pores are considered. Material data from Zimmermann et al. [22] which introduces spherical pores (of diameter 85 mm) in alumina samples and from Usami et al. [6] who reported tensile strength of alumina samples with semi-circular surface defects are indicated in Table 1. A good agreement between these data and predictions of these parameters using the CC prediction is still observed - see (Figure 8). Nevertheless, it is not possible to clearly distinguish the difference between the blunt geometry and a sharp V-notch.
Figure 7 and 8 confirm that the CC estimates correctly the effect of defect size on strength. The strength plateau which is observed upon the testing of ceramics with controlled flaws is well captured. It is worth pointing out that no microstructural argument is invoked to explain the presence of this plateau which simply derives from the finite fracture mechanics approach as explained in the previous section. Similar results for brittle fracture were also obtained by another approaches like the theory of critical distance [23] or the phase field method [24] thanks to the introduction of a characteristic length. The advantage of the CC is that the characteristic length Lc is not imposed but simply derived from the physically based stress and energy conditions.
Figure 9 confirms the possibility to identify the fracture parameters with the help of two strength tests as already reported in the previous section. Using the results of Cook et al. [21] on alumina (VI1), this figure shows the strength isovalue in the
(
Gc,σc)
plane for two different
values of the sharp defect length. As recommended in section 2.2, a short length (a0=32 μm) and a larger one (a0=176 μm) were selected. Taking into account the experimental uncertainties, the intersection points of the strength isovalues in Figure 9 provides a valuable estimation of the fracture parameters with σ =c 320 26 MPa± and Gc =53.5 5 Jm± -2 (corresponding to KIc =4.6±0.2 MPa m with E=395 GPa).
It is well established that the strength of polycrystalline ceramics increases with decreasing size of the microstructure [25]. We can thus suppose that
σ
c depends on the sized of some intrinsic defects on the microstructural level, which is proportional to the average grain size g with d=αg (whereα
is a scale factor to be estimated). For a given microstructure (i.e a fixed average grain size), results in section 2.2 have demonstrated that extrinsic flaws with a length smaller than Lc 10 does not reduce the strength. Assuming that Lc 10 can be consideredas the smallest extrinsic flaw size but also as the largest intrinsic flaw size leads to 10 c L d= =αg . Reminding that
( )
2 c c c EG Lσ
= provides 1 10 c c EG g σ α = (7)which defines the variation of the intrinsic tensile strength versus the inverse square root of the average grain size. It is supposed here that the fracture toughness does not depend on g which is a reasonable assumption [25]. Figure 10 compares the tensile strength calculated using (7) with the experimental data of Chantikul et al. [26] reporting the influence of grain size on the strength of alumina. A good agreement is obtained with α =1 2. Relation (7) corresponds to the Orowan-like regime which shows a strong increase in strength with decreasing grain size. The last experimental point in Fig. 8 belongs to the Petch-like branch for fine-grained material. Using the CC, it is also possible to describe this regime taking into account the influence of residual stresses [27]. As the grain size decreases, this recent work demonstrates that an increasing numbers of grains will simultaneously be broken at the stage of crack initiation. Consequently, the anisotropic distribution of internal stresses at the grain scale influences the intrinsic strength and explains a behavior similar to that described by Petch in metals.
4. Conclusion
The influence of a small flaw on the strength of ceramic (polycrystalline) materials is evaluated using the criterion predicting crack initiation by coupling stress and energy conditions. The required fracture data are the tensile strength and the fracture toughness. The coupled criterion naturally introduces the characteristic length Lc. The main advantages of this approach are the following: i) the size and the shape of the defect are accounted for, ii) the size of the starter crack developing near the defect is estimated (it is proportional to Lc) without assessing any fixed crack increment. Numerical predictions reveal the expected strength decrease with the increasing defect size. It is not possible to distinguish a tensile strength predicted with the sharp geometry and with the blunt one for a defect size smaller than Lc 2 . Further, if the defect size is less than Lc 10, the defect can be ignored and the strength reaches a plateau corresponding to the intrinsic tensile strength.
It is to be noted that no microstructural argument is required to rationalize the presence of the strength plateau which directly comes out from the stress-energy coupling of the nucleation criterion. The approach suggests that the largest size of the intrinsic defects, which may reduce the strength, is Lc 10. Comparing this largest size with the average grain size shows that the intrinsic tensile strength is proportional to the inverse square root of the grain size and allows to recover the Orowan-like regime of the Orowan-Petch plot. Finally, it is shown that the fracture-mechanics parameters can be identified by combining two fracture tests after introducing flaws with a controlled size.
REFERENCES
[1] Danzer R. A general strength distribution function for brittle materials. Journal of the European Ceramic Society 1992;10:461–472.
[2] Danzer R. On the relationship between ceramic strength and the requirements for mechanical design. Journal of the European Ceramic Society 2014;34:3435–60. doi:10.1016/j.jeurceramsoc.2014.04.026.
[3] Kirchner HP, Gruver RM, Sotter WA. Characteristics of flaws at fracture origins and fracture stress-flaw size relations in various ceramics. Materials Science and Engineering 1976;22:147–156.
[4] Rice RW. Pores as fracture origins in ceramics. Journal of Materials Science 1984;19:895– 914.
[5] Watchman JB, Cannon WR, Matthewson ML. Mechanical properties of ceramics. John Wiley & Sons; 2009.
[6] Usami S, Kimoto H, Takahashi I and Shida S. Strength of ceramic materials containing small flaws. Engineering Fracture Mechanics 1986;23:745-761.
[7] Seidel J, Claussen N, Rödel J. Reliability of alumina ceramics: effect of grain size. Journal of the European Ceramic Society 1995;15:395–404.
[8] Fett T. Influence of a finite notch root radius on fracture toughness. Journal of the European Ceramic Society 2005;25:543–7. doi:10.1016/j.jeurceramsoc.2004.01.010.
[9] Torres Y, Bermejo R, Llanes L, Anglada M. Influence of notch radius and R-curve behaviour on the fracture toughness evaluation of WC–Co cemented carbides. Engineering Fracture Mechanics 2008;75:4422–30. doi:10.1016/j.engfracmech.2008.04.017.
[10] ISO 23146. Fine ceramics (advanced ceramics, advanced technical ceramics)- Test methods for fracture toughness of monolithic ceramics – Single-edge V-notch beam (SEVNB) method; 2008.
[11] Leguillon D. Strength or toughness? A criterion for crack onset at a notch, European Journal of Mechanics-A/Solids 2002;21:61-72.
[12] Cornetti P, Pugno N, Carpinteri A, Taylor D. Finite fracture mechanics: A coupled stress and energy failure criterion. Engineering Fracture Mechanics 2006;73:2021–33. doi:10.1016/j.engfracmech.2006.03.010.
[13] Weißgraeber P, Leguillon D, Becker W. A review of Finite Fracture Mechanics: crack initiation at singular and non-singular stress raisers. Archive of Applied Mechanics 2015. doi:10.1007/s00419-015-1091-7.
[14] Martin E, Leguillon D, Carrère N. Finite fracture mechanics: a useful tool to analyze cracking mechanisms in composite materials. in: P.W.R Beaumont & C. Soutis, editors. Fifty Years of Progress in Carbon Fiber Research, Springer; 2016, p. 529-548.
[15] Bermejo R, Danzer R. Mechanical characterization of ceramics: designing with brittle materials. in: V.K. Sarin, editor. Comprehensive Hard Materials, Oxford: Elsevier; 2014, p.285–298.
[16] Mantič V. Interface crack onset at a circular cylindrical inclusion under a remote transverse tension. Application of a coupled stress and energy criterion. International Journal of Solids and Structures 2009;46:1287–304. doi:10.1016/j.ijsolstr.2008.10.036.
[17] Leguillon D, Quesada D, Putot C, Martin E. Prediction of crack initiation at blunt notches and cavities – size effects. Engineering Fracture Mechanics 2007;74:2420–36. doi:10.1016/j.engfracmech.2006.11.008.
[18] Martin E, Leguillon D, Carrère N. A coupled strength and toughness criterion for the prediction of the open hole tensile strength of a composite plate. International Journal of Solids and Structures 2012;49:3915–22. doi:10.1016/j.ijsolstr.2012.08.020.
[19] Leguillon D, Sanchez-Palencia E. Fracture in heterogeneous materials: weak and strong singularities. in: P. Ladeveze, O.C. Zienkiewicz, editors. New advances in computational structural mechanics, Studies in applied mathematics, Vol 32, Amsterdam: Elsevier; 1992, p. 423–434.
[20] Leguillon D, Yosibash Z. Crack onset at a v-notch. Influence of the notch tip radius. International Journal of Fracture 2003;122:1–21.
[21] Cook RF, Lawn BR, Fairbanks CJ. Microstructure-Strength Properties in Ceramics: I, Effect of Crack Size on Toughness. Journal of the American Ceramic Society 1985;68:604– 615.
[22] Zimmermann A, Hoffman M, Flinn BD, Bordia RK, Chuang T-J, Fuller ER, et al. Fracture of alumina with controlled pores. Journal of the American Ceramic Society 1998;81:2449– 2457.
[23] Taylor D. Predicting the fracture strength of ceramic materials using the theory of critical distances. Engineering Fracture Mechanics 2004;71:2407–16. doi:10.1016/j.engfracmech.2004.01.002.
[24] Tanné E, Li T, Bourdin B, Marigo J-J, Maurini C. Crack nucleation in variational phase-field models of brittle fracture. Journal of the Mechanics and Physics of Solids 2017. doi:10.1016/j.jmps.2017.09.006.
the American Ceramic Society 1998;81:2527–2532.
[26] Chantikul P, Bennison SJ, Lawn BR. Role of grain size in the strength and R-curve properties of alumina. Journal of the American Ceramic Society 1990;73:2419–2427.
[27] Leguillon D, Martin E, Sevecek O, Bermejo R. What is the tensile strength of a ceramic to be used in numerical models? Accepted for publication in International Journal of Fracture 2018
a) Sharp flaw b) Blunt flaw
Figure 2: The scaling coefficients kxx
(
a y0,)
(solid lines) and A a(
0,)
(dotted lines) versus0
y a and a0 for a sharp and a blunt defect. 1 2 3 4 5 6 0 2 4 6 8 10 0 0.5 1 1.5 2 2.5 3
k
xxA
y/a
0,
/a
0 Blunt defect Sharp defect ω=10°Figure 3a: The crack length at initiation * a0 versus L a for a sharp and a blunt defect. c 0 0 2 4 6 8 10 4 8 12 16 20
L
c/a
0 Blunt defect Sharp defect ω=10°*
0
a
Figure 3b: The crack length at initiation * Lc versus a L for a sharp and a blunt defect. 0 c 0.1 0.2 0.3 0.4 0.5 0.6 0.7 0.8 0.9 0.01 0.1 1 10
a
0/L
c Blunt defect Sharp defect ω=10° * cL
Figure 4: The strength ratio *
( )
0c a
σ σ versus the relative defect size 0 c
a L for a sharp and a blunt defect. The black dotted line corresponds to relation (6) with ν =0.2.
0.2 0.3 0.4 0.5 0.6 0.7 0.8 0.9 1 0.01 0.1 1 10
σ
* /
σ
ca
0/L
c Blunt defect Sharp defect ω=10° ω=60° ω=70° GriffithFigure 5: The strength σ* versus the flaw size a0 assuming two different sets of properties ( 1 100 MPa c σ = , -2 30 Jm c G = ) and (σ2c=200 MPa, -2 30 Jm c
G = ) with E=100 GPa. The solid lines correspond to a blunt defect and the dotted lines are obtained for a sharp defect.
30 40 50 60 70 80 90 100 200 300 1 10 100 1000
σ
* (MPa)
a
0(µm)
30 µm 7.5 µm Griffith CC Sharp defect CC Blunt defect 1 cσ
2 cσ
a) b)
Figure 6: Strength isovalues in the
(
Gc,σc)
plane for a fixed length a0=300 μm of the blunt and sharp defects with E=100 GPa. Each solid curve provides the couples(
Gc,σc)
corresponding to a strength value: a) the strength value is σ*=137 MPa , b) the strength valueis
σ
*BLUNT =55.8 MPa for the blunt defect andσ
SHARP* =49.8 MPa for the sharp defect. The dotted line are obtained after introducing uncertainties(
±2.5%)
on the strength values.100 150 200 250 300 350 400 450 500 0 100 200 300 400 500 σ c (M P a ) Gc(Jm-2) Blunt defect Sharp defect ω=10° 60 70 80 90 100 110 120 130 140 20 25 30 35 40 σ c (M P a ) Gc(Jm-2) Blunt defect Sharp defect ω=10°
Figure 7: Comparison of CC predictions (dotted line) with experimental data reported in Table 1: the strength ratio
σ
*( )
a0σ
c is plotted versus the relative defect sizea L
0 cfor a sharp defect (ω
= 10°). 0.1 1 0.01 0.1 1 10 [1] [2] [3] [4] CCσ
*/
σ
ca
0/L
cFigure 8: Comparison of CC predictions (dotted lines) with experimental data reported in Table 1: the strength ratio
σ
*( )
a0σ
c is plotted versus the relative defect sizea L
0 cfor a sharp (ω
= 10°) and a blunt defect.0.1 1 0.01 0.1 1 10 [5] [6] CC (sharp defect) CC (blunt defect)
a
0/L
cσ
*/
σ
cFigure 9: Strength isovalues (full lines) taking into account experimental dispersion (dotted lines) in the
(
Gc,σc)
plane for two values of the defect length (a0 =32 μm) and 0
(a =176 μm) according to the data of alumina (VI1) reported in Table 1. The intersections of the dotted lines provide an estimation of the fracture parameters with σ =c 320 26 MPa± and Gc=53.5 5 Jm± -2. 260 280 300 320 340 360 20 30 40 50 60 70 80 a 0=32 µm a 0=176 µm
σ
c(MPa)
G
c(Jm
-2)
Figure 10: Strength versus grain size: comparison of relation (7) with the experimental data of Chantikul et al. [26] for alumina (E=350 GPa, Gc=35Jm-2, α =1 2).
0 200 400 600 800 1000 0.1 0.2 0.3 0.4 0.5 0.6 0.7
Stre
ngth
σ
c(MPa)
(grain size)
-1/2(
µm)
-1/2Material (Designation) c σ (MPa) c I K (MPa.m0.5) 2 c c I c K L σ = (µm) Reference [1] Al203 (AD999) 488 3.9 63.8 Cook et al. [21] [2] Al203 (VI1) 329 4.6 195.5 Cook et al. [21] [3] Al203 (VI2) 302 4.6 232 Cook et al. [21] [4] BaTi03 (NRL2) 85 1.35 252 Cook et al. [21] [5] Al203 638 534 481 379 4.5 4.5 4.5 4.5 49.8 71 87.3 140.7 Zimmermann et al. [22] [6] Al203 364 3.5 93 Usami et al. [6]
Table 1: Fracture-mechanics parameters as indicated by the authors for selected ceramic materials used for strength testing with controlled flaws.
Nomenclature
Parameters
A Adimensionned incremental energy release rate a0 Flaw length
d Size of intrinsic defects controlling the strength E Young’s modulus
g Average grain size Gc Fracture energy
Ginc Incremental energy release rate
h Specimen width KIc Fracture toughness
kxx Adimensionned opening normal stress
Lc Characteristic length W Potential energy α Scale factor Crack length
λ Singularity exponent at the tip of a V-notch * Crack length at initiation
ν Poisson’s ratio
σ Applied traction stress σxx Opening normal stress
σ c Strength
σ∗ Applied traction stress at initiation
ω V-notch half opening angle Superscripts
c Critical values * Values at initiation
Acronyms
Highlights
The coupled criterion is used to analyze the effect of a flaw on the strength A defect with a size smaller than the characteristic material length has no effect Introducing flaws with controlled sizes enables to identify the fracture parameters